

Dow Jones Industrial Average tumbles as Crude Oil surges past $100 a barrel
- The Dow Jones plunged over 1,000 points overnight as Crude Oil breached $100 per barrel for the first time since 2022, driven by deepening Middle East supply disruptions.
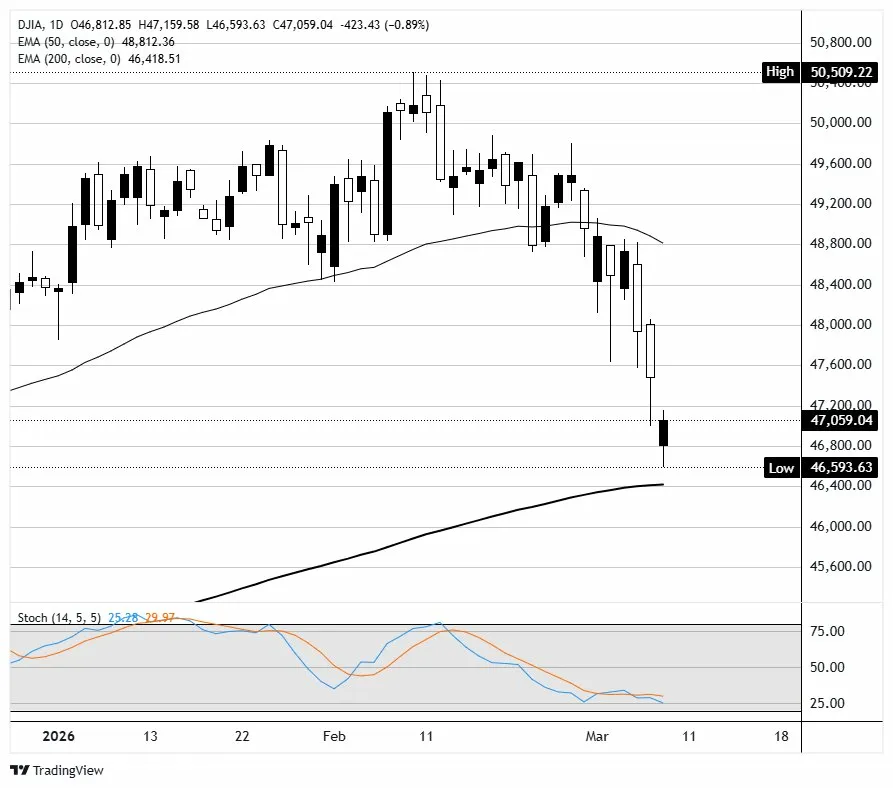
- The Dow recovered from intraday lows near 46,600 but remained firmly below Friday's closing level at the time of writing, with the S&P 500 and Nasdaq Composite also in the red.
- Airline and cruise stocks led losses as jet fuel costs spiked, while defense and energy names were among the few pockets of strength.
- February CPI data on Wednesday and January PCE on Friday headline key economic data releases this week.
The Dow Jones Industrial Average (DJIA) opened sharply lower on Monday as a weekend escalation in the US-Iran conflict sent crude Oil prices surging past $100 per barrel. At the time of writing, the DJIA was trading near 47,059, down 423 points or 0.89% on the session, after opening at 46,812 and printing an intraday low of 46,593. The S&P 500 was down approximately 1.3% near 6,653 while the Nasdaq Composite fell around 1.1% to trade near 22,146. All three major indices are now at their lowest levels of 2026. Futures had plunged more than 2% overnight before a partial recovery into the cash session open, but the bounce has so far failed to reclaim Friday's closing prices.
Oil shock sends futures into freefall overnight
West Texas Intermediate (WTI) crude Oil spiked as high as $119 per barrel late Sunday before pulling back to around $101.56, while global benchmark Brent settled near $101.81. The surge came after Saudi Arabia joined Kuwait, Bahrain, and the UAE in announcing production cuts as the blockage of the Strait of Hormuz prevented seaborne exports and pushed storage to capacity. Iraq's output from its three major oilfields has reportedly collapsed 70%, falling from 4.3 million barrels per day to just 1.3 million. The energy shock sent Dow futures down more than 1,000 points, with S&P 500 and Nasdaq 100 futures each dropping over 2% before a partial recovery heading into Monday's open. Ministers from the G7 are meeting Monday to discuss a possible coordinated release of petroleum reserves through the International Energy Agency (IEA).
Airlines and cruise lines lead the sell-off
The spike in fuel costs hammered travel stocks across the board. United Airlines (UAL) dropped over 6%, with Delta Air Lines (DAL) falling around 4.6% and Southwest Airlines (LUV) sliding roughly 4.2%. Cruise operators fared even worse. Carnival (CCL) tumbled more than 7%, Royal Caribbean Group (RCL) lost over 6%, and Norwegian Cruise Line Holdings (NCLH) declined a similar amount. Norwegian has now fallen for seven consecutive sessions, and both Carnival and Norwegian have each plunged more than 20% in March alone. Royal Caribbean is down over 14% month to date. The Dow Jones Transportation Average was on track for a 9% decline over the past three trading sessions, its worst three-day stretch since the post-tariff sell-off last April.
Defense and energy names buck the trend
While the broader market bled red, defense contractors continued to benefit from the ongoing conflict. Lockheed Martin (LMT), Northrop Grumman (NOC), and RTX (RTX) each rose roughly 1% in early trading, extending their month-to-date gains. Meanwhile, the S&P 500 Energy sector was the only index sector in the green on the day, though gains were modest. Dow Inc. (DOW) advanced over 4% following an upgrade from RBC Capital, which sees margin upside opportunities amid disruptions in the Middle East. Chevron (CVX) was one of only four Dow components trading higher. Oil's 50%-plus monthly gain in March is on pace to be the largest since April 2020, when crude was rebounding from negative prices.
Rate cut expectations fade as inflation risks mount
The oil-driven inflationary impulse is rapidly reshaping the interest rate outlook. According to the CME FedWatch tool, markets now price a 97% probability that the Federal Reserve (Fed) will hold rates unchanged at the March 17-18 Federal Open Market Committee (FOMC) meeting, with the federal funds rate steady at 3.50%-3.75%. Rate cut odds for March have collapsed to just 3%, down sharply from the roughly 23% probability priced in as recently as mid-February. Wolfe Research has flagged that a $20 per barrel increase in Oil prices could add 0.4 percentage points to headline inflation and shave 0.1% off Gross Domestic Product (GDP). Treasury yields pushed higher on Monday, reinforcing the view that the Fed will be forced to stay on the sidelines for longer despite a deteriorating labor market backdrop. February Nonfarm Payrolls (NFP) posted a surprise decline of 92K last Friday, the first negative print in years.
A loaded economic calendar adds to market uncertainty
This week's data slate is stacked with high-impact releases that will test the inflation narrative. On Wednesday, the Bureau of Labor Statistics (BLS) publishes February Consumer Price Index (CPI) data, with consensus expecting headline CPI to rise 0.3% MoM versus 0.2% prior, and the YoY rate to hold steady at 2.4%. Core CPI, excluding food and energy, is forecast at 0.2% MoM, down from 0.3%, with the annual rate expected to hold at 2.5%. Any upside surprise would further cement expectations that the Fed stays on hold well into the summer.
On Friday, attention turns to January Core Personal Consumption Expenditures Price Index (PCE) data, the Fed's preferred inflation gauge, with consensus at 0.4% MoM and 3.0% YoY, both unchanged from December. Preliminary Q4 Gross Domestic Product (GDP) is also due Friday, expected to confirm the 1.4% annualized growth rate from the advance reading. Rounding out the week, the preliminary March University of Michigan (UoM) Consumer Sentiment Index is forecast to slip to 55.0 from 56.6, reflecting the growing drag from higher energy costs and geopolitical uncertainty on household confidence.
Dow Jones daily chart
Dow Jones FAQs
The Dow Jones Industrial Average, one of the oldest stock market indices in the world, is compiled of the 30 most traded stocks in the US. The index is price-weighted rather than weighted by capitalization. It is calculated by summing the prices of the constituent stocks and dividing them by a factor, currently 0.152. The index was founded by Charles Dow, who also founded the Wall Street Journal. In later years it has been criticized for not being broadly representative enough because it only tracks 30 conglomerates, unlike broader indices such as the S&P 500.
Many different factors drive the Dow Jones Industrial Average (DJIA). The aggregate performance of the component companies revealed in quarterly company earnings reports is the main one. US and global macroeconomic data also contributes as it impacts on investor sentiment. The level of interest rates, set by the Federal Reserve (Fed), also influences the DJIA as it affects the cost of credit, on which many corporations are heavily reliant. Therefore, inflation can be a major driver as well as other metrics which impact the Fed decisions.
Dow Theory is a method for identifying the primary trend of the stock market developed by Charles Dow. A key step is to compare the direction of the Dow Jones Industrial Average (DJIA) and the Dow Jones Transportation Average (DJTA) and only follow trends where both are moving in the same direction. Volume is a confirmatory criteria. The theory uses elements of peak and trough analysis. Dow’s theory posits three trend phases: accumulation, when smart money starts buying or selling; public participation, when the wider public joins in; and distribution, when the smart money exits.
There are a number of ways to trade the DJIA. One is to use ETFs which allow investors to trade the DJIA as a single security, rather than having to buy shares in all 30 constituent companies. A leading example is the SPDR Dow Jones Industrial Average ETF (DIA). DJIA futures contracts enable traders to speculate on the future value of the index and Options provide the right, but not the obligation, to buy or sell the index at a predetermined price in the future. Mutual funds enable investors to buy a share of a diversified portfolio of DJIA stocks thus providing exposure to the overall index.
추천 기사


