
Dow Jones Industrial Average chalks up strong weekly performance post-Fed
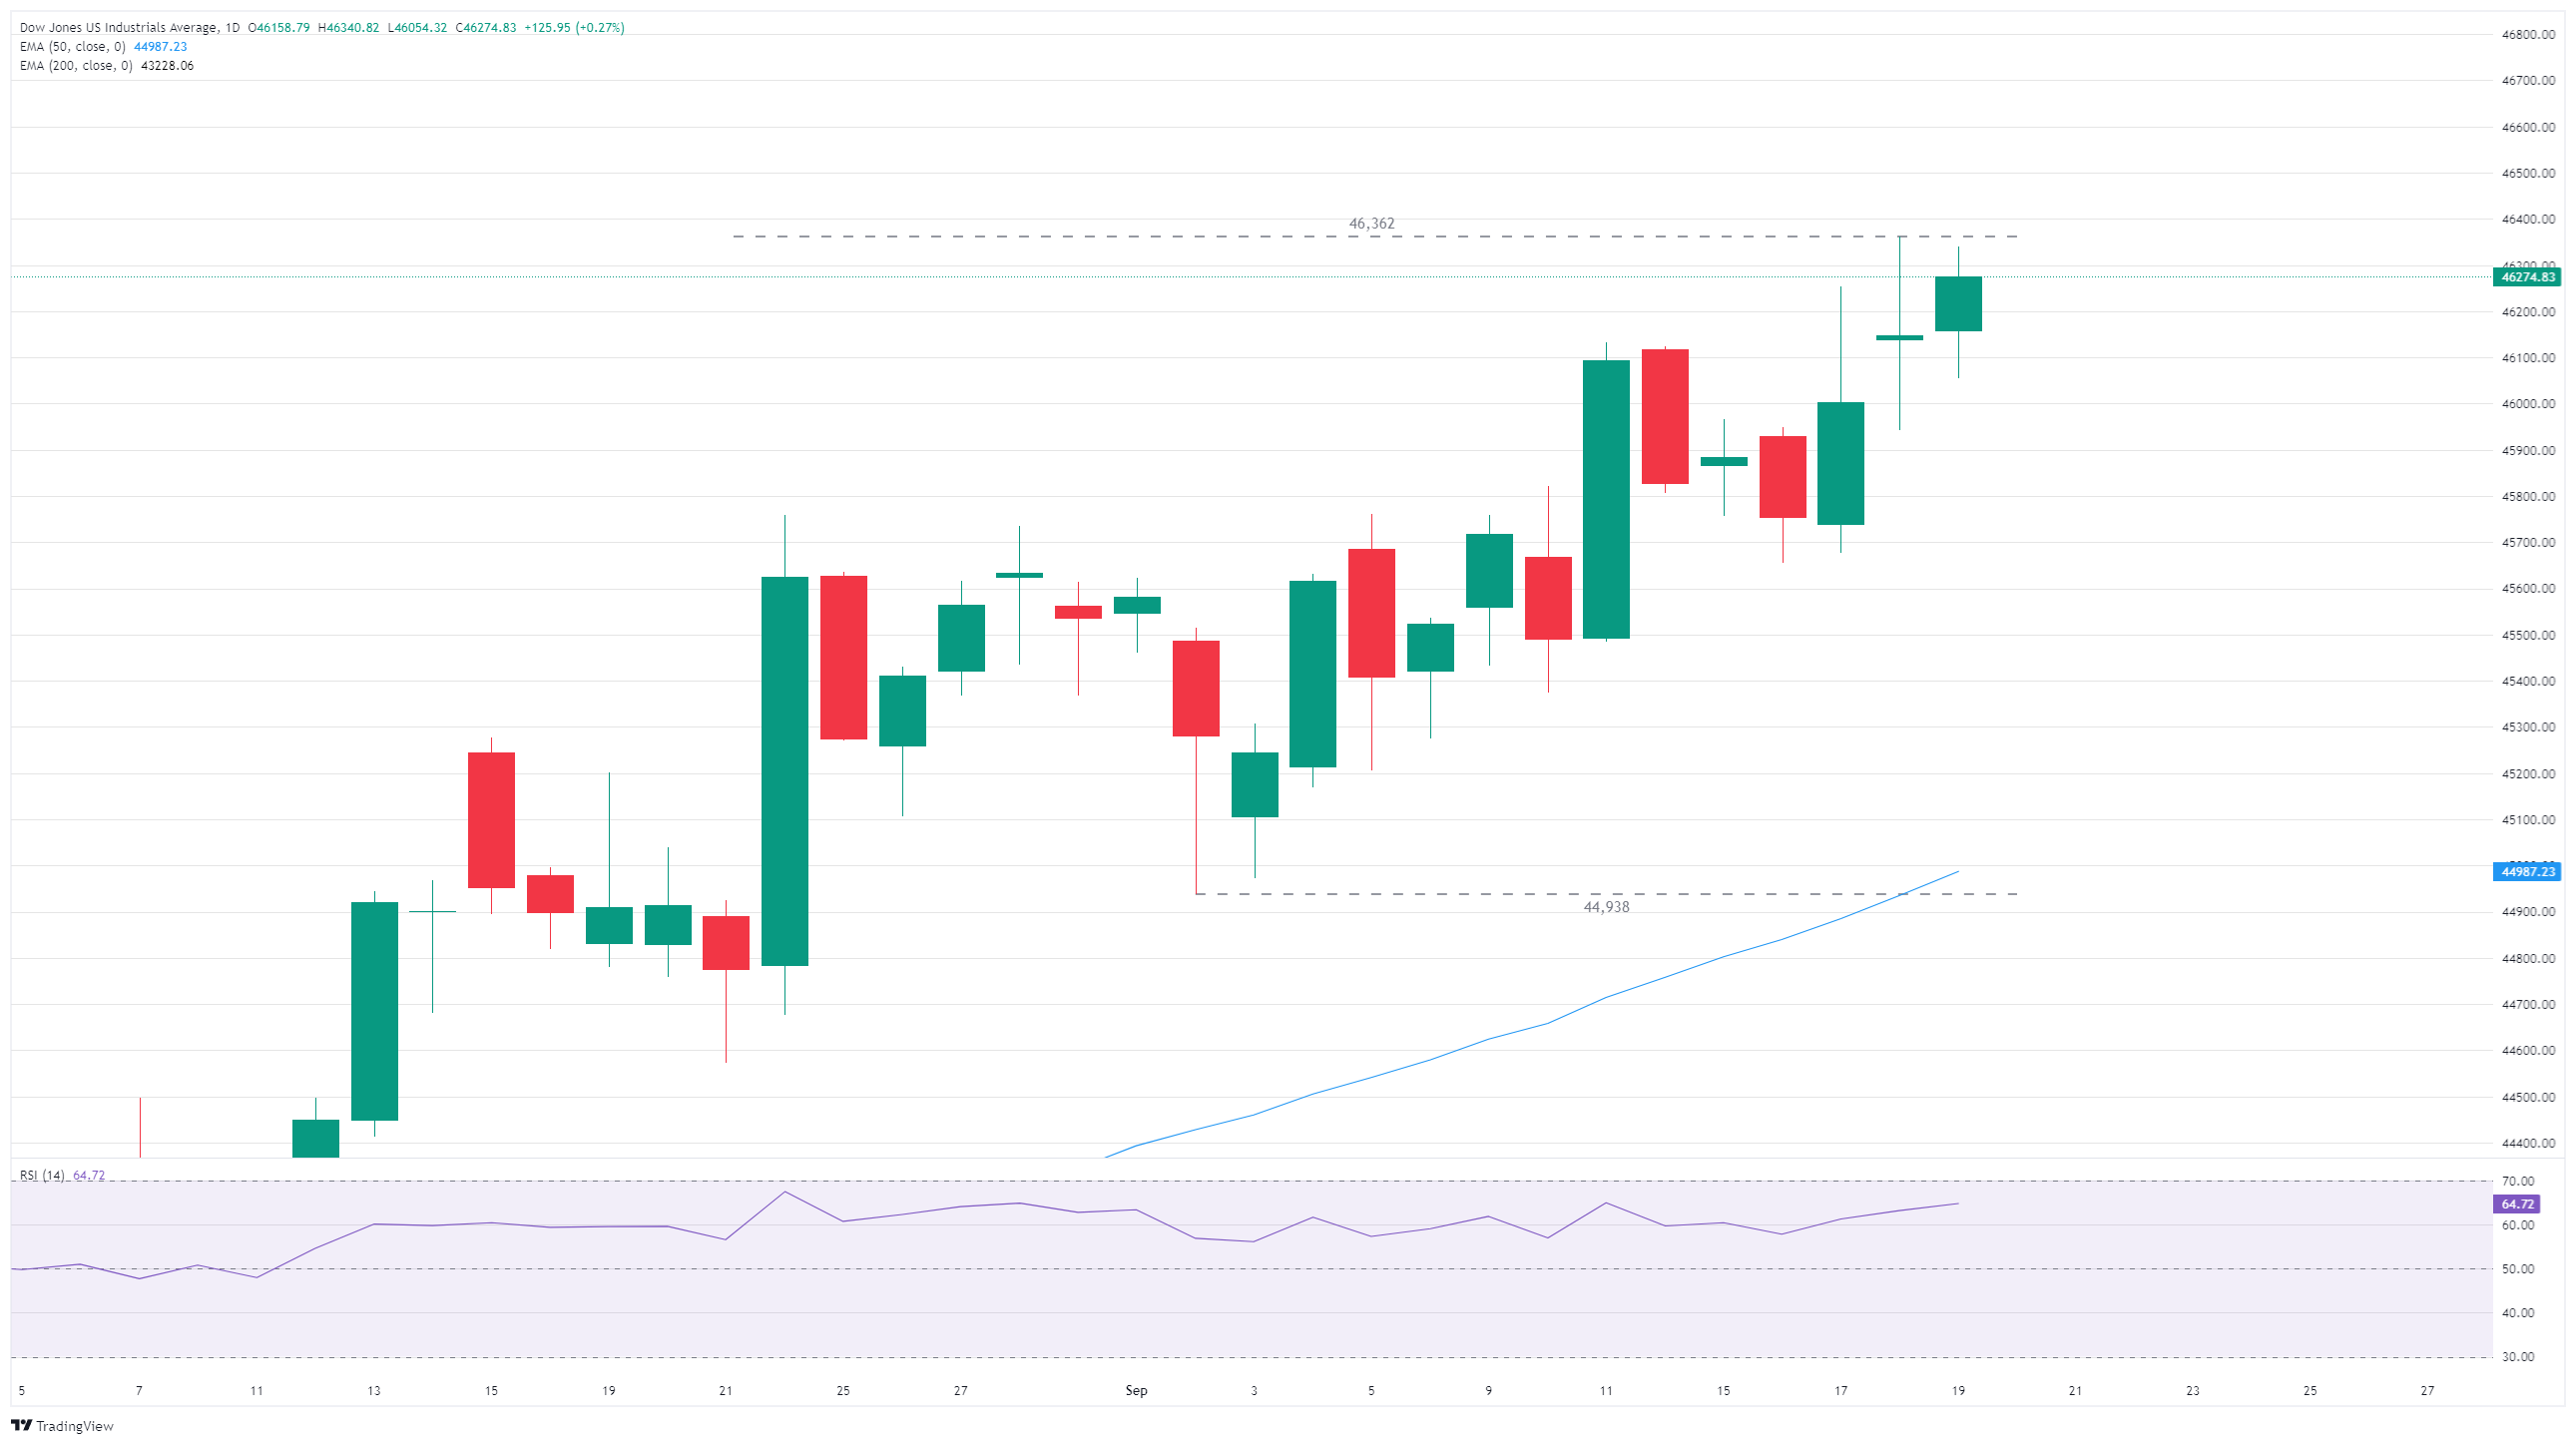
- The Dow Jones climbed into 46,250 on Friday, adding another bullish day on the backend.
- Equities have risen after the Fed trimmed interest rates through the midweek.
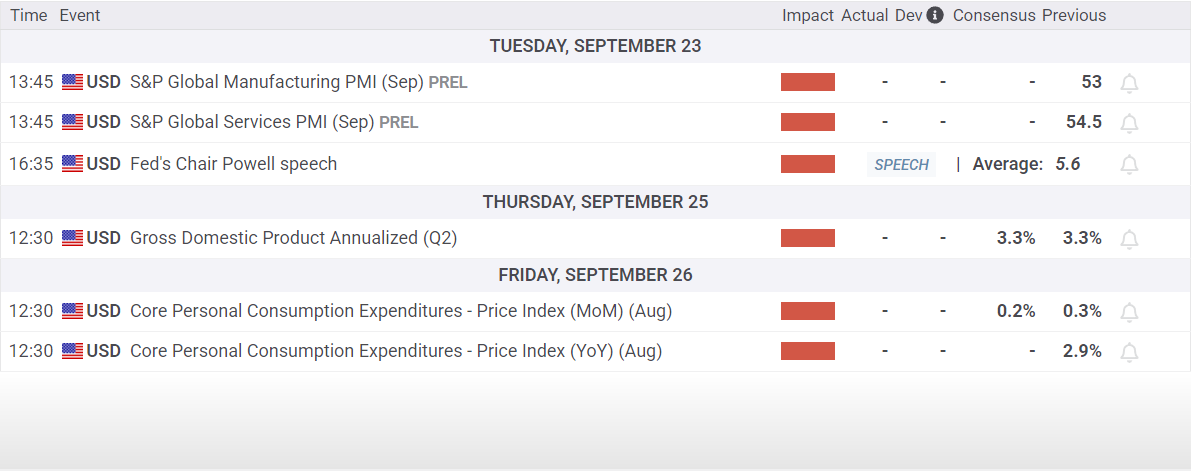
- Coming up next week: PMI survey results and another round of PCE inflation data.
The Dow Jones Industrial Average (DJIA) chalked in another slim but decisive gain on Friday, bringing the major equity index’s weekly performance to around a full percentage point gain. The Dow Jones has climbed into record highs on the back of the Federal Reserve’s (Fed) latest rate cut, and investors are positioning themselves for a series of consecutive follow-up cuts through the end of the year.
Dow climbs on Fed support
The Dow Jones has thus far put in a stellar performance, especially for late in the third quarter. While September is typically a soft season for equities, this September has bucked the trend. The Dow Jones is up over 1.6% for the month, marking in a string of high-water marks, and is on pace to close in the green for a fifth straight month.
Most sectors are on the high side for Friday, with tech stocks taking their usual place at the front of the pack, climbing 0.72% for the day. Consumer discretionary stocks took second place, rising around 0.5%, while energy stocks suffered a decline of around 1.45%.
Fresh batch of inflation data in the pipe
With the Fed’s long-awaited initial interest rate cut finally in the books, traders will have to pivot back to data watching next week. The latest round of S&P Global Purchasing Managers Index (PMI) survey results are due next Tuesday; US Gross Domestic Product (GDP) growth is scheduled for next Thursday; and an update to US Personal Consumption Expenditures Price Index (PCE) inflation is slated for next Friday.
Dow Jones daily chart
Dow Jones FAQs
The Dow Jones Industrial Average, one of the oldest stock market indices in the world, is compiled of the 30 most traded stocks in the US. The index is price-weighted rather than weighted by capitalization. It is calculated by summing the prices of the constituent stocks and dividing them by a factor, currently 0.152. The index was founded by Charles Dow, who also founded the Wall Street Journal. In later years it has been criticized for not being broadly representative enough because it only tracks 30 conglomerates, unlike broader indices such as the S&P 500.
Many different factors drive the Dow Jones Industrial Average (DJIA). The aggregate performance of the component companies revealed in quarterly company earnings reports is the main one. US and global macroeconomic data also contributes as it impacts on investor sentiment. The level of interest rates, set by the Federal Reserve (Fed), also influences the DJIA as it affects the cost of credit, on which many corporations are heavily reliant. Therefore, inflation can be a major driver as well as other metrics which impact the Fed decisions.
Dow Theory is a method for identifying the primary trend of the stock market developed by Charles Dow. A key step is to compare the direction of the Dow Jones Industrial Average (DJIA) and the Dow Jones Transportation Average (DJTA) and only follow trends where both are moving in the same direction. Volume is a confirmatory criteria. The theory uses elements of peak and trough analysis. Dow’s theory posits three trend phases: accumulation, when smart money starts buying or selling; public participation, when the wider public joins in; and distribution, when the smart money exits.
There are a number of ways to trade the DJIA. One is to use ETFs which allow investors to trade the DJIA as a single security, rather than having to buy shares in all 30 constituent companies. A leading example is the SPDR Dow Jones Industrial Average ETF (DIA). DJIA futures contracts enable traders to speculate on the future value of the index and Options provide the right, but not the obligation, to buy or sell the index at a predetermined price in the future. Mutual funds enable investors to buy a share of a diversified portfolio of DJIA stocks thus providing exposure to the overall index.
추천 기사


