
Canadian Dollar pares losses despite Retail Sales miss, bucks Greenback trend
- The Canadian Dollar found a foothold on Friday, reversing early losses.
- Canadian Retail Sales contracted more than expected in July, but Loonie bulls shrugged off the data forecast miss.
- The Canadian Dollar stood out as the strongest-performing currency on Friday.
The Canadian Dollar (CAD) shrugged off broad-market performance on Friday, chalking in a 0.15% gain against the US Dollar (USD), the second-best currency on the books for the day. Loonie traders shrugged off a wide missfire in Canadian Retail Sales figures from the summer, rejecting the day’s early losses and sending the Canadian Dollar up 0.41% bottom-to-top against the Greenback.
Canadian Retail Sales missed the mark in July, but the back-dated information did little do step on bullish Loonie flows on Friday. CAD traders are looking down the barrel of a thin economic data docket on the Canadian side, leaving an upcoming batch of key US data in the driver’s seat.
Daily digest market movers: Canadian Dollar breaks free and moves higher
- The Canadian Dollar caught a strong bullish beat on Friday, snubbing downside data and climbing across the board as Loonie bulls grow impatient.
- The CAD continues to hold out hope for a foothold from the 50-day Exponential Moving Average (EMA) on the USD/CAD chart.
- Canadian Retail Sales contracted by 0.8% in June, as expected, while core Retail Sales fell by 1.2%, a steeper decline than the forecast -0.7%.
- Despite the headline miss in core Retail Sales, previous figures were revised upwards, giving Loonie traders some hope: core Retail Sales in June were revised up to 2.2% MoM, up from the previous 1.9%.
- CAD positioning is set to be challenged next week, with US Purchasing Managers Index (PMI) survey results, US Gross Domestic Product (GDP), and US Personal Consumption Expenditures Price Index (PCE) inflation data all in the barrel.
Canadian Dollar price forecast
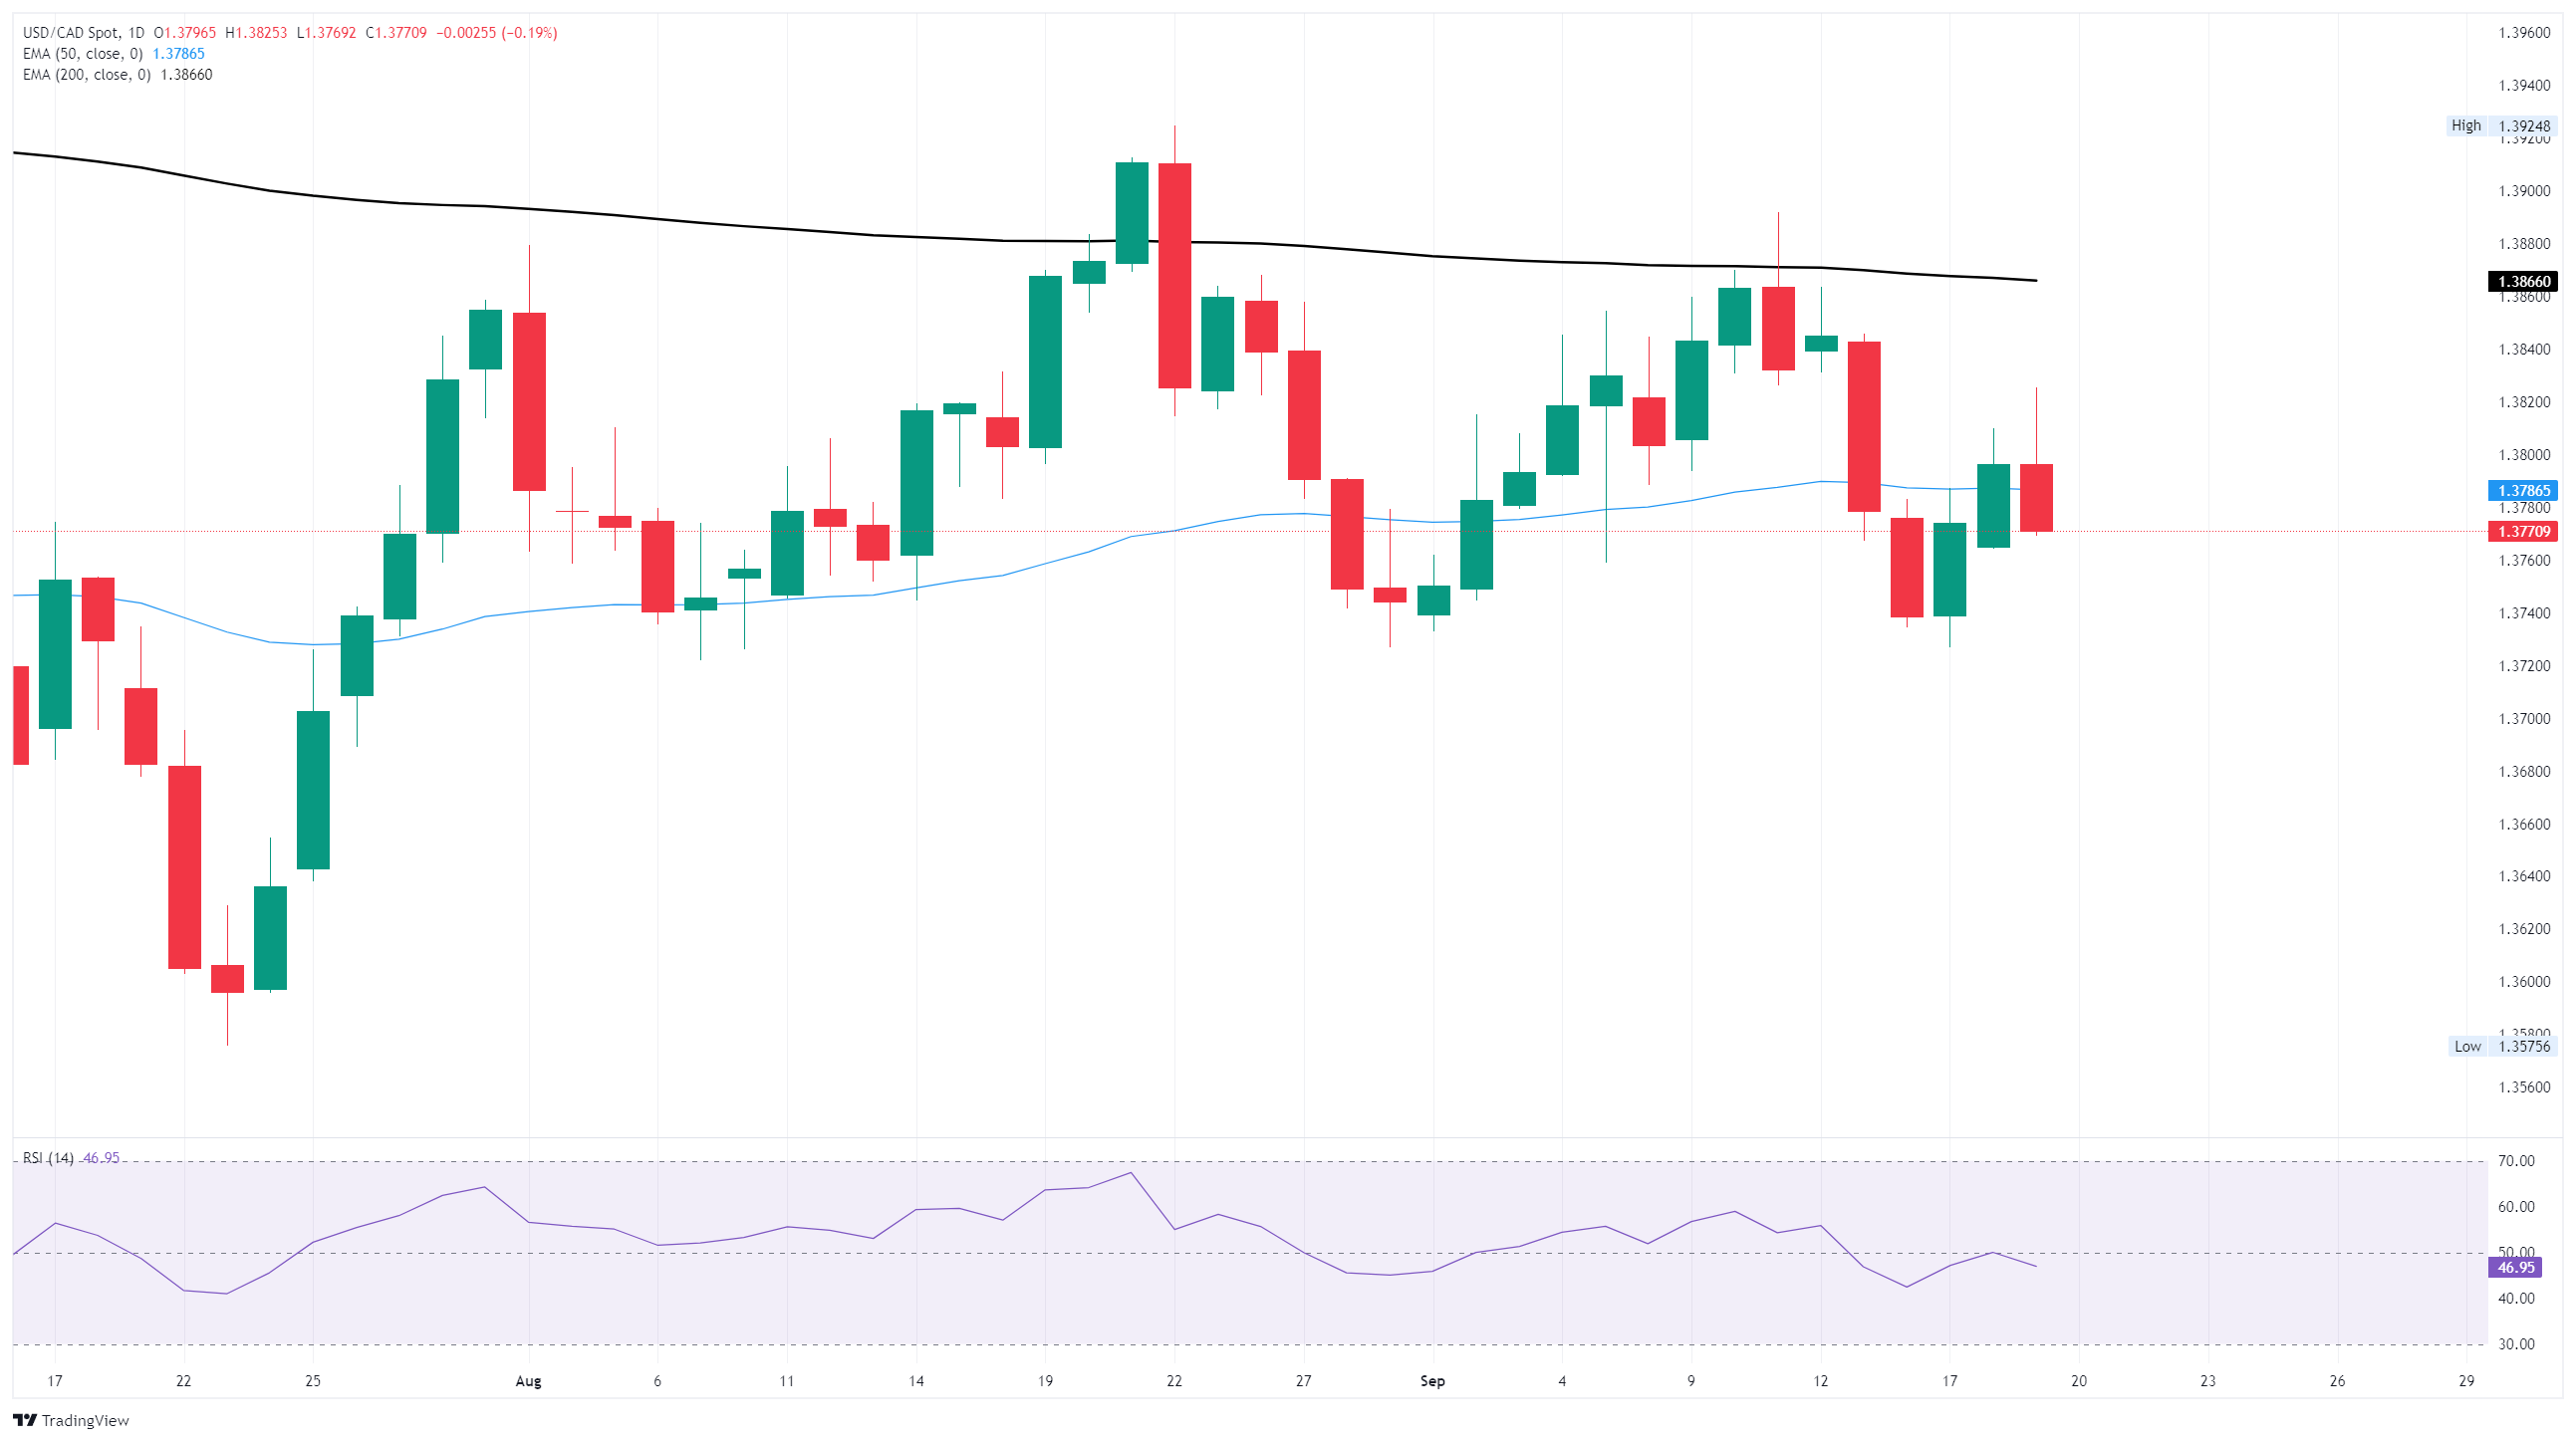
Despite the Canadian Dollar’s near-term strength to cap off the week, USD/CAD remains hamstrung near key technical levels. Intraday bids are back below the 50-day EMA near 1.3785, but remain within recent traveling territory.
USD/CAD is leaning into the low side of what is shaping up to be a weak triple-bottom, with a demand zone near 1.3740.
Dow Jones daily chart
Canadian Dollar FAQs
The key factors driving the Canadian Dollar (CAD) are the level of interest rates set by the Bank of Canada (BoC), the price of Oil, Canada’s largest export, the health of its economy, inflation and the Trade Balance, which is the difference between the value of Canada’s exports versus its imports. Other factors include market sentiment – whether investors are taking on more risky assets (risk-on) or seeking safe-havens (risk-off) – with risk-on being CAD-positive. As its largest trading partner, the health of the US economy is also a key factor influencing the Canadian Dollar.
The Bank of Canada (BoC) has a significant influence on the Canadian Dollar by setting the level of interest rates that banks can lend to one another. This influences the level of interest rates for everyone. The main goal of the BoC is to maintain inflation at 1-3% by adjusting interest rates up or down. Relatively higher interest rates tend to be positive for the CAD. The Bank of Canada can also use quantitative easing and tightening to influence credit conditions, with the former CAD-negative and the latter CAD-positive.
The price of Oil is a key factor impacting the value of the Canadian Dollar. Petroleum is Canada’s biggest export, so Oil price tends to have an immediate impact on the CAD value. Generally, if Oil price rises CAD also goes up, as aggregate demand for the currency increases. The opposite is the case if the price of Oil falls. Higher Oil prices also tend to result in a greater likelihood of a positive Trade Balance, which is also supportive of the CAD.
While inflation had always traditionally been thought of as a negative factor for a currency since it lowers the value of money, the opposite has actually been the case in modern times with the relaxation of cross-border capital controls. Higher inflation tends to lead central banks to put up interest rates which attracts more capital inflows from global investors seeking a lucrative place to keep their money. This increases demand for the local currency, which in Canada’s case is the Canadian Dollar.
Macroeconomic data releases gauge the health of the economy and can have an impact on the Canadian Dollar. Indicators such as GDP, Manufacturing and Services PMIs, employment, and consumer sentiment surveys can all influence the direction of the CAD. A strong economy is good for the Canadian Dollar. Not only does it attract more foreign investment but it may encourage the Bank of Canada to put up interest rates, leading to a stronger currency. If economic data is weak, however, the CAD is likely to fall.
추천 기사


