
Pepe Price Forecast: PEPE flaunts double Golden Cross pattern as altcoin season beckons
- Pepe maintains bullish momentum, nearing the $0.00001400 resistance level on Thursday.
- Two Golden Cross patterns in the daily time frame reinforce the bullish momentum.
- The Altcoin Season Index rises amid expanding altcoin market capitalization, reflecting increasing interest in meme tokens like PEPE.
Pepe (PEPE) shows signs of consolidating at around $0.00001364 on Thursday, following a falling wedge pattern breakout, which reached the intended target slightly above $0.00001400 the previous day.
The meme coin has seen a 22% increase over the past week and a 5% gain in 24 hours, reflecting the steady rise in demand for altcoins as traders seek to diversify their portfolios amid Bitcoin's (BTC) surge to new all-time highs of $123,218 on Monday.
Pepe could extend the uptrend amid strong derivatives market
Interest in Pepe has not faltered since the beginning of this month, when the futures Open Interest (OI) dropped to $455 million on July 2. CoinGlass data shows that the Open Interest, which represents the value of all the futures and options contracts that have not been settled or closed, is steadily rising to $685 million at the time of writing.
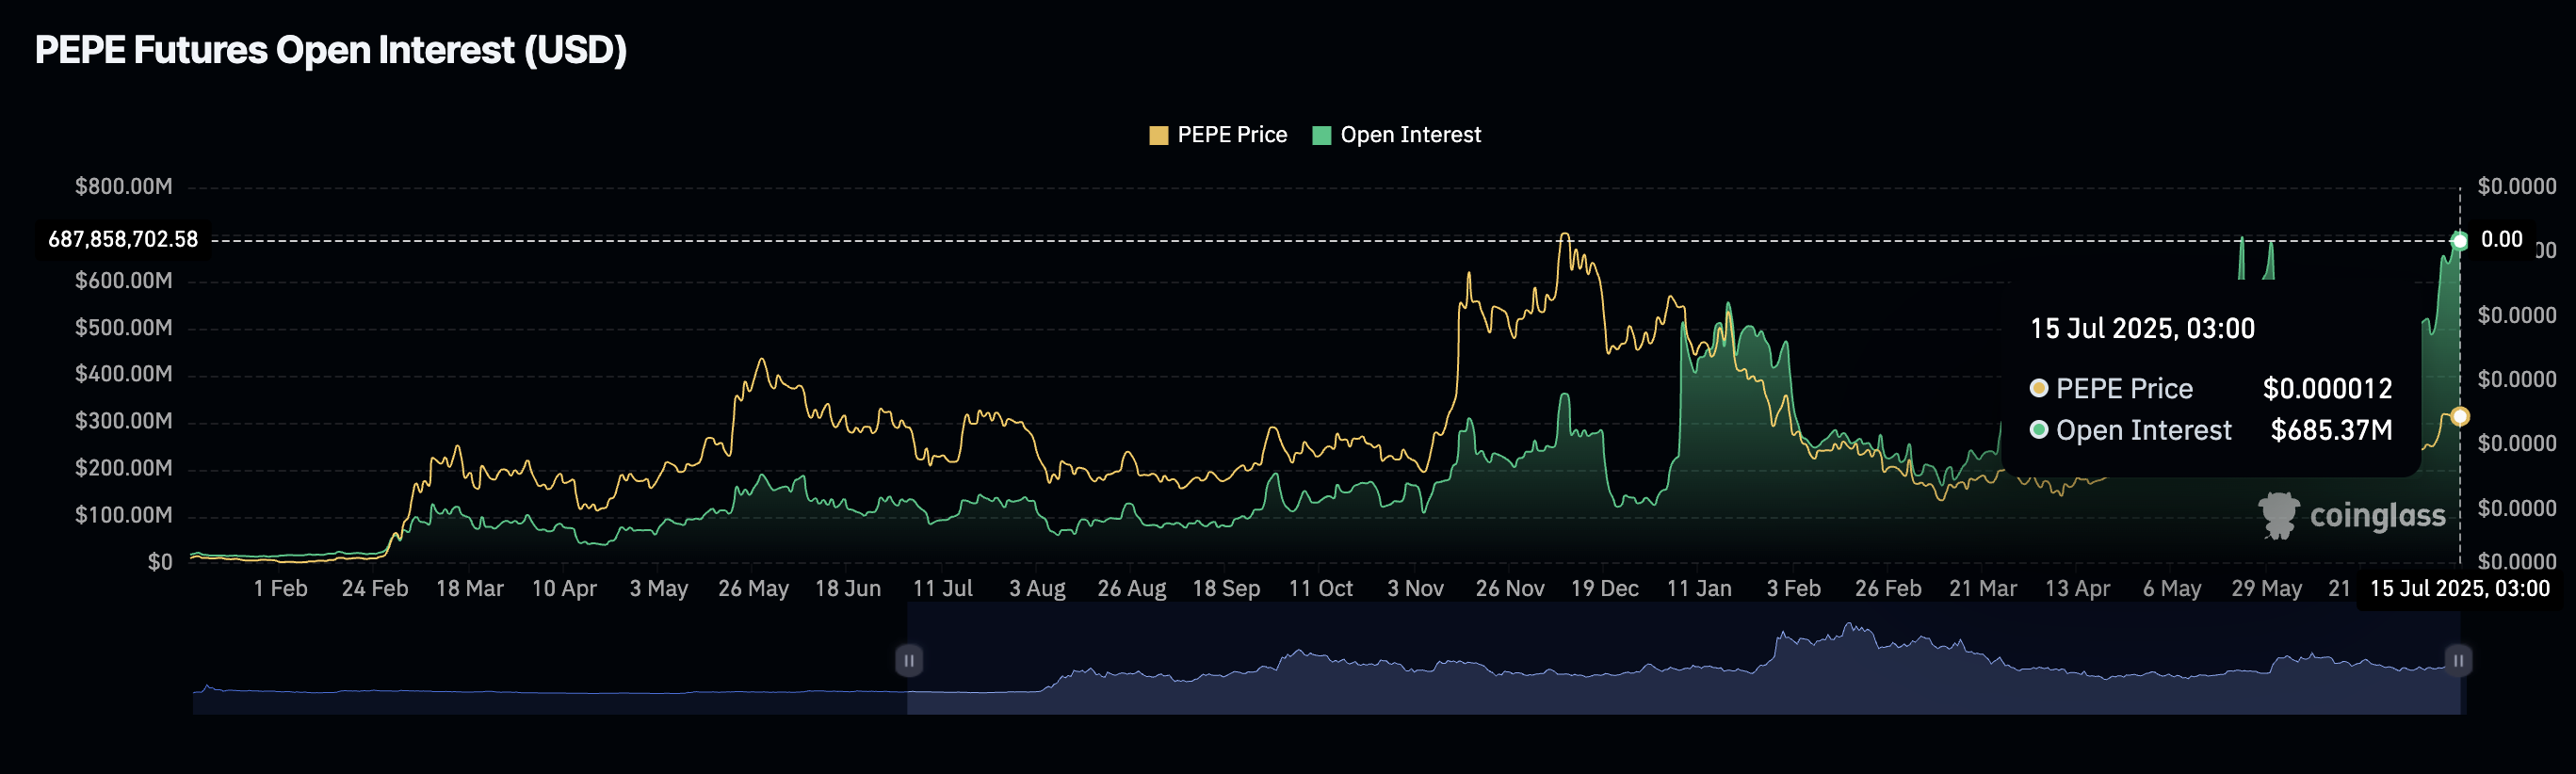
Pepe Futures Open Interest data | Source: Coinglass
A subsequent surge in the derivatives market's trading volume by 34% to nearly $5 billion indicates heightened market activity and trader confidence in PEPE and its ecosystem. This indicates that traders are willing to bet on the Pepe price extending its recovery above the short-term hurdle at $0.00001400 in the near term.
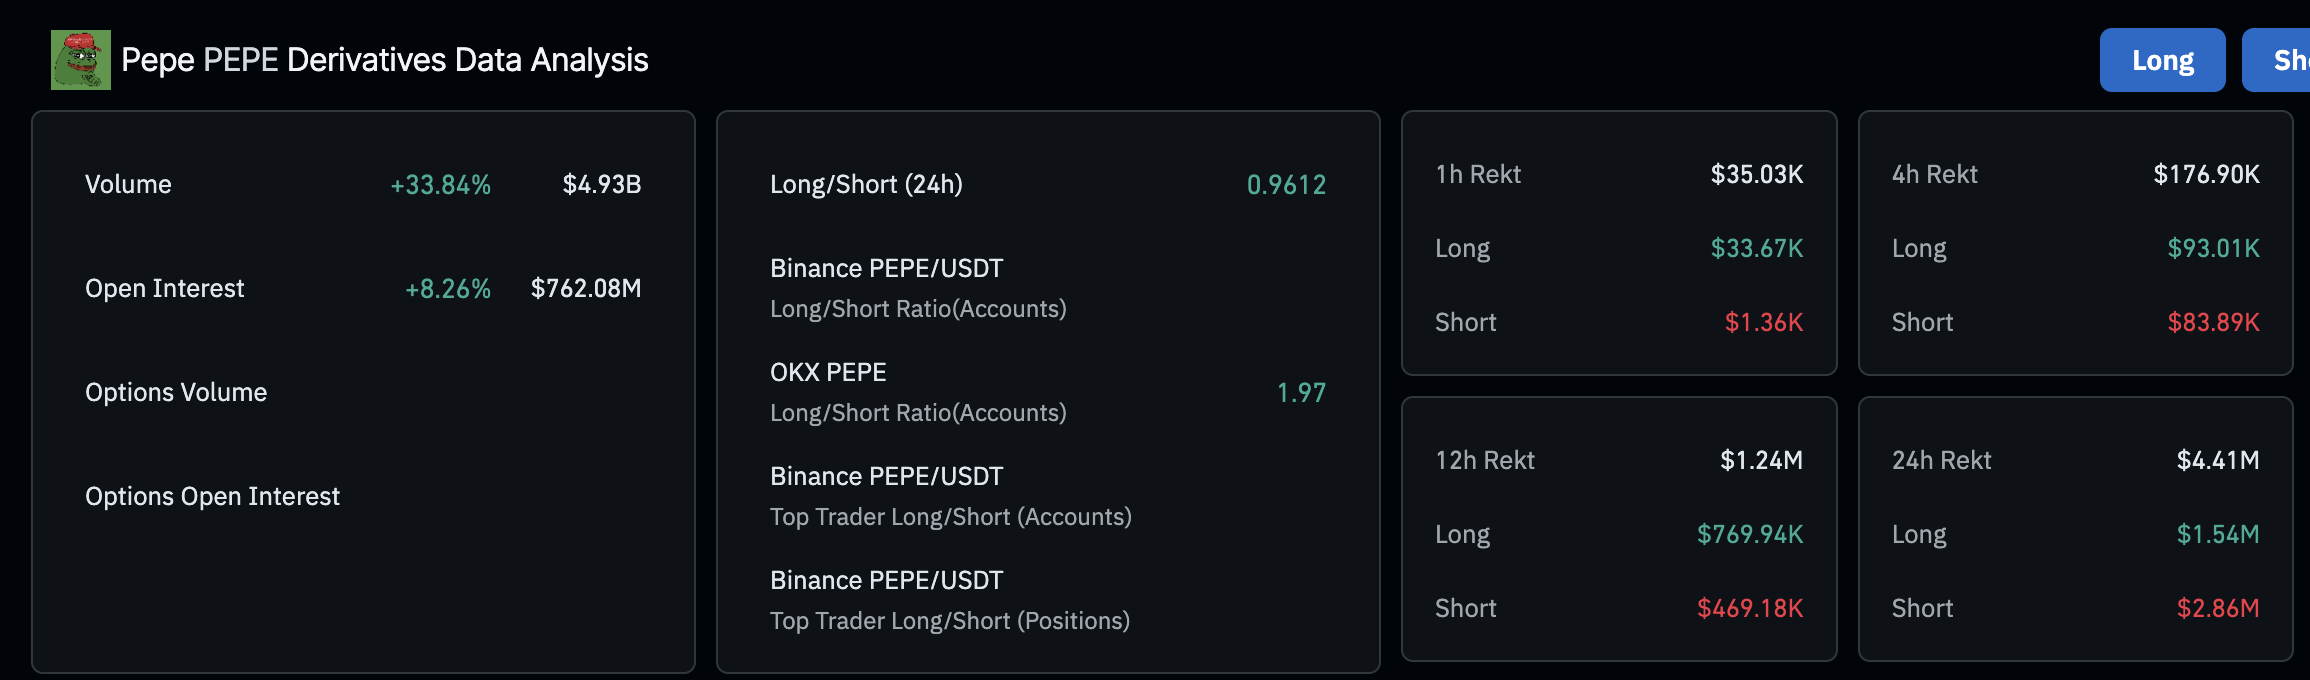
Pepe derivatives markets data | Source: CoinGlass
The increase in Pepe price reflects the bullish wave that swept across the cryptocurrency market this week, triggered by Bitcoin's surge to record highs and steady demand for altcoins.
The Altcoin Season Index has steadily been growing over the past few weeks, rising from 12 on June 22 to 41 at the time of writing. Although this index is still far from signaling the start of the altcoin season, which typically occurs around 75, this recent growth suggests that retail investors are making a comeback with renewed interest in alternative investments to Bitcoin.
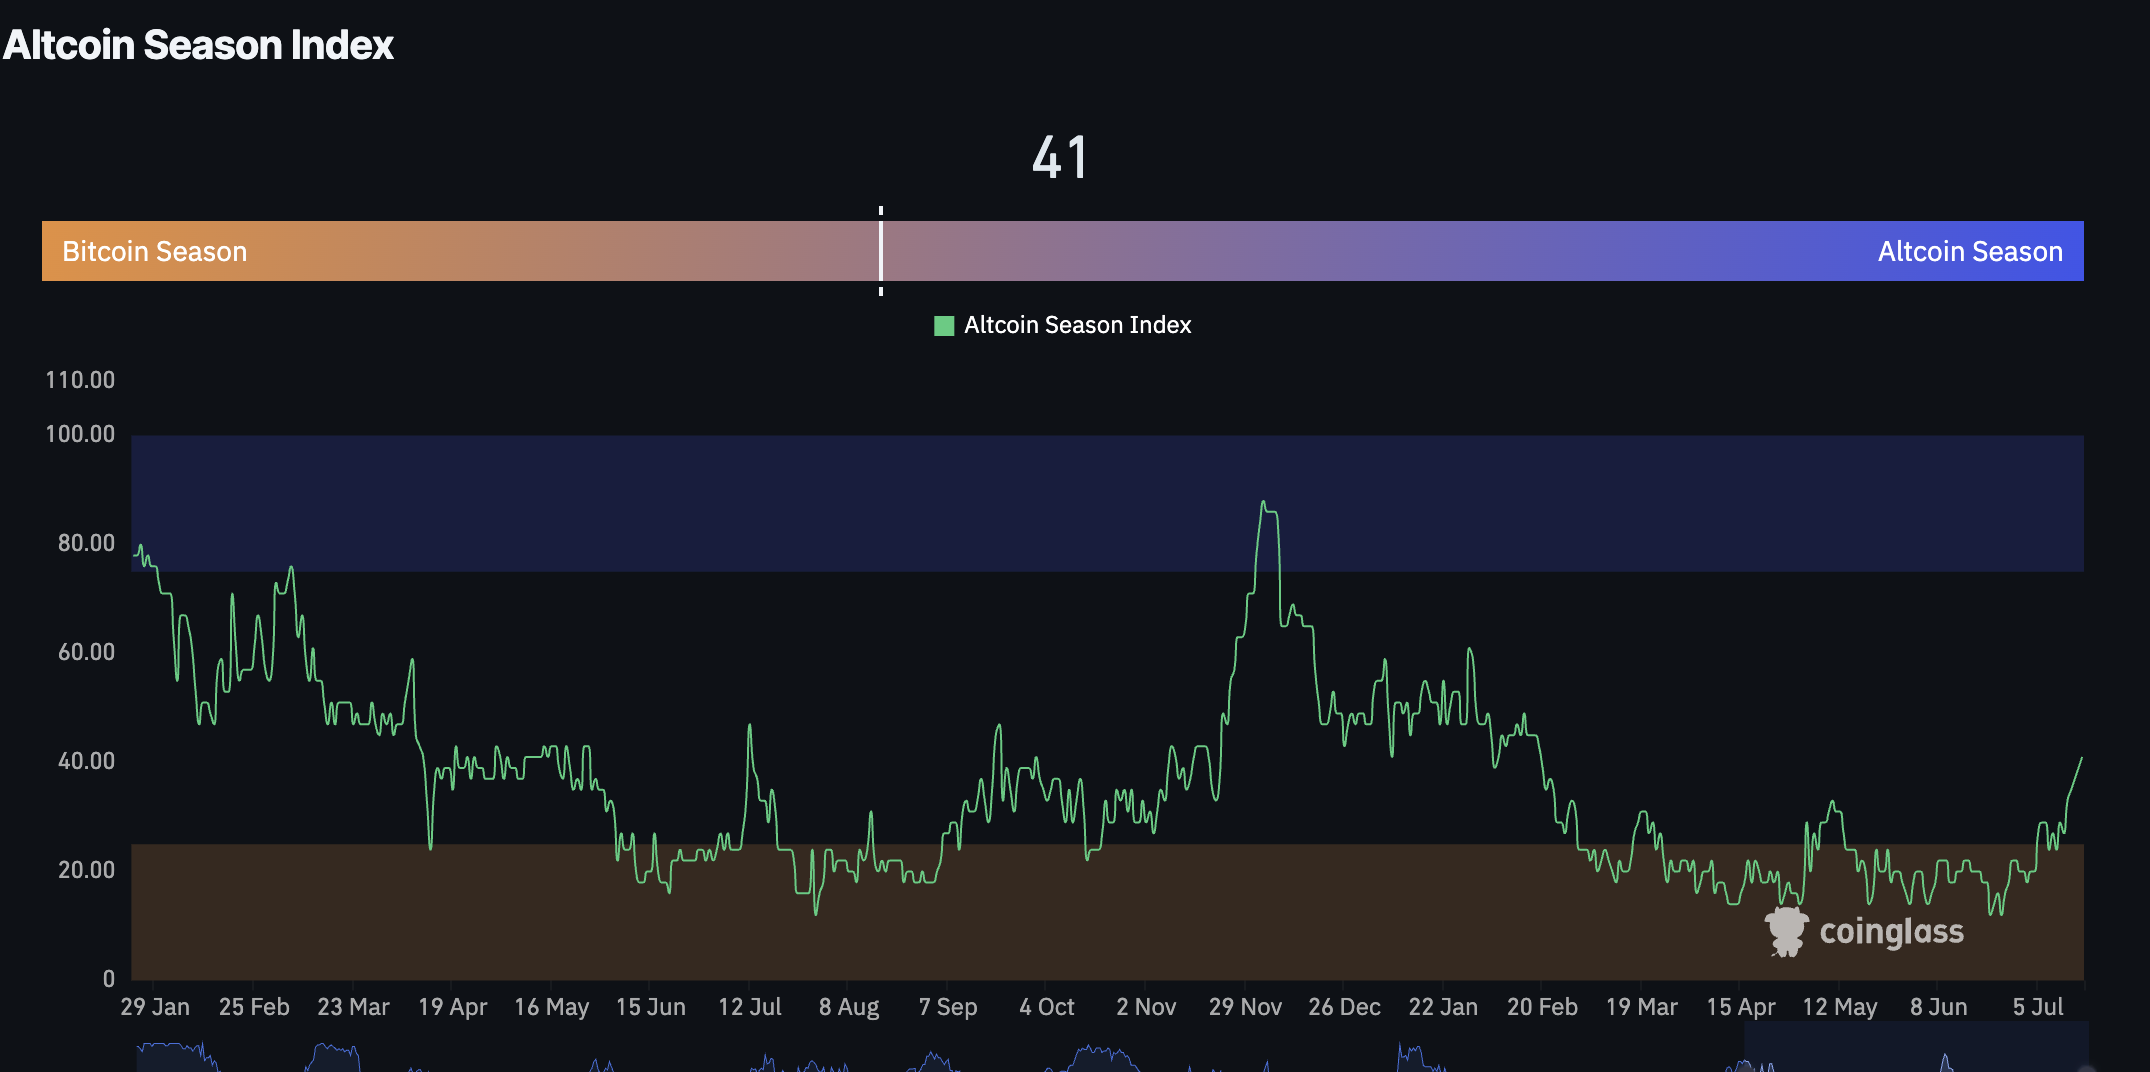
Altcoin Season Index | Source: CoinGlass
Technical outlook: Pepe holds bullish structure
Pepe price sits above all key moving averages, including the 50-day Exponential Moving Average (EMA) at $0.00001112, the 200-day EMA at $0.00001101 and the 100-day EMA at $0.00001089.
Two Golden Cross patterns further reinforce the bullish outlook, starting with the 50-day EMA cross above the 100-day EMA on Sunday and the same 50-day EMA flip above the 200-day EMA on Wednesday.
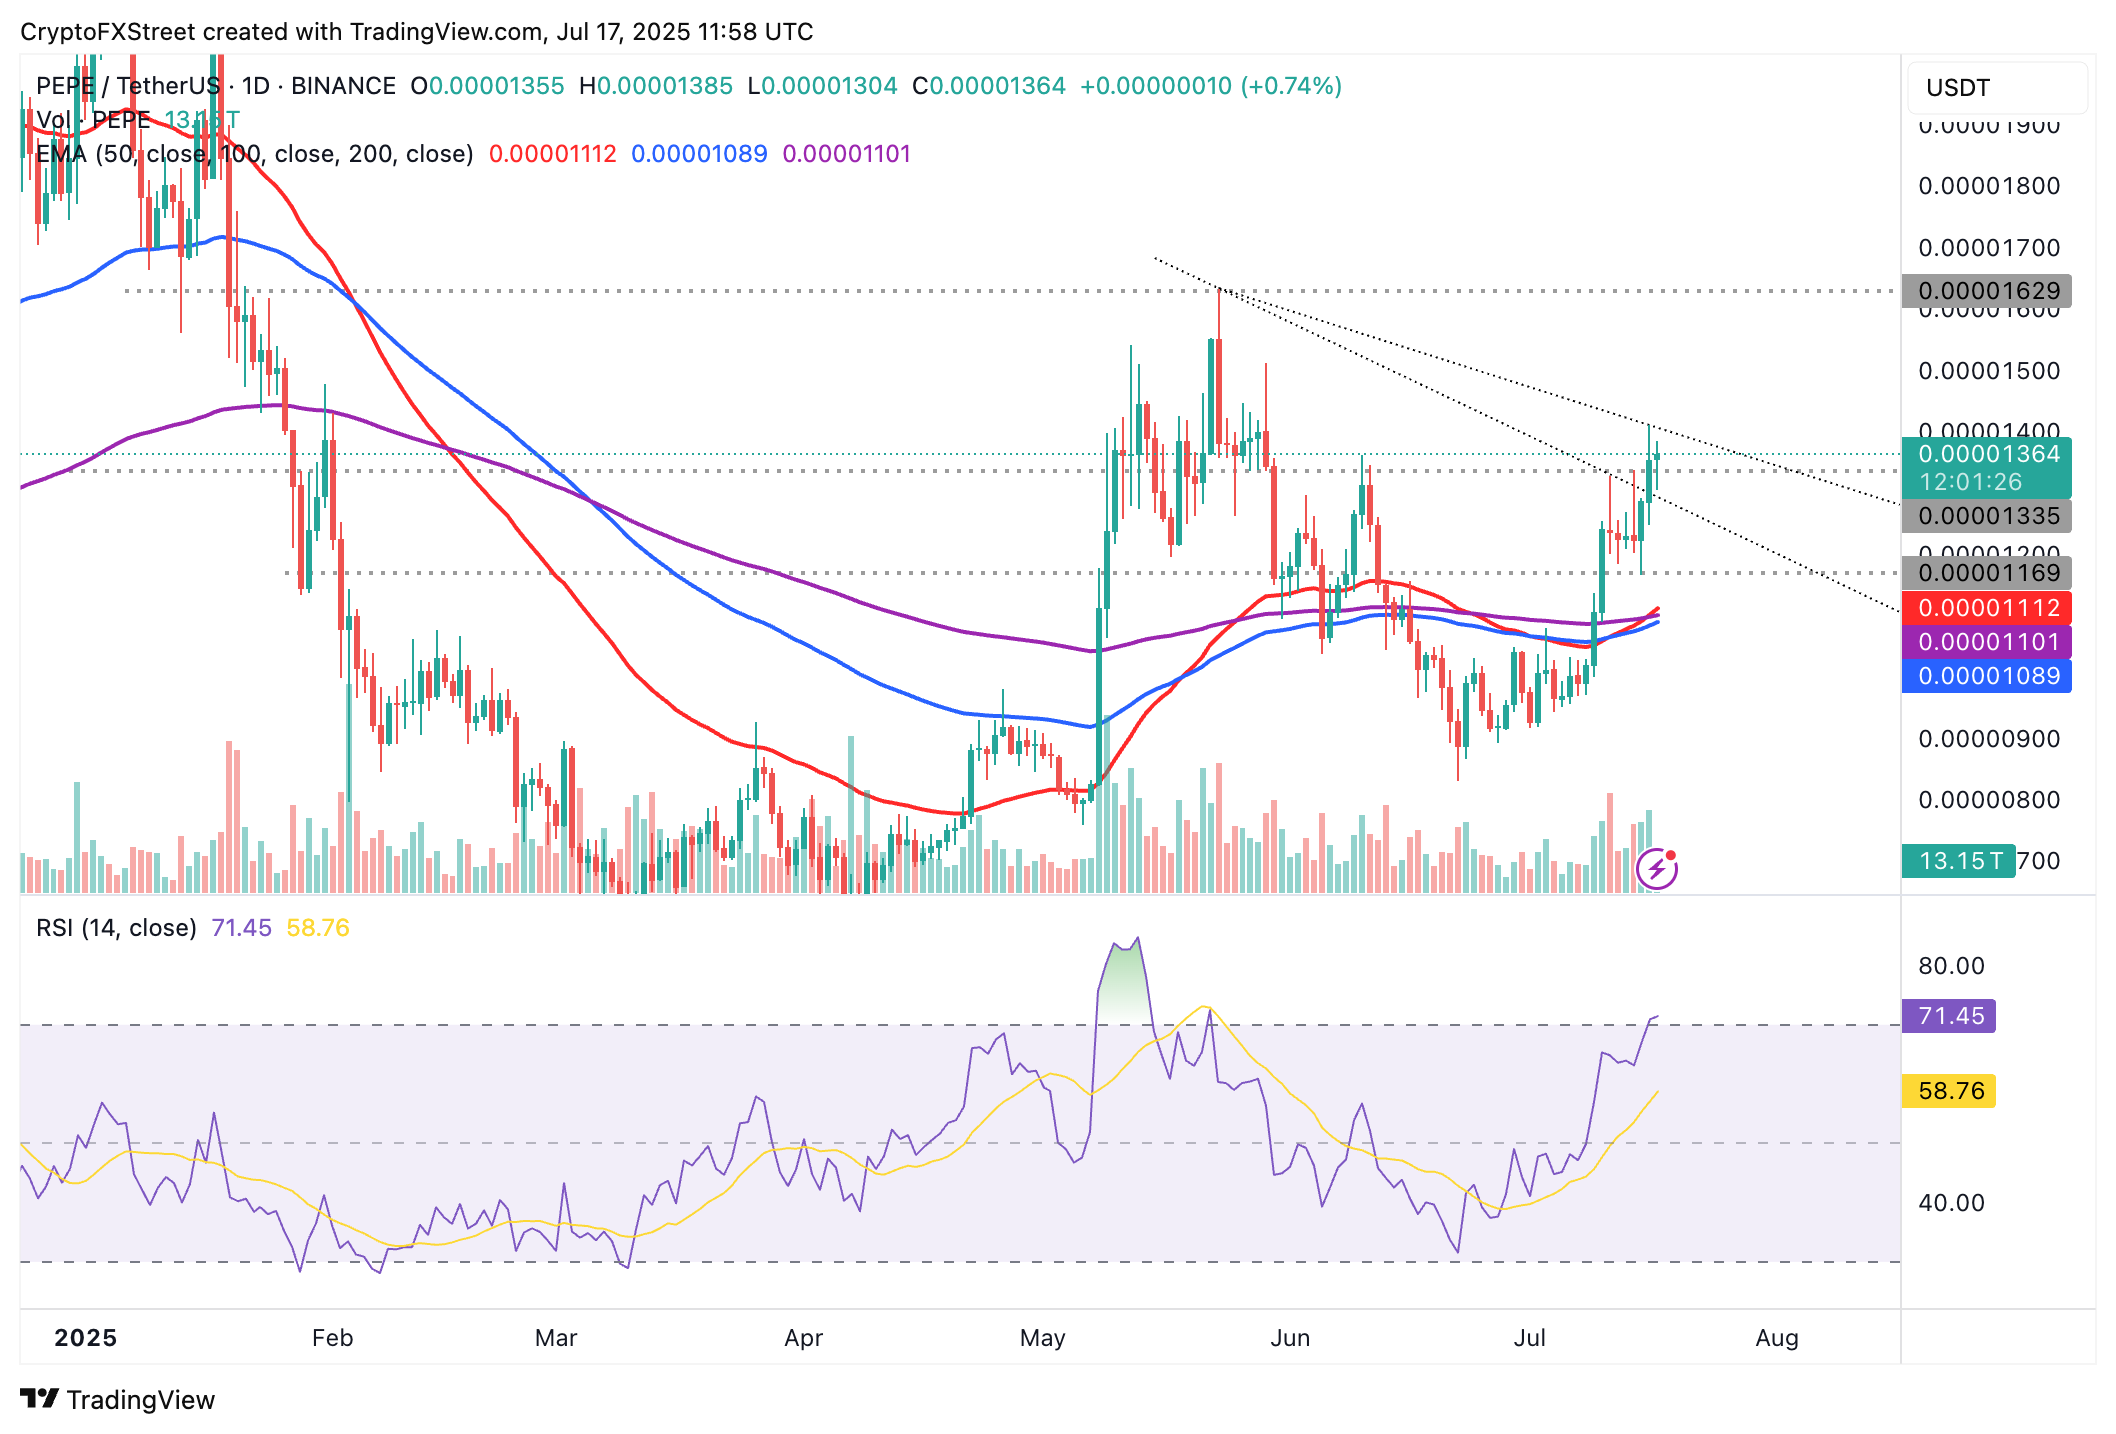
PEPE/USDT daily chart
Traders will consider increasing exposure due to the Golden Cross patterns, as well as the upward-looking Relative Strength Index (RSI) at 71. If the RSI holds steady, it will signal bullish momentum.
Still, traders should temper their bullish expectations if the RSI retreats into neutral territory, suggesting a decline in demand for the token. Profit-taking and changing market dynamics, driven by macroeconomic risks surrounding the implementation of higher tariffs in the United States (US), could contribute to sell-side pressure.
Open Interest, funding rate FAQs
Higher Open Interest is associated with higher liquidity and new capital inflow to the market. This is considered the equivalent of increase in efficiency and the ongoing trend continues. When Open Interest decreases, it is considered a sign of liquidation in the market, investors are leaving and the overall demand for an asset is on a decline, fueling a bearish sentiment among investors.
Funding fees bridge the difference between spot prices and prices of futures contracts of an asset by increasing liquidation risks faced by traders. A consistently high and positive funding rate implies there is a bullish sentiment among market participants and there is an expectation of a price hike. A consistently negative funding rate for an asset implies a bearish sentiment, indicating that traders expect the cryptocurrency’s price to fall and a bearish trend reversal is likely to occur.
추천 기사


