
Crypto Today: Bitcoin, Ethereum, XRP flash recovery signals after rollercoaster weekend
- Bitcoin aims for $105,000 following the weekend sell-off, buoyed by short-term holder realized price support.
- Ethereum rebounds after testing $2,111 support as institutional interest steadies on weekly spot ETF net inflow.
- XRP pares losses as bulls move swiftly to curb downside risks below the $2.00 support.
The cryptocurrency market is gearing up for recovery following a geopolitical tension-triggered sell-off over the weekend after the United States (US) struck Iran's nuclear sites in support of Israel's campaign. Bitcoin (BTC) slipped below $100,000, reaching a low of around $98,200, before reversing the trend and rising above $101,000 on Monday.
Major altcoins, including Ethereum (ETH) and Ripple (XRP), are paring losses while offering signs of recovery, underpinned by renewed sentiment in the broader cryptocurrency market.
Market overview: US strikes on Iran keep investors on the edge
US President Donald Trump ordered strikes on three main Iranian nuclear sites on Saturday, unleashing mayhem in global markets, which saw Bitcoin price drop below the $100,000 mark, its lowest point since May 8.
The strikes dimmed hopes for a potential ceasefire, as reported by Reuters. "It's irrelevant to ask Iran to return to diplomacy," Iran's foreign minister Abbas Araqchi told reporters in Istanbul on Sunday.
Following the attacks, President Trump urged Iran to return to the negotiating table but warned against retaliatory attacks on US assets and personnel in the Middle East region.
Volatility in the market is likely to remain elevated, with traders treading cautiously. Liquidations exploded above the $1 billion mark on Sunday, offering a glimpse of the damage that could happen if the conflict between Iran and Israel keeps escalating.
Data spotlight: Digital asset inflows hit 10-week streak
Inflows into digital asset financial products, including spot Exchange Traded Funds (ETFs), extended the bullish streak, reaching $1.24 billion last week. CoinShares reported that year-to-date inflows have hit a record $15.1 billion.
Bitcoin and Ethereum dominated the inflows with $1.1 billion and $124 million, signaling strong sentiment despite escalating geopolitical tensions. Ethereum posted its ninth consecutive week of inflows, bringing the total inflow for this period to slightly above $2.2 billion.
"This marks the longest run of inflows since mid-2021, reflecting continued robust investor sentiment toward the asset," the CoinShares weekly report states.
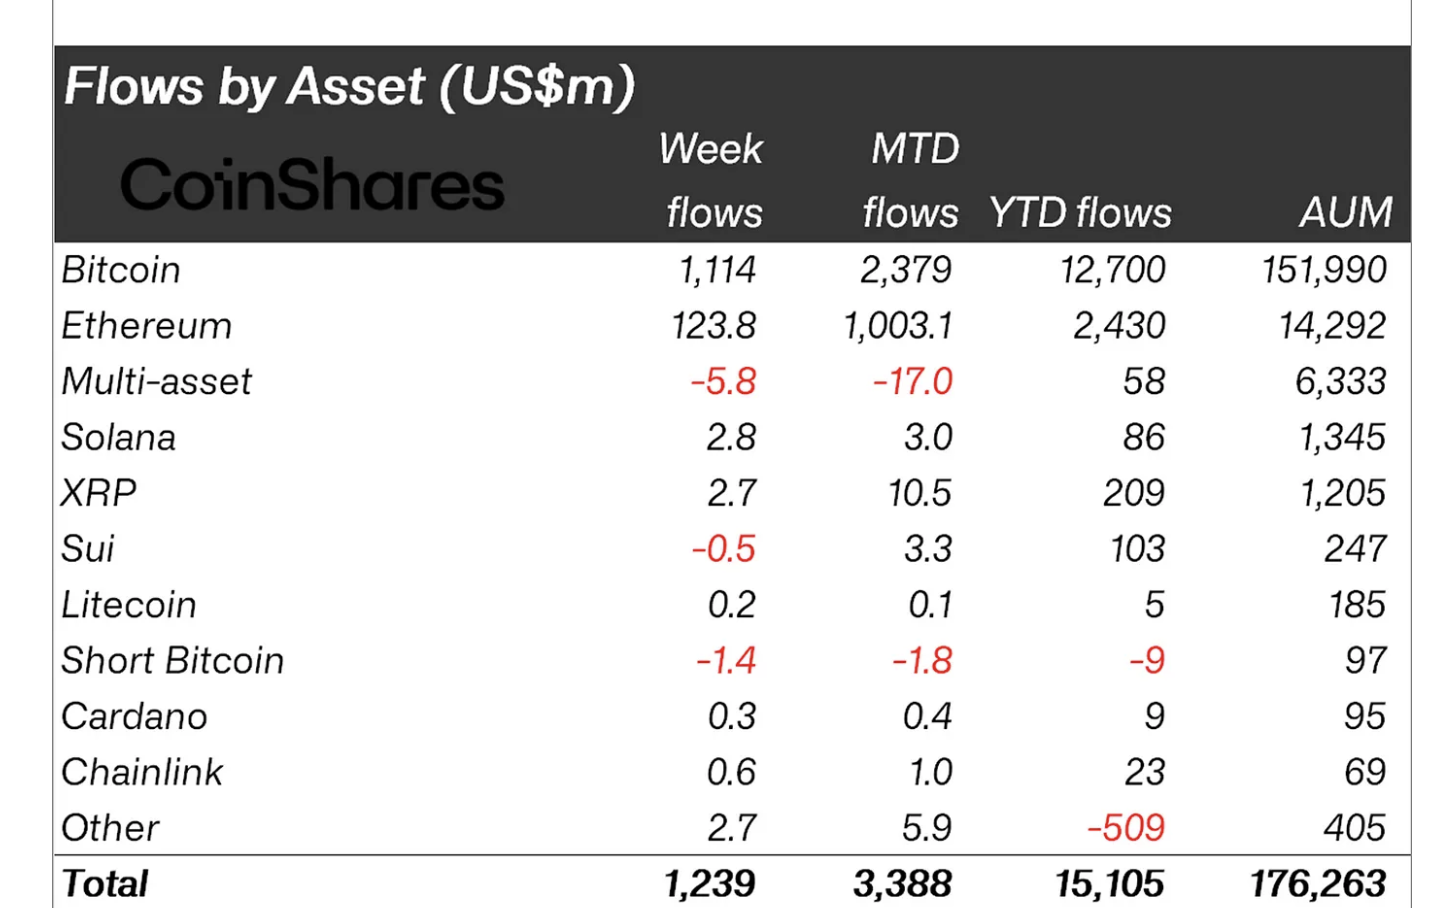
Digital asset inflows | Source: CoinShares
Chart of the day: Bitcoin's rebound offers bullish signals
Bitcoin's price hovers at around $101,457 at the time of writing as traders focus on the possibility of the uptrend extending further. According to QCP Capital's Monday market update, "BTC's reclaim of $100k this morning suggests that the weekend drawdown was macro-driven, with investors turning to crypto as a hedge while awaiting equity futures to open."
Technically, the Relative Strength Index (RSI) indicates that momentum is gradually shifting bullish as it reverses the trend, pointing toward the 50 midline. Recovery beyond this neutral level could boost the uptrend, paving the way for further gains this week.
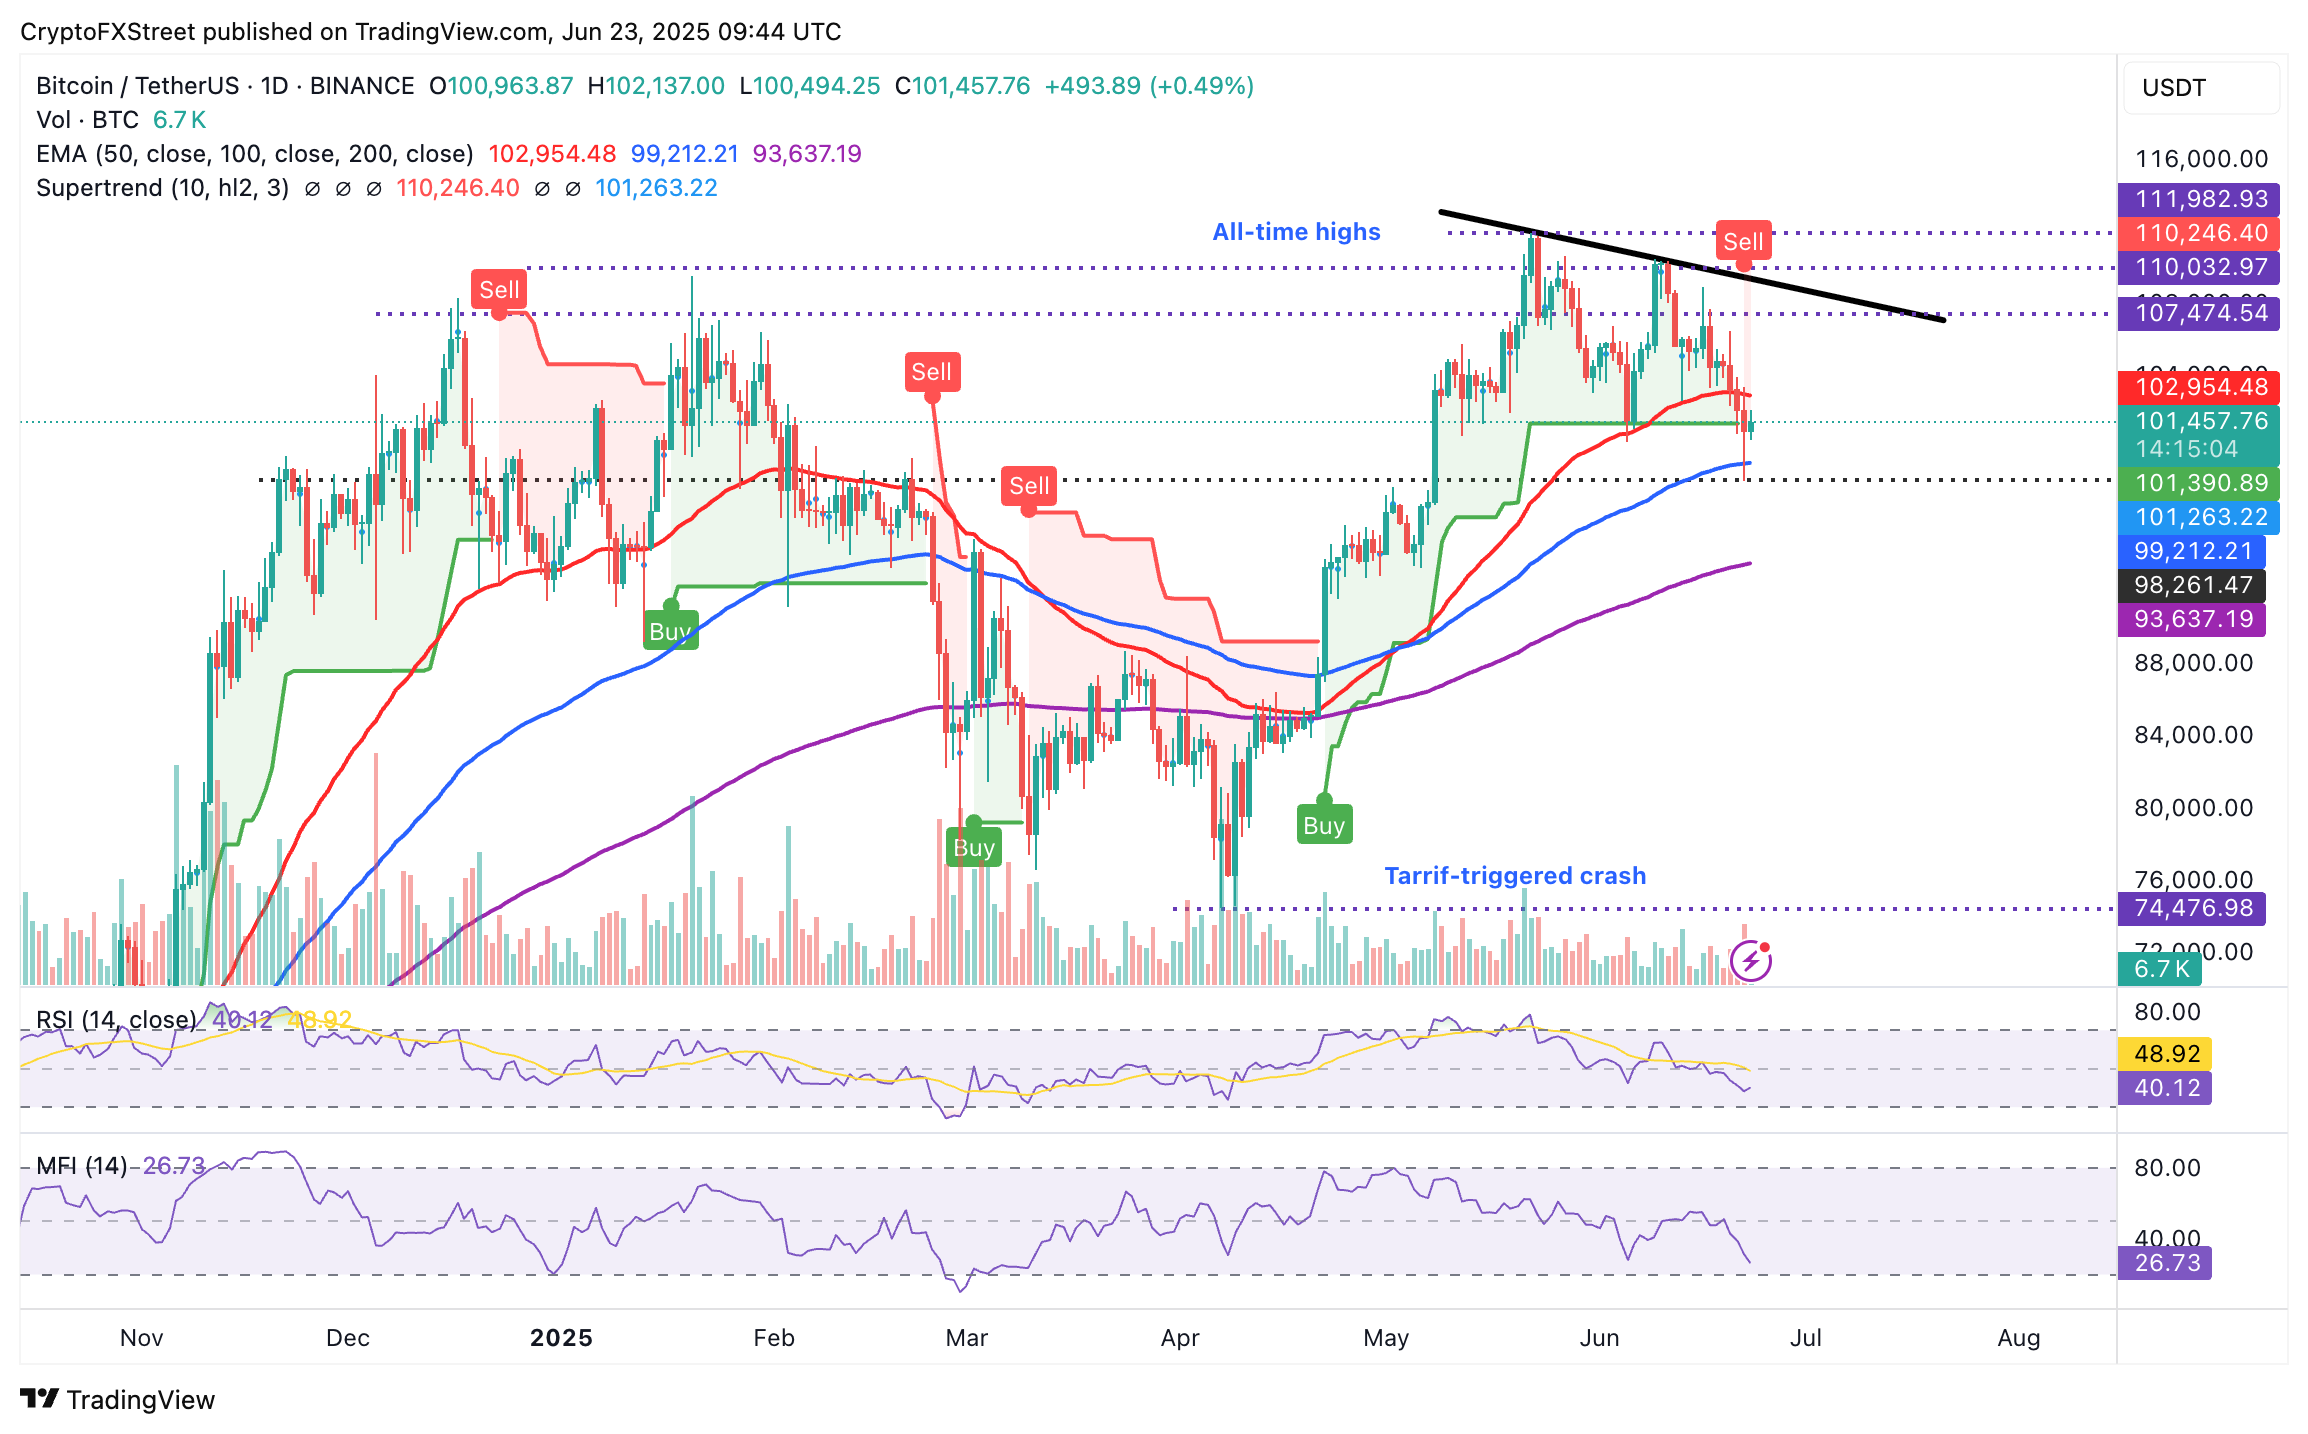
BTC/USDT daily chart
Key monitoring levels, especially for intraday traders, include the 100-day Exponential Moving Average (EMA), currently at $99,212, which is set to serve as support, and the 50-day EMA at $102,954, a former support level that has been flipped into resistance. A break above the 50-EMA hurdle would expand the bullish scope above $105,000, a psychological round-number resistance.
Altcoins update: Ethereum resumes uptrend as XRP wobbles
Ethereum's price shows subtle signs of a minor recovery on Monday, steadying during the European session, buoyed by support at $2,111 and buy-the-dip initiatives. Although the RSI is near the oversold region, a reversal is underway at 35. The 100-day EMA at $2,366, the 50-day EMA at $2,417 and the 200-day EMA at $2,469 mark key resistance levels. Closing above these levels will likely boost ETH's bullish structure.
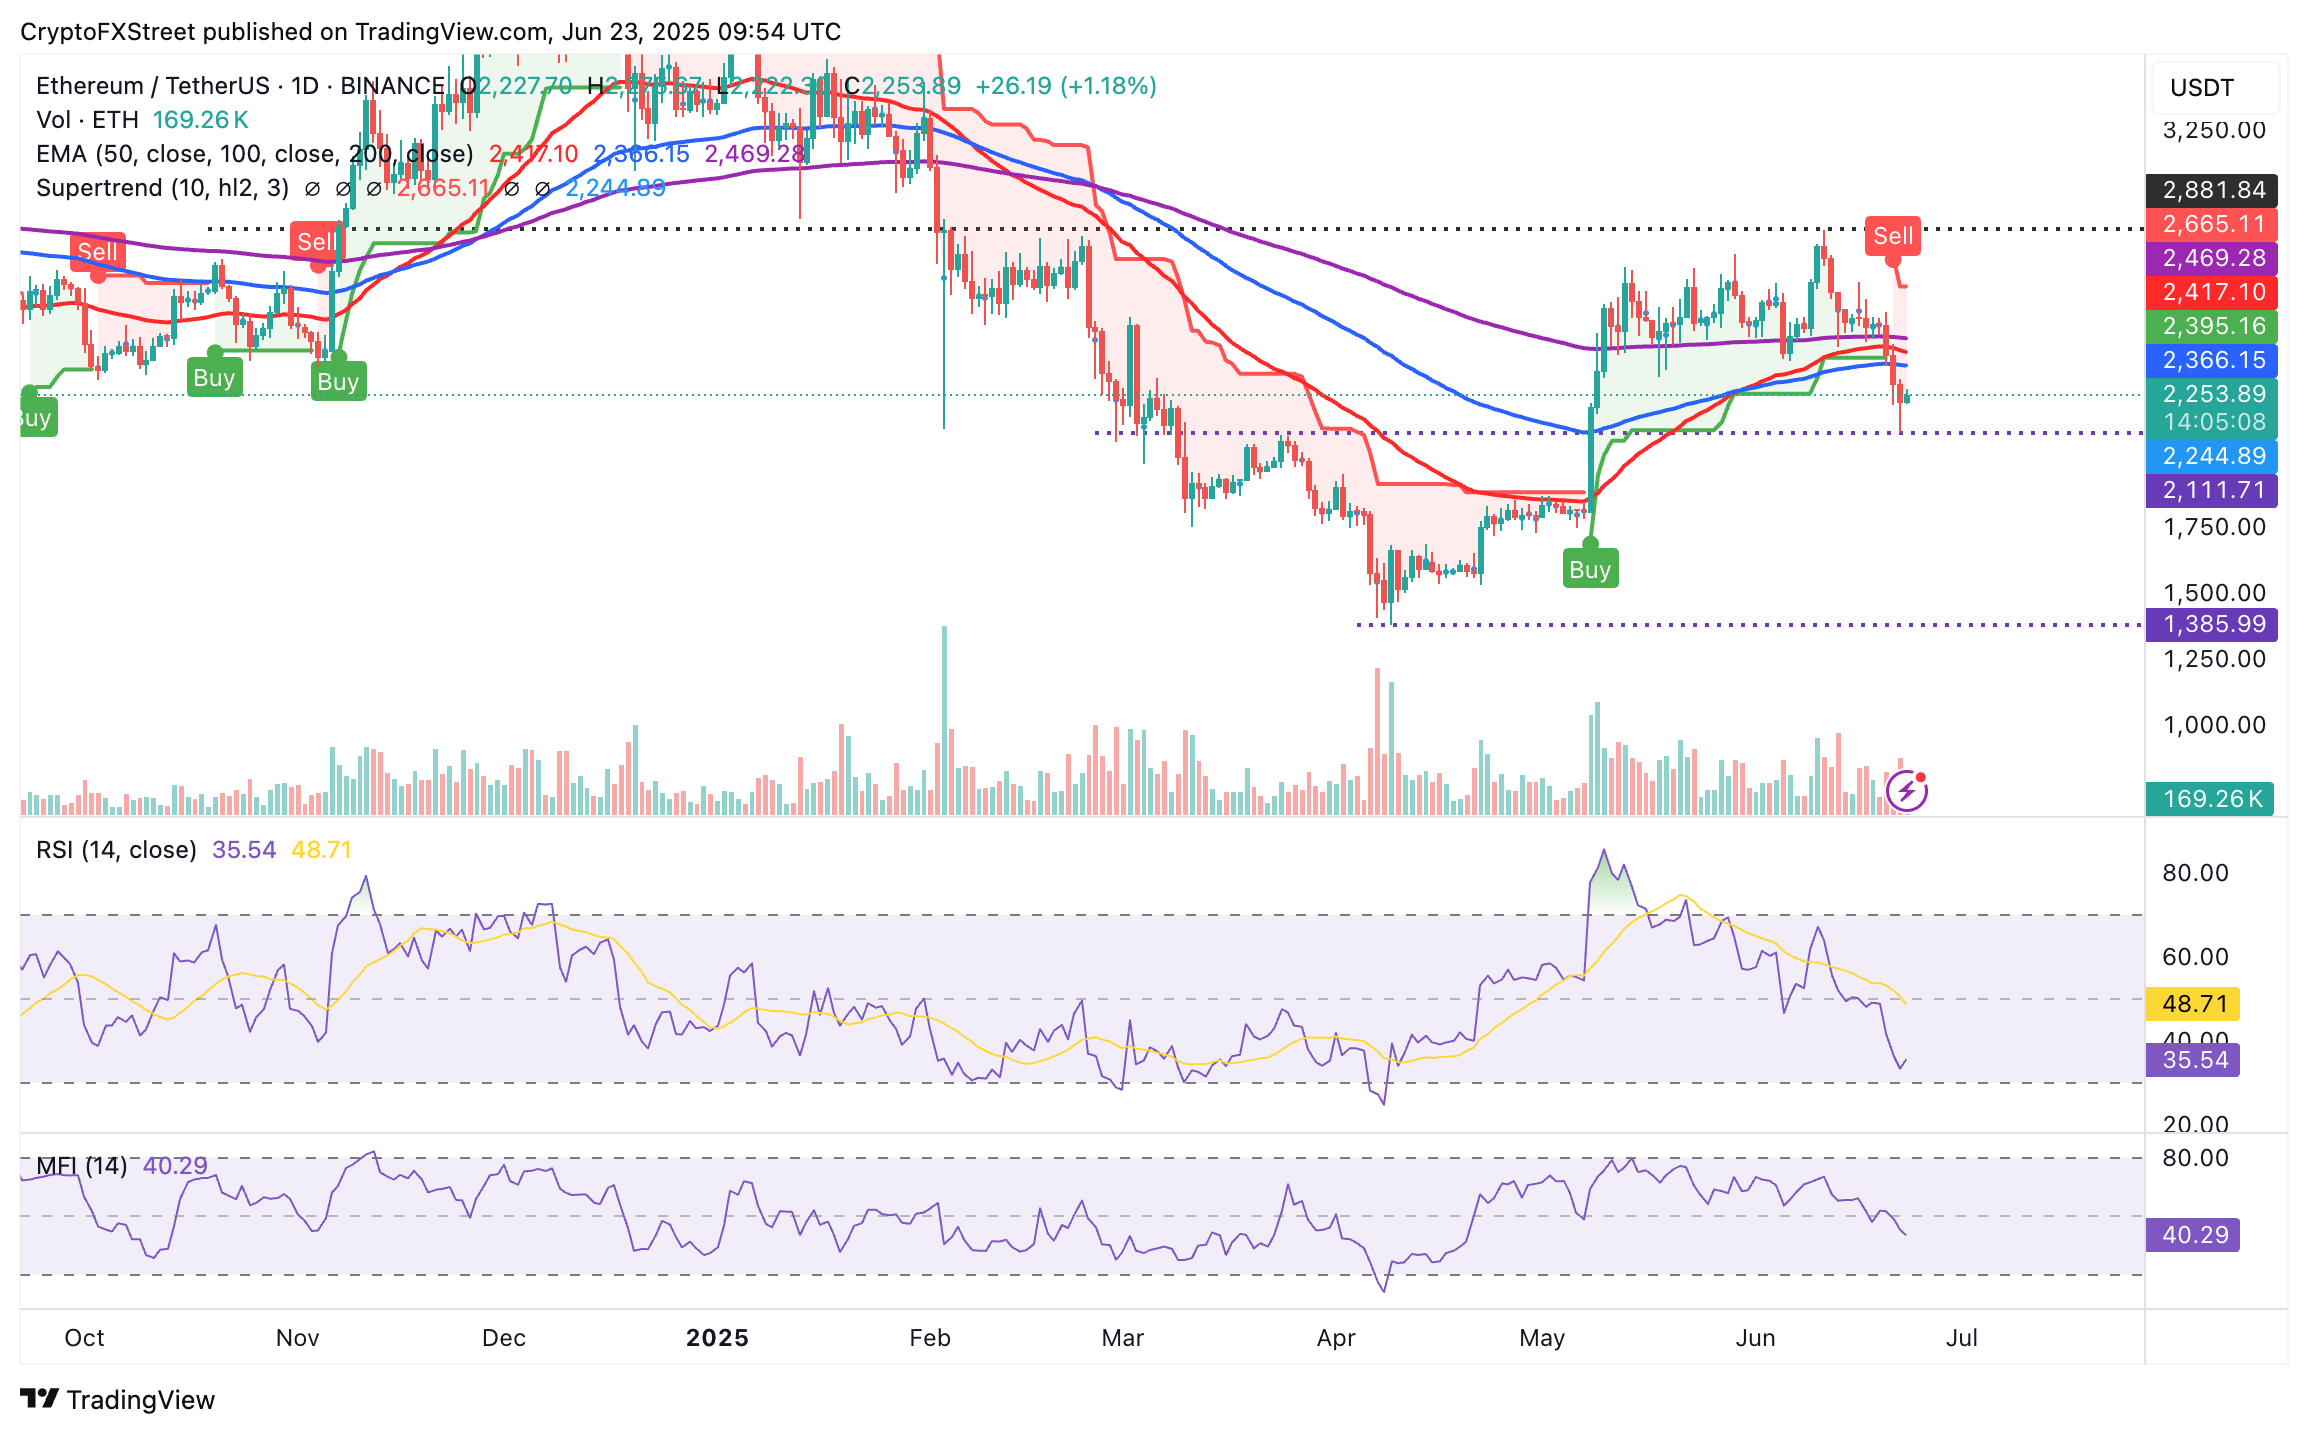
ETH/USDT daily chart
On the contrary, the Money Flow Index (MFI) indicator, which tracks the amount of money entering Ethereum, suggests a strong bearish grip as it slides toward the oversold area. In other words, traders may lack the conviction to keep the recovery steady in upcoming sessions.
Meanwhile, the leading cross-border money transfer token, XRP, shows signs of weakness despite reclaiming ground slightly above support at $2.00. If downside risks intensify, traders may want to prepare for the possibility of losses extending to lows last seen in April, such as $1.80 and $1.61.
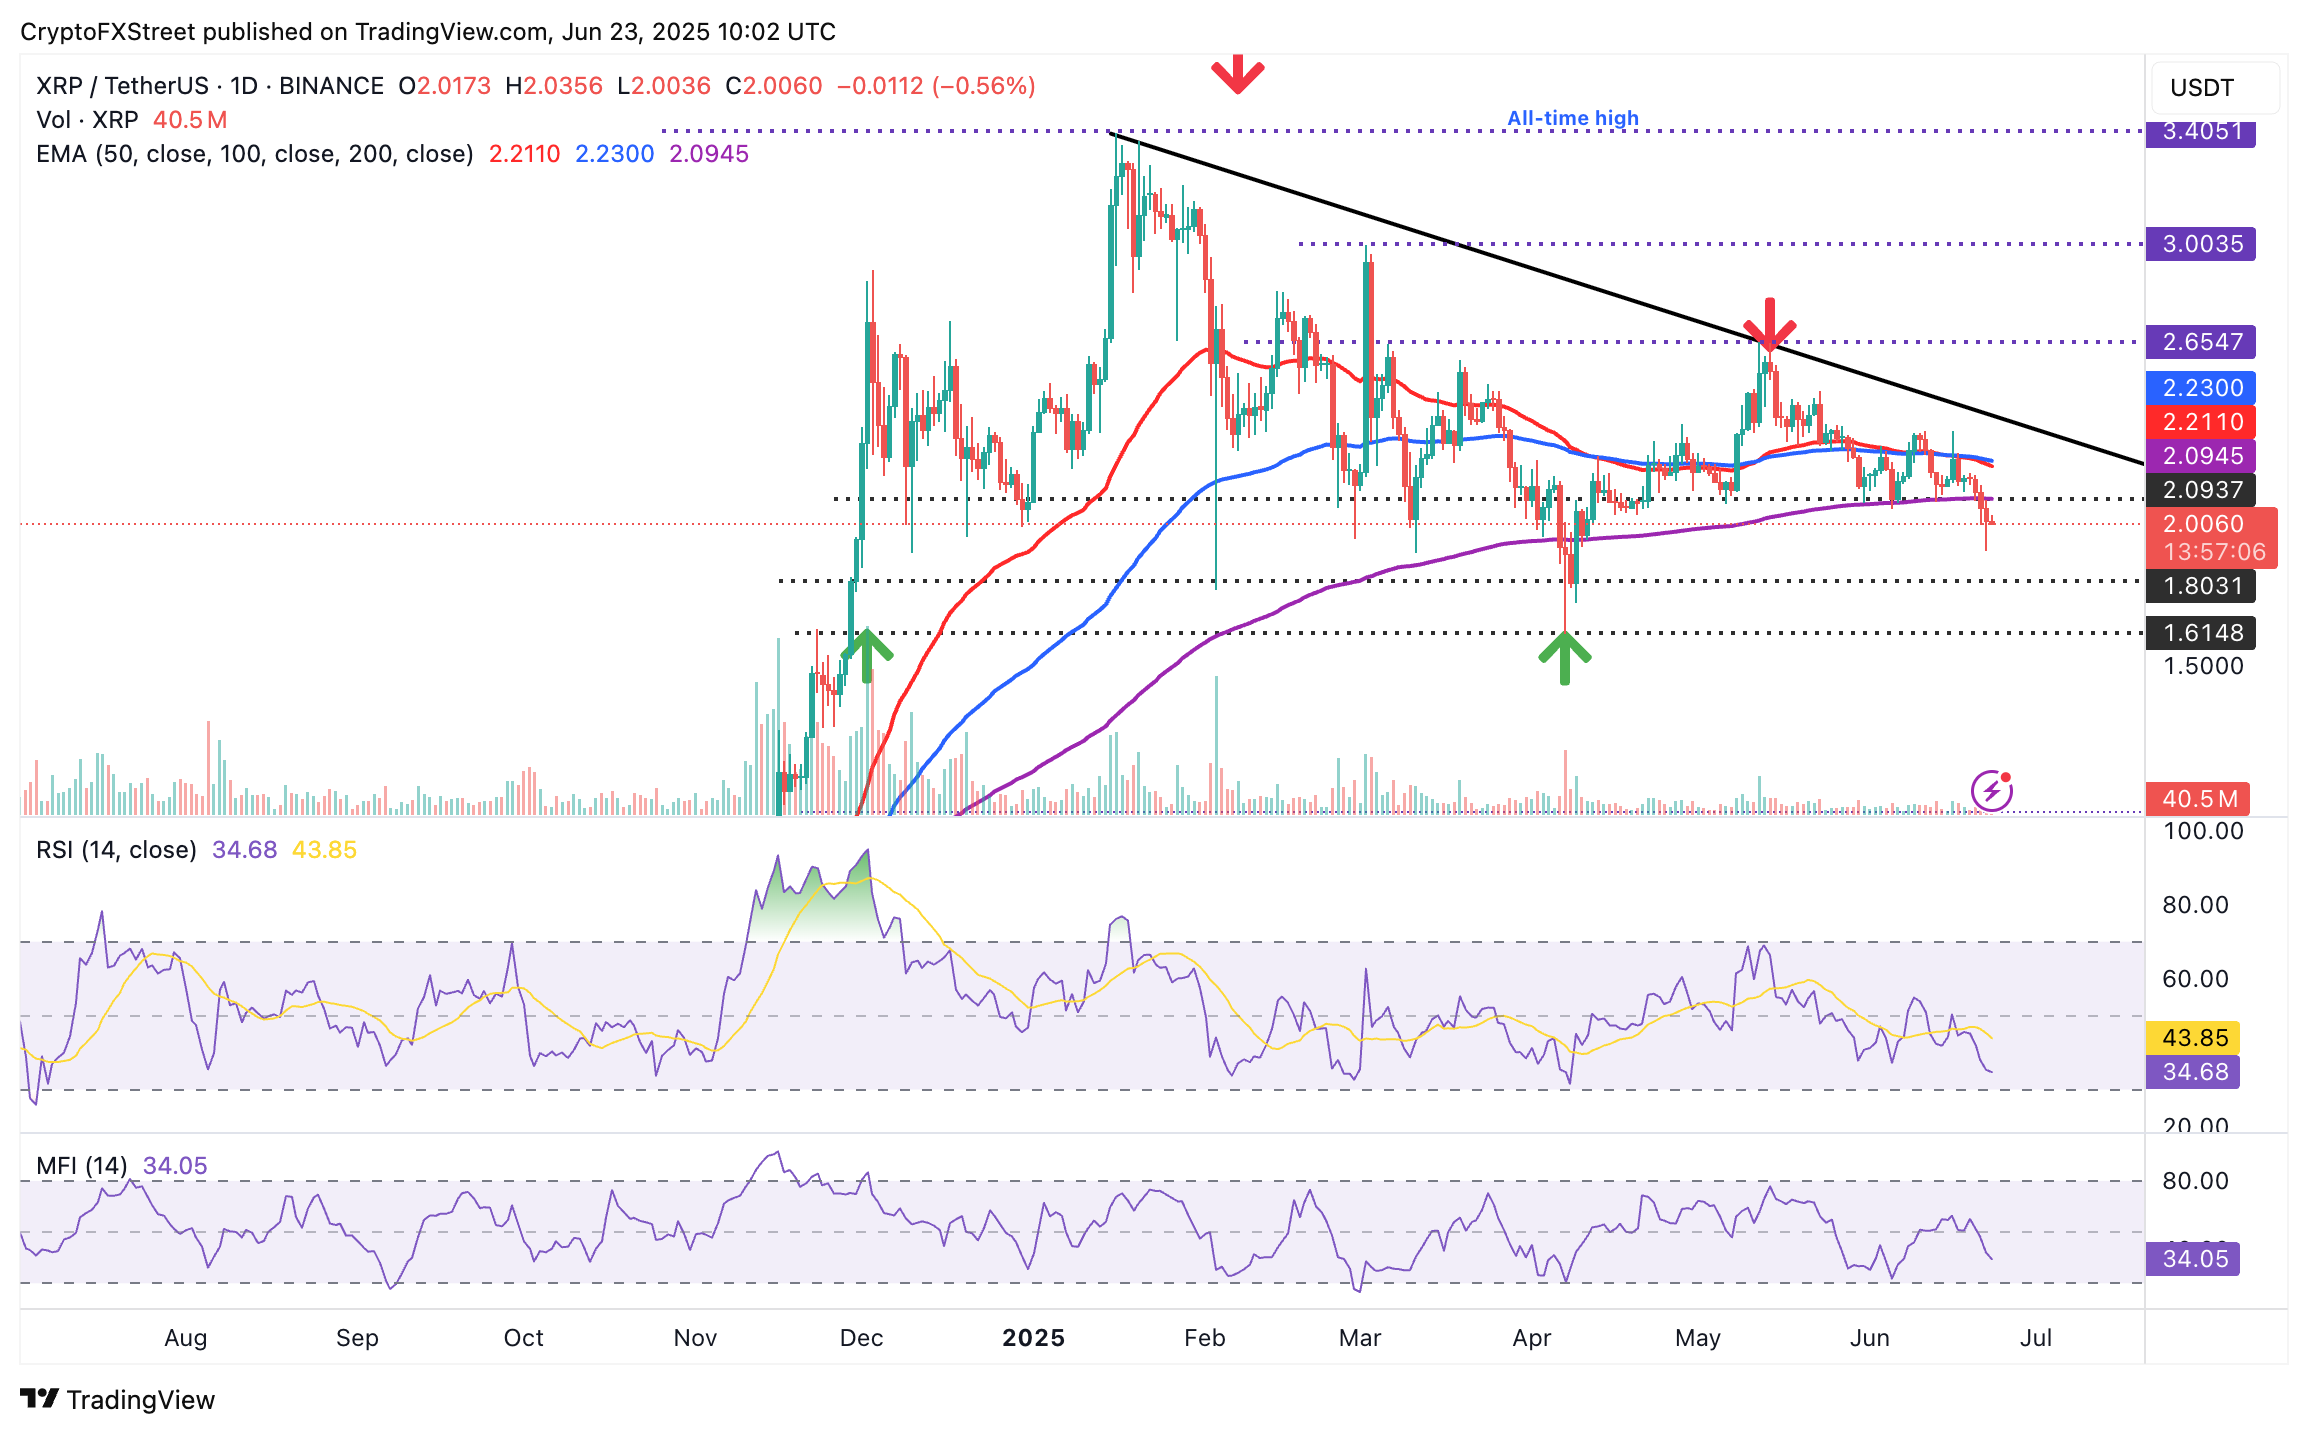
XRP/USDT daily chart
The path of least resistance appears firmly downward, accentuated by the RSI pointing downwards and approaching oversold territory. On the upside, the 200-day EMA at $2.09, which served as support last week, could cap gains, favoring consolidation above the support level of $2.00.
Cryptocurrency prices FAQs
Token launches influence demand and adoption among market participants. Listings on crypto exchanges deepen the liquidity for an asset and add new participants to an asset’s network. This is typically bullish for a digital asset.
A hack is an event in which an attacker captures a large volume of the asset from a DeFi bridge or hot wallet of an exchange or any other crypto platform via exploits, bugs or other methods. The exploiter then transfers these tokens out of the exchange platforms to ultimately sell or swap the assets for other cryptocurrencies or stablecoins. Such events often involve an en masse panic triggering a sell-off in the affected assets.
Macroeconomic events like the US Federal Reserve’s decision on interest rates influence crypto assets mainly through the direct impact they have on the US Dollar. An increase in interest rate typically negatively influences Bitcoin and altcoin prices, and vice versa. If the US Dollar index declines, risk assets and associated leverage for trading gets cheaper, in turn driving crypto prices higher.
Halvings are typically considered bullish events as they slash the block reward in half for miners, constricting the supply of the asset. At consistent demand if the supply reduces, the asset’s price climbs.
추천 기사


