
Meme coins to watch: TRUMP, Fartcoin hover near key support as sell pressure mounts
- Meme coins are facing increasing sell-side pressure as bearish sentiment weighs on the broader cryptocurrency market.
- TRUMP meme coin drops to test the $10.00 support, with multiple technical indicators flashing sell signals.
- Fartcoin plunges 45% from recent highs, entering oversold territory and raising hopes of a potential rebound.
Overhead pressure continues to weigh on the cryptocurrency market, particularly on highly volatile assets like meme coins. The Official Trump (TRUMP) token is struggling to stay above the $10.00 support level, reflecting a lethargic sentiment. Meanwhile, Fartcoin (FARTCOIN) offers subtle reversal signs despite multiple technical sell signals cautioning that the downtrend could last longer than expected.
TRUMP meme coin on the cusp of breaking $10.00 support
Sentiment surrounding the Official Trump token has remained relatively subdued since the exclusive dinner on May 22, which brought together the meme coin's top holders and President Trump in Washington, D.C.
Unlike the dinner announcement, which triggered a massive run in TRUMP's price to $16.43, the actual dinner was characterized by negative sentiment, as protesters demanded accountability from President Trump's family crypto projects, calling for an end to "crypto corruption."
The sell-off after the dinner has been persistent, with low interest among traders, limiting the probability of a sustained recovery. TRUMP's price hovers at around $10.64 at the time of writing, down over 1% on the day.
Multiple technical sell signals suggest that sellers have the upper hand despite the buyers' congestion at $10.00. The Moving Average Convergence Divergence (MACD) indicator validated a sell signal on Wednesday, encouraging traders to consider reducing exposure to TRUMP.
Such a signal occurs when the blue MACD line crosses below the red signal line. The daily chart below shows red histogram bars developing beneath the zero line (0.00), cementing the bearish outlook.
The SuperTrend is another technical indicator with a bearish bias, which has sustained a sell signal since May 23. This trend-following tool utilizes the Average True Range (ATR) to gauge market volatility and identify bullish and bearish scenarios.
A sell signal emerges when the price falls below the SuperTrend line, as the color changes from red to green. Should TRUMP's price drop below the short-term support at $10.00, traders could anticipate a 34% correction to the support tested in April at $7.14.
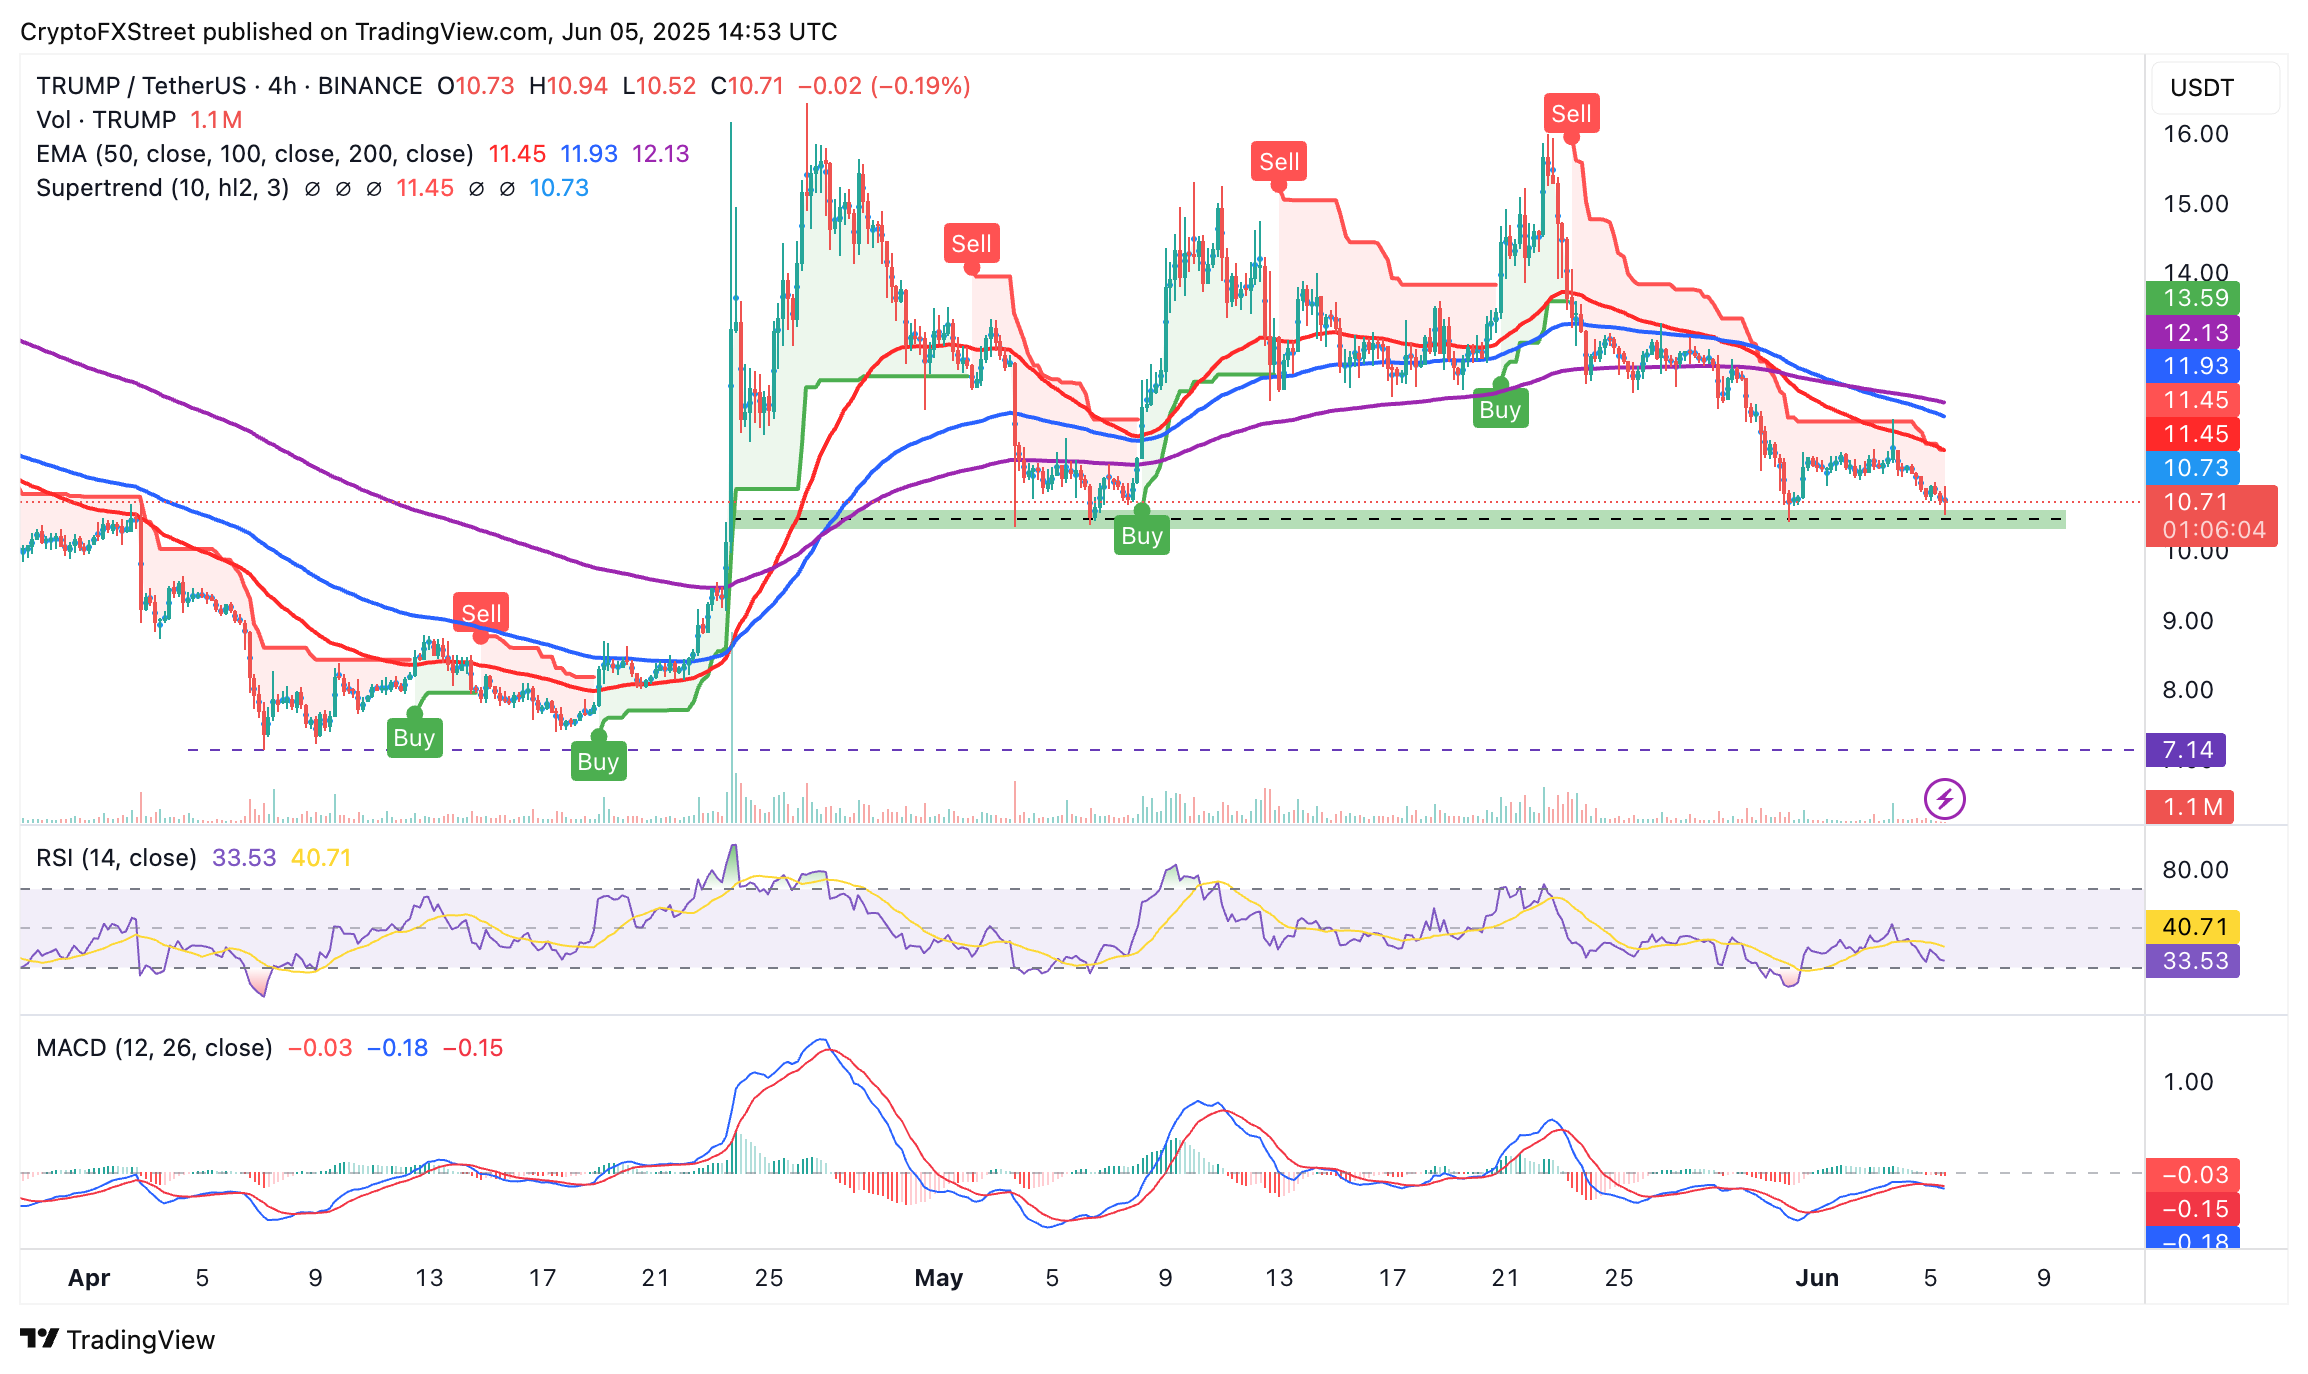
TRUMP/USDT 4-hour chart
Fartcoin recovery lingers after extended downtrend
Fartcoin shows signs of a reversal following a 45% retracement from its highest peak of $1.64 in May. Based on the 4-hour chart below, the meme coin eyes a potential return above the pivotal $1.00 level.
The RSI rebounded into neutrality at 36, signaling a return from the oversold area, which signals a bullish momentum. However, traders must closely follow the indicator's movement, with recovery above the 50 midline indicating the strength of the uptrend.
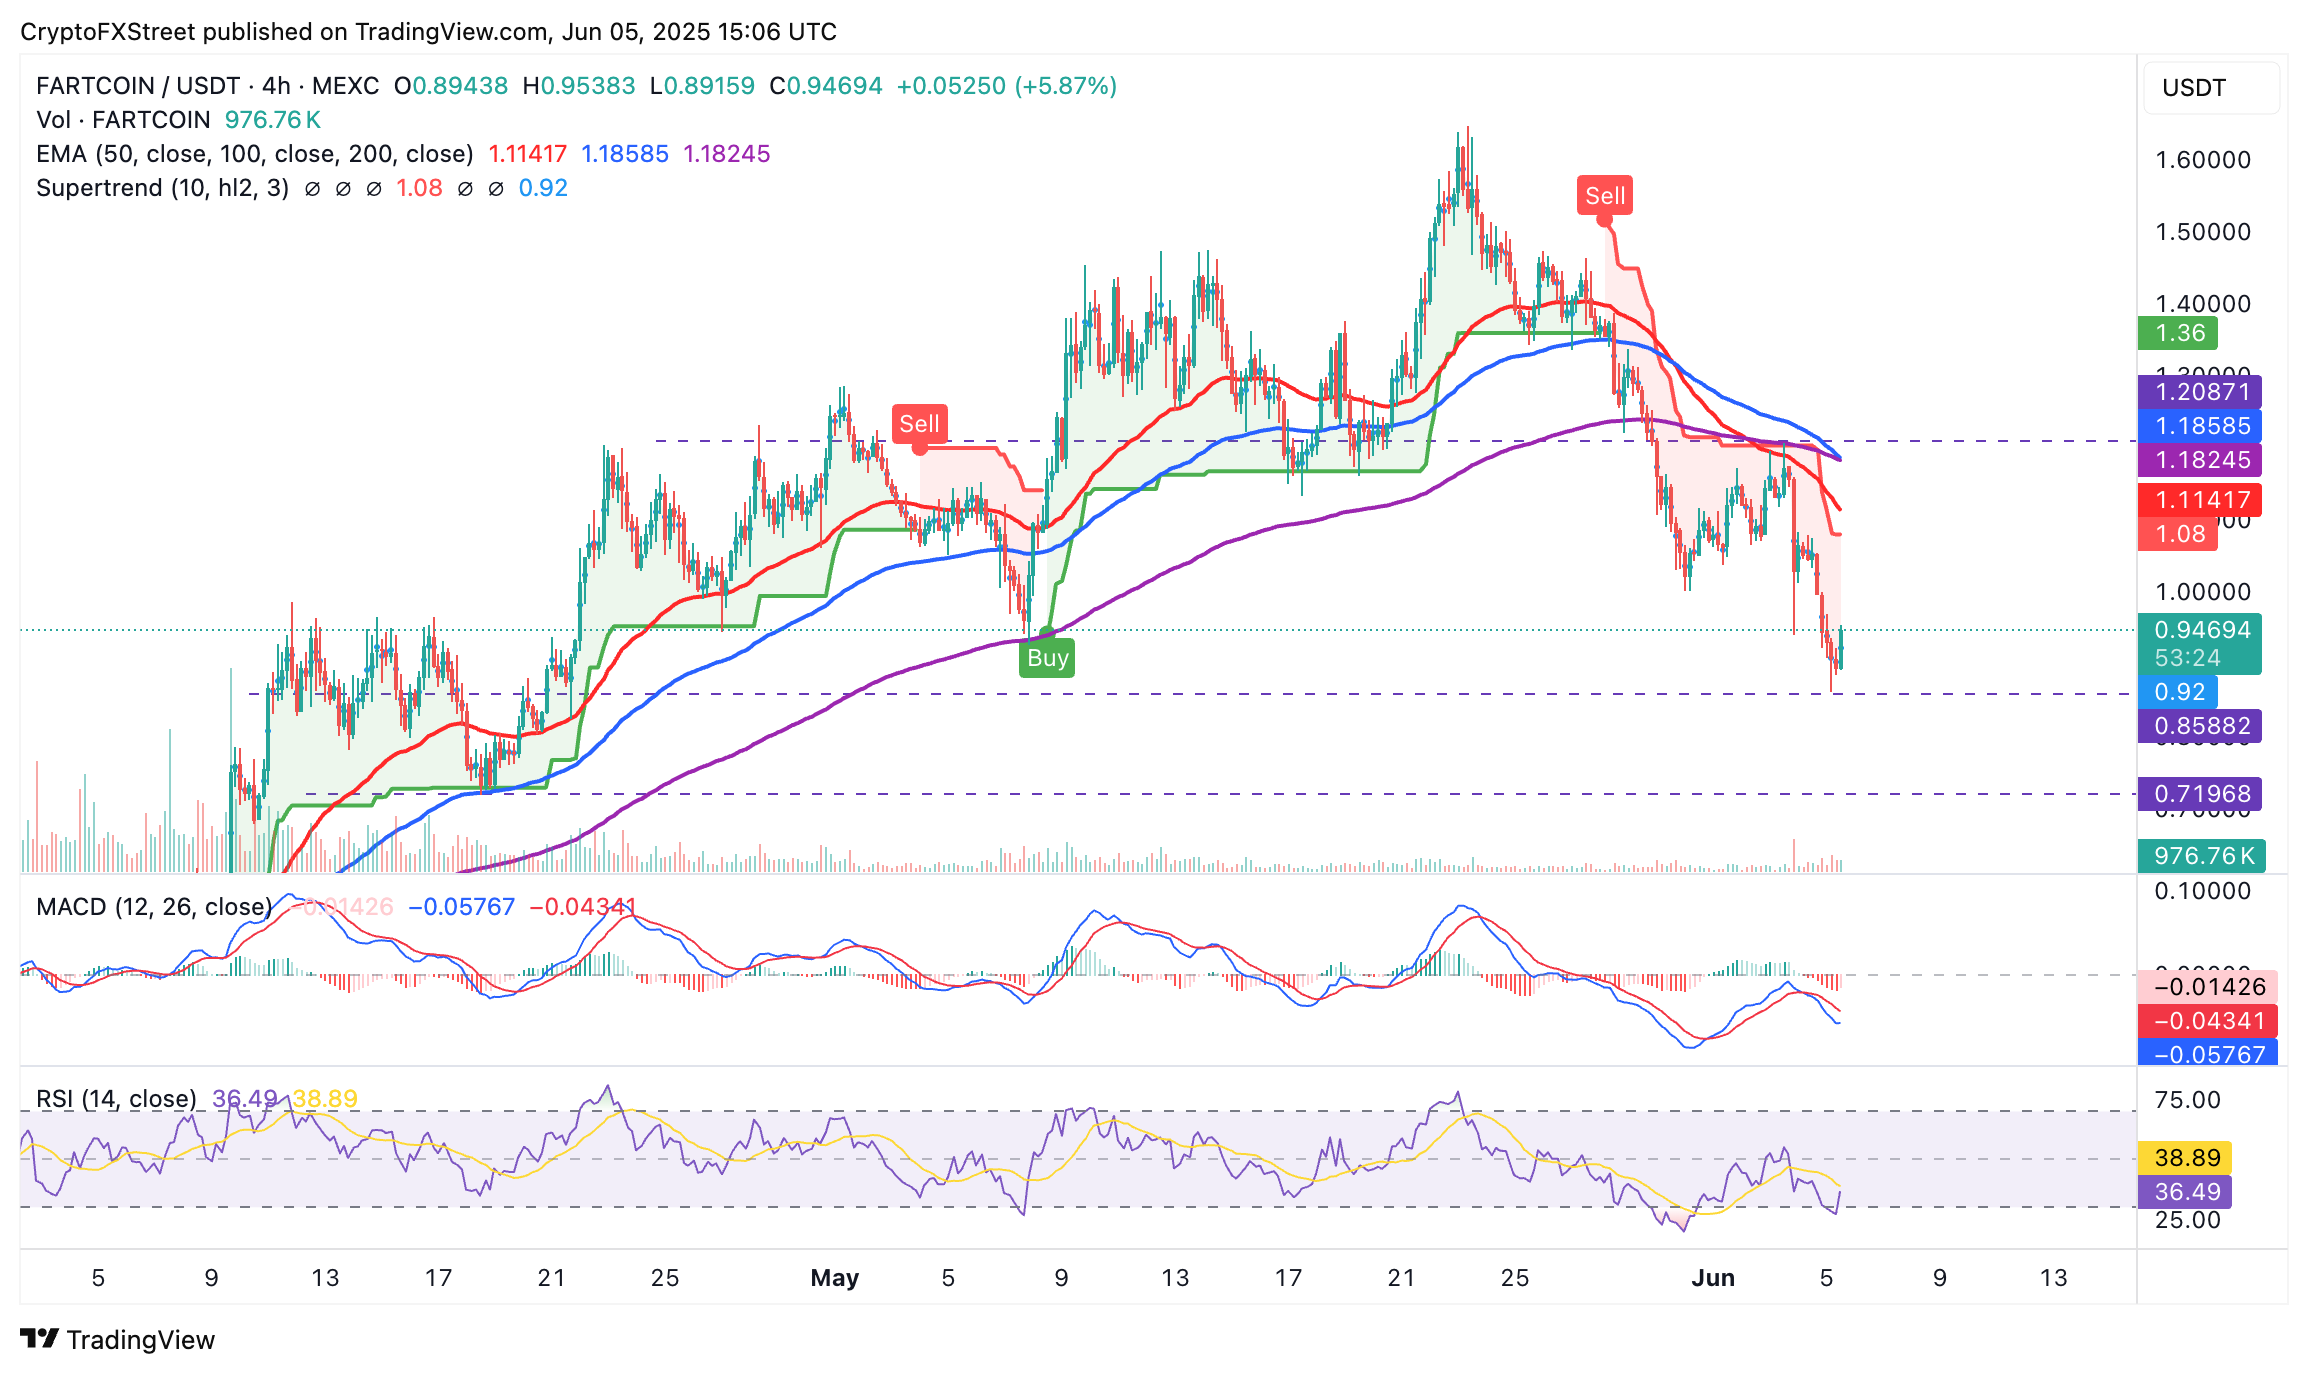
FARTCOIN/USDT 4-hour chart
Still, Fartcoin's position below all three moving averages, including the 50-period Exponential Moving Average (EMA), the 100-period EMA, and the 200-period EMA, implies that bulls are at a greater risk compared to bears.
A MACD sell signal could see the downtrend accelerate if traders continue selling FARTCOIN. Key areas of interest include the support at $0.71, last tested on April 18, and the demand zone at $0.49, which was previously tested as support on April 9.
Cryptocurrency prices FAQs
Token launches influence demand and adoption among market participants. Listings on crypto exchanges deepen the liquidity for an asset and add new participants to an asset’s network. This is typically bullish for a digital asset.
A hack is an event in which an attacker captures a large volume of the asset from a DeFi bridge or hot wallet of an exchange or any other crypto platform via exploits, bugs or other methods. The exploiter then transfers these tokens out of the exchange platforms to ultimately sell or swap the assets for other cryptocurrencies or stablecoins. Such events often involve an en masse panic triggering a sell-off in the affected assets.
Macroeconomic events like the US Federal Reserve’s decision on interest rates influence crypto assets mainly through the direct impact they have on the US Dollar. An increase in interest rate typically negatively influences Bitcoin and altcoin prices, and vice versa. If the US Dollar index declines, risk assets and associated leverage for trading gets cheaper, in turn driving crypto prices higher.
Halvings are typically considered bullish events as they slash the block reward in half for miners, constricting the supply of the asset. At consistent demand if the supply reduces, the asset’s price climbs.
추천 기사


