


FARTCOIN Price Forecast: Bullish channel fallout triggers price drop alert to $1.18
- Fartcoin is nearing its first bearish weekly closing after seven consecutive bullish weeks.
- Weakness in Fartcoin leads to increased long liquidations and a surge in bearish sentiment in the derivatives market.
- Fartcoin’s technical outlook suggests increasing downside risk as the two-month rising channel breaks.
Fartcoin (FARTCOIN) is down 11% so far this week on Thursday, resulting in a large wipeout of bullish-position holders in the derivatives market, and warns of a steeper correction with the breakdown of a bullish channel pattern.
Fartcoin concludes the two-month-long bull run
The Fartcoin price action formed a rising channel pattern over the last two months with multiple higher highs and higher lows creating parallel resistance and support trendlines.
However, a 4.79% drop on Wednesday led to a massive wipeout of bullish-aligned traders in the Fartcoin derivatives. According to Coinglass, the daily long liquidations accounted for $3.06 million on Thursday compared to a minor $248K in short liquidation.
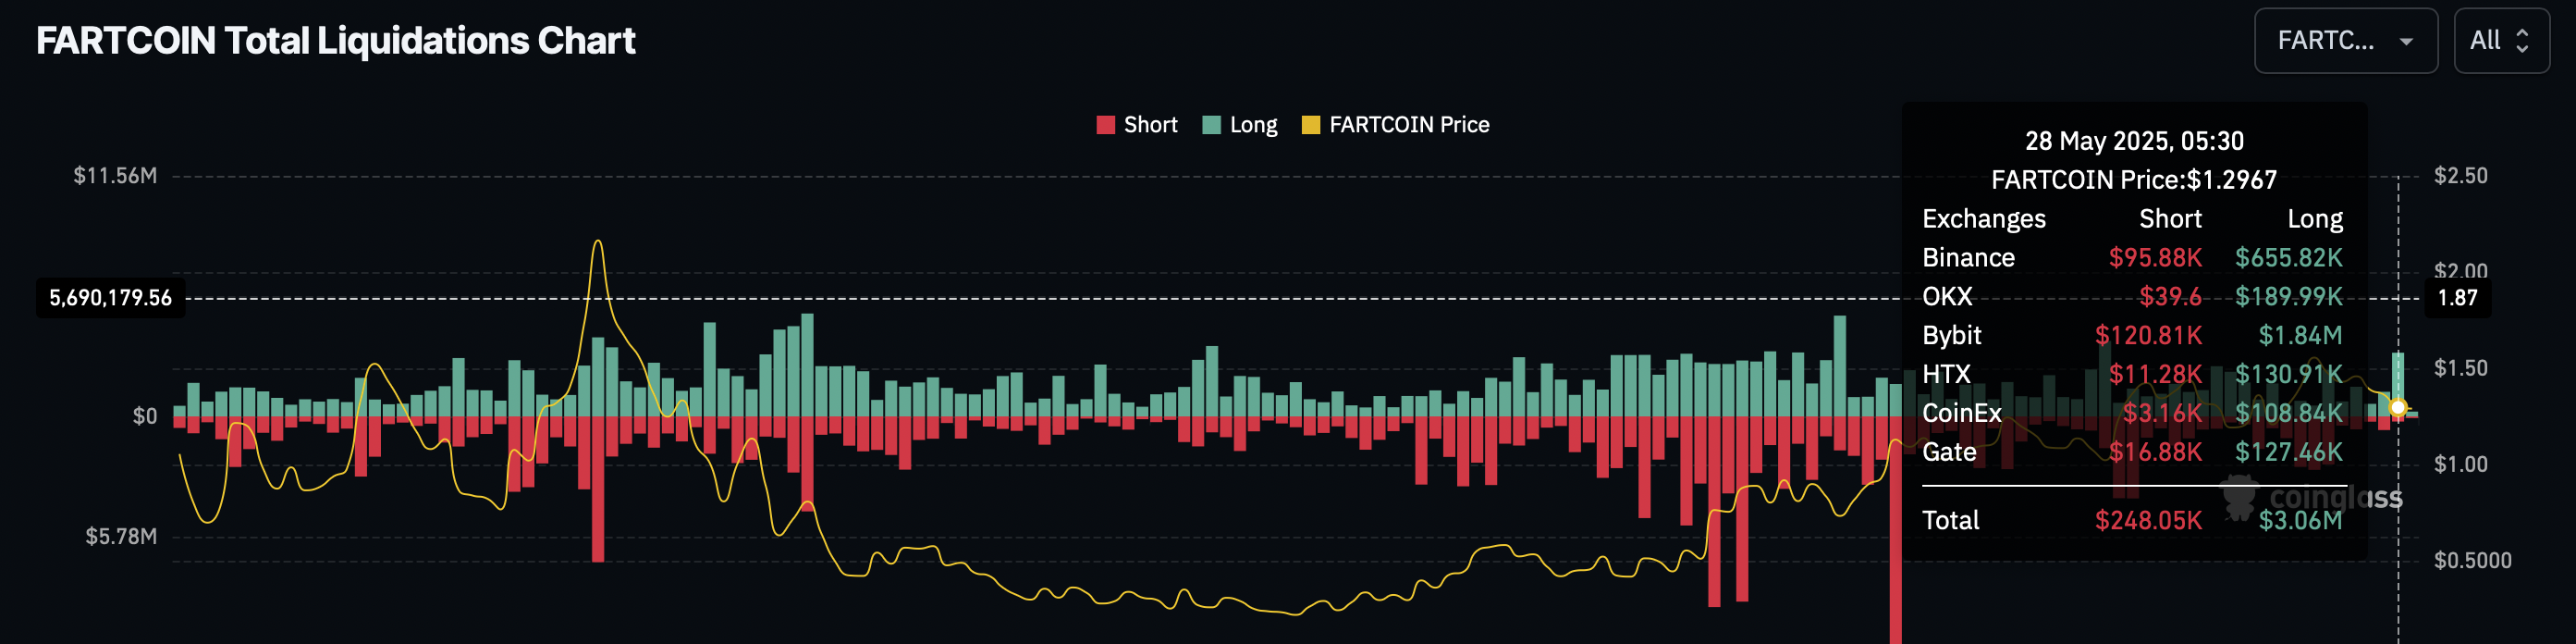
Fartcoin Liquidations Chart. Source: Coinglass
With the exodus of Fartcoin bulls, the Open Interest (OI) takes a 4.27% hit in the last 24 hours, dropping to $617.78 million. This suggests a significant decline in trading activity and a loss of interest among traders.
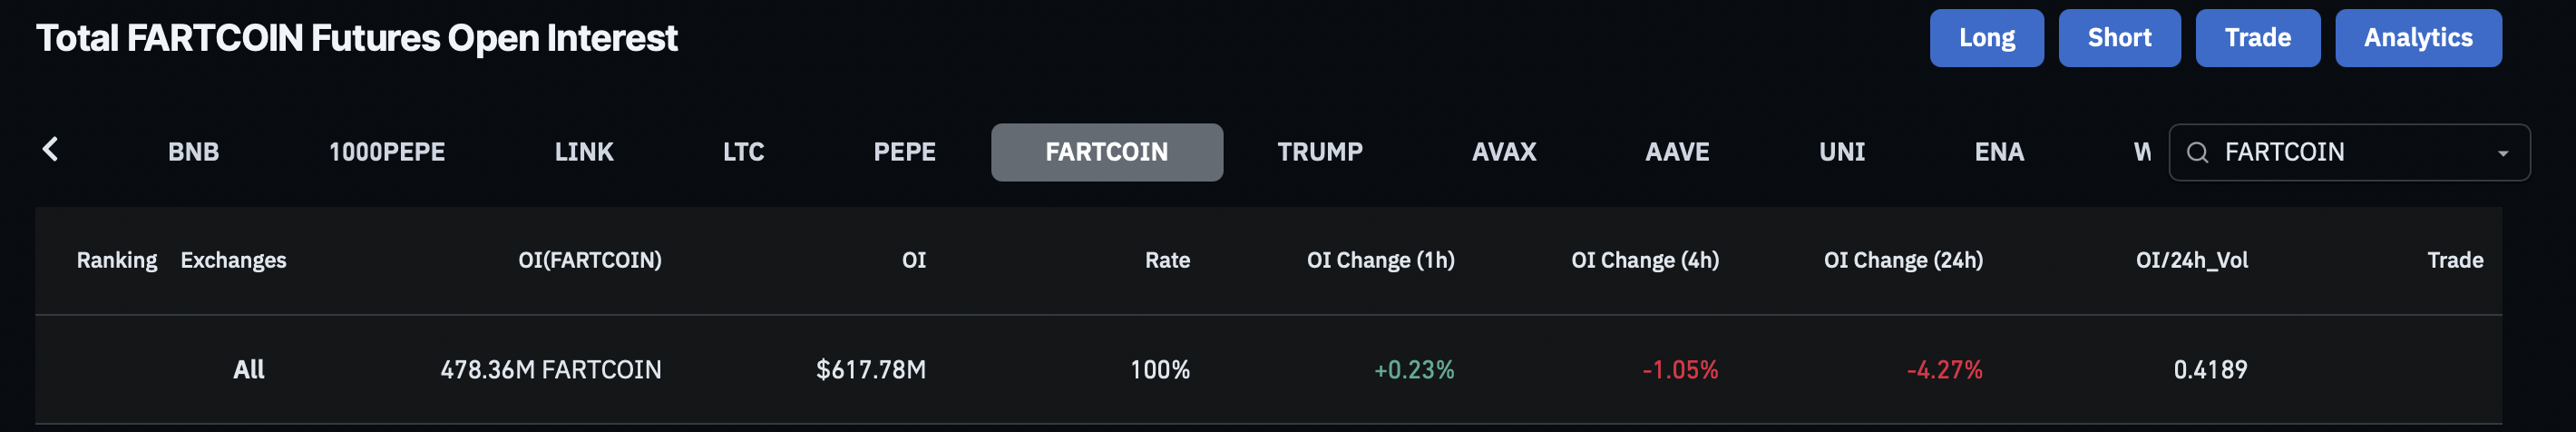
Total Fartcoin Futures Open Interest. Source: Coinglass
As the tables turn, the taker buy/sell volume, as measured by the Long/Short Ratio, reveals that the taker sell volume has risen to 53.63% of all taker activity over the last four hours, pushing the long/short ratio down to 0.8646.
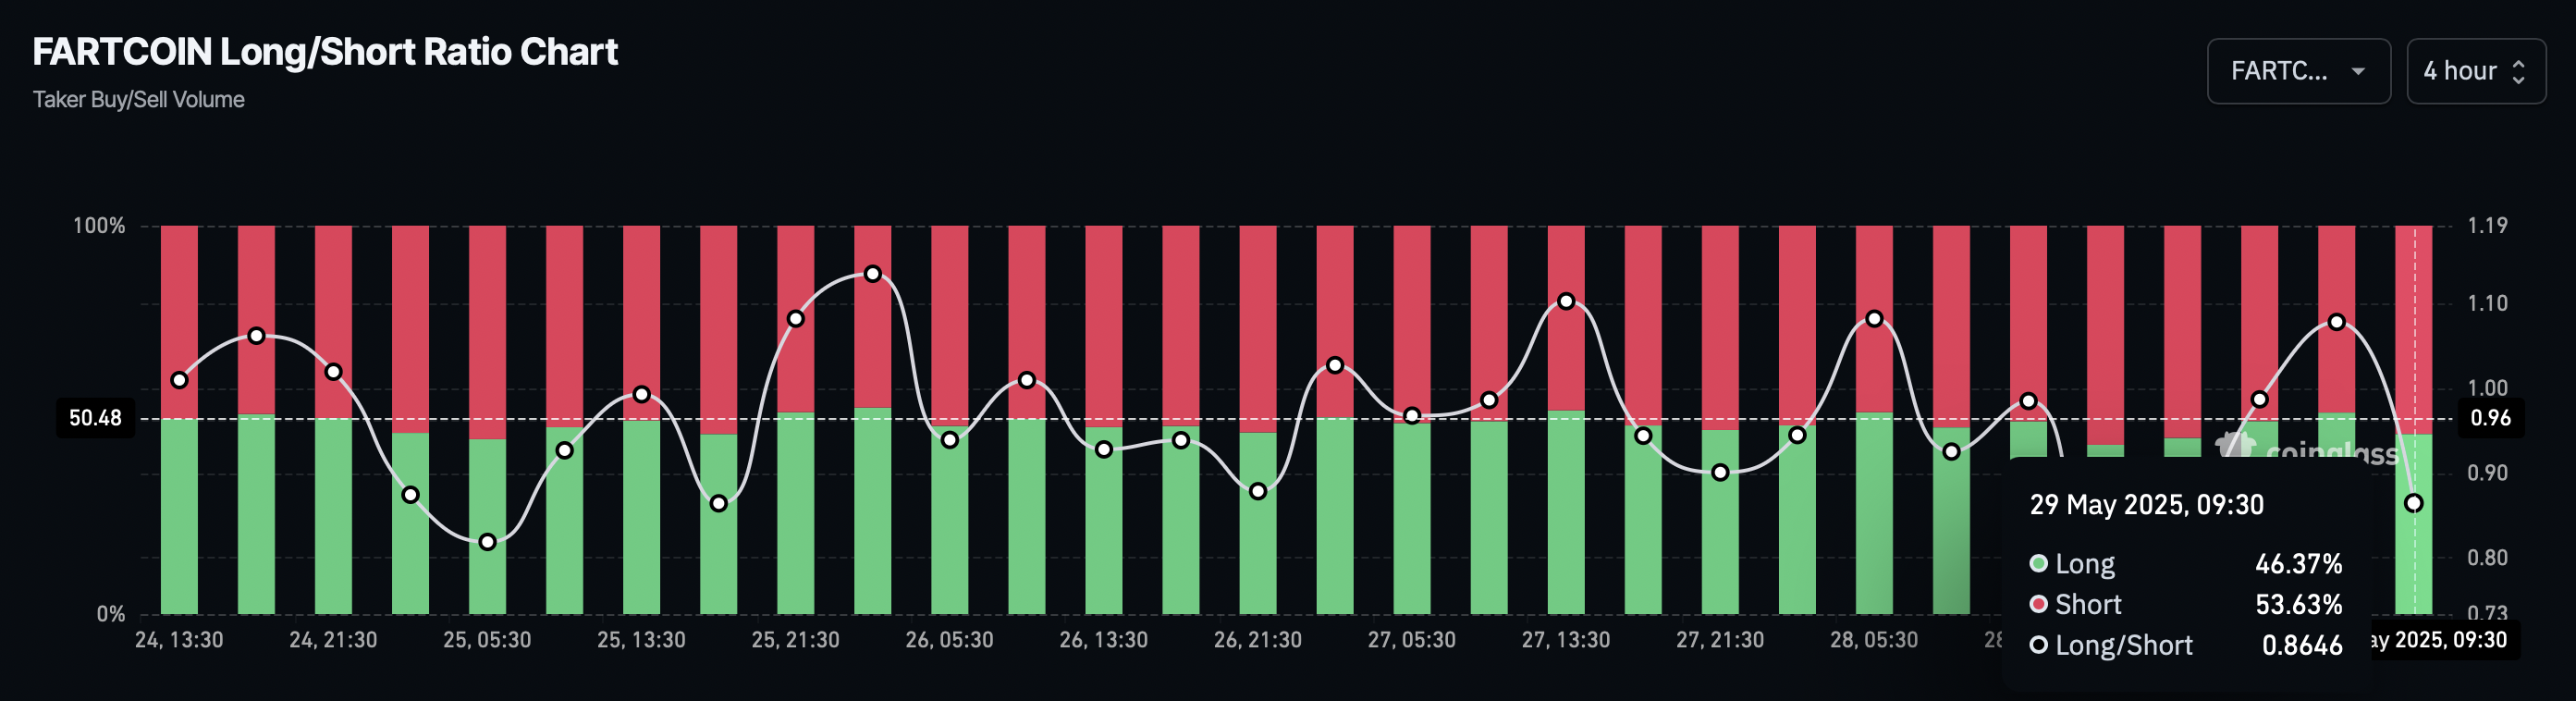
Fartcoin Long/Short Ratio Chart. Source: Coinglass
With the 4.79% drop on Wednesday, the meme coin broke below the channel’s lower boundary line, triggering a sell signal.
With a fourth consecutive daily bearish candle in the making, Fartcoin is down 11% this week. Supporting the downside risk, the momentum indicators are losing strength.
The Moving Average Convergence/Divergence (MACD) indicator drops below its signal line, flashing a bearish crossover, and trends closer to the centre line. This suggests a weakness in bullish momentum.
The Relative Strength Index (RSI) at 50 turns flat near the halfway point after reversing from the overbought boundary line. A bearish divergence is visible in RSI, as it formed lower peaks while the Fartcoin price maintained a higher high formation, foreshadowing the ongoing correction. If the RSI line falls below 50, a bearish trend is likely to gain momentum.
Based on the Fibonacci levels drawn from the opening prices of January 20 ($2.15) to March 11 ($0.20), Fartcoin’s immediate support is the 50% Fibonacci retracement level at $1.18. A potential breakdown below $1.18 will trigger a sell signal, targeting a drop to the next support level at $1.02, a previous low formed on May 7.
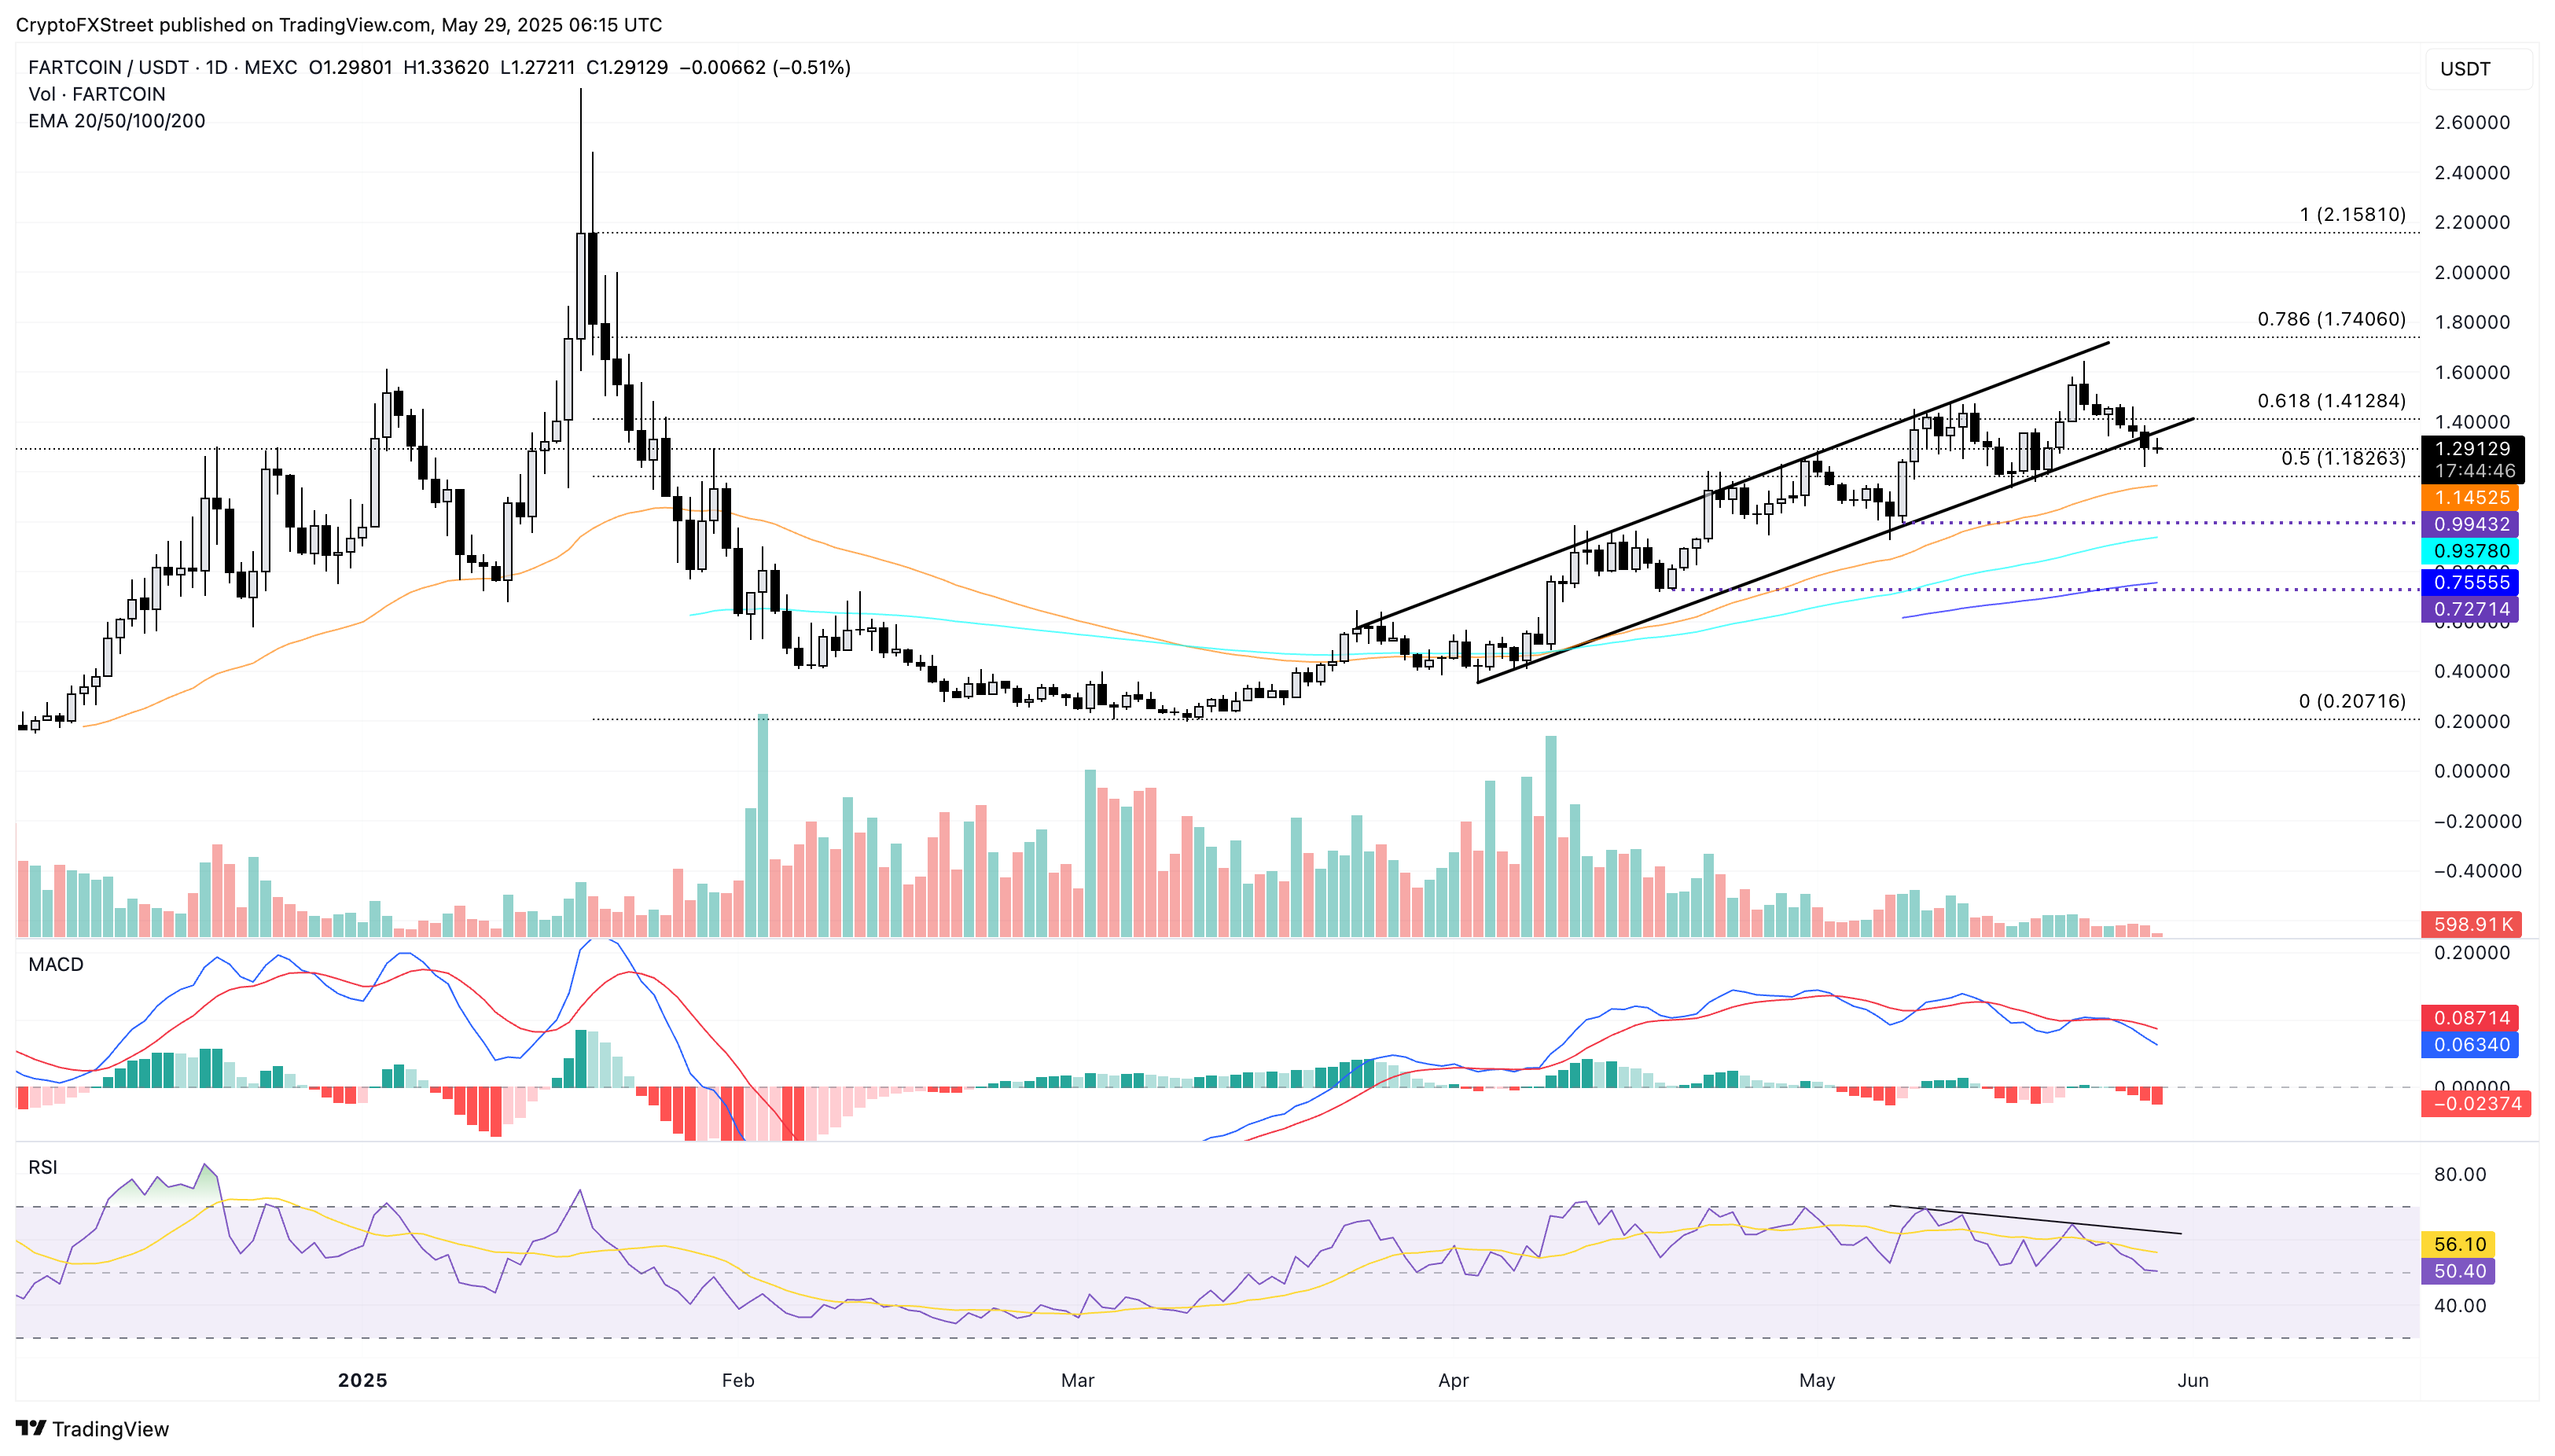
FARTCOIN/USDT daily price chart. Source: Tradingview
On the contrary, a new leg formation at $1.18 could help Fartcoin sustain the uptrend. For bullish-aligned traders, the breakout of the $1.41 level (61.8% Fibonacci retracement) could be an entry opportunity with a target at $1.74 (78.6% Fibonacci retracement).
추천 기사


