


Crypto market cap fell more than 18% in Q1, wiping out $633.5 billion after Trump’s inauguration top
- CoinGecko Q1 Crypto Industry Report highlights that the total crypto capitalization market fell by more than 18% in the first quarter.
- This decline was accompanied by a drop in investor activity, with average daily trading volumes plunging 27.3% quarter-on-quarter.
- Bitcoin fell by 11.8% in the same period, but its dominance increased, and it was outperformed by Gold and US Treasuries.
CoinGecko’s Q1 Crypto Industry Report highlights that the total crypto market capitalization fell by 18.6% in the first quarter, wiping out $633.5 billion after topping on January 18, just a couple of days ahead of US President Donald Trump’s inauguration. This decline was accompanied by a drop in investor activity, with average daily trading volumes plunging 27.3% quarter-on-quarter. In the same period, Bitcoin (BTC) fell by 11.8%, but its dominance increased, and it was outperformed by Gold and US Treasuries.
Crypto slump in Q1
On Wednesday, CoinGecko’s ‘Q1 Crypto Industry Report’ highlighted the crypto market’s overall performance in the first quarter. The report explains that the total crypto market capitalization fell by 18.6%, wiping out $633.5 billion from the crypto market in Q1. The market found a local top of $3.8 trillion on January 18, two days before Donald Trump’s inauguration, and by the end of the quarter, it stood at $2.8 trillion. Moreover, this decline was accompanied by a drop in investor activity, with average daily trading volumes plunging 27.3% quarter-on-quarter, as shown in the graph below.
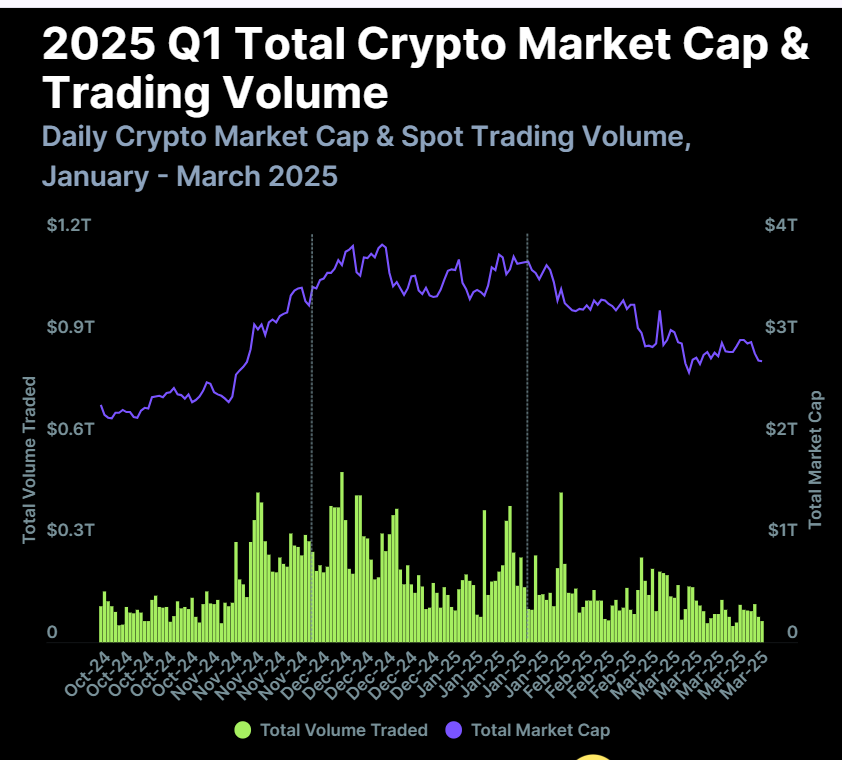
Q1 total crypto market cap & trading volume chart. Source: CoinGecko
The report further explains that the BTC continued to climb in dominance, increasing by 4.6% in Q1 and ending the quarter with a 59.1% dominance, levels not seen since Q1 2021. Crypto investors moved toward stablecoins to find stability from the market downturn, such as Tether (USDT), which rose slightly to a 5.2% market share. At the same time, USDC stablecoin regained its seventh spot, replacing Dogecoin (DOGE).
Looking down on Ethereum (ETH), the report continued that ETH fell by 3.9%, with its dominance reaching 7.9%, the lowest level since late 2019. Other altcoins fell by a smaller magnitude, dropping by 3.5% to encompass 15.7% of the market. Only Ripple (XRP) and Binance Coin (BNB) retained their market share among the majors.
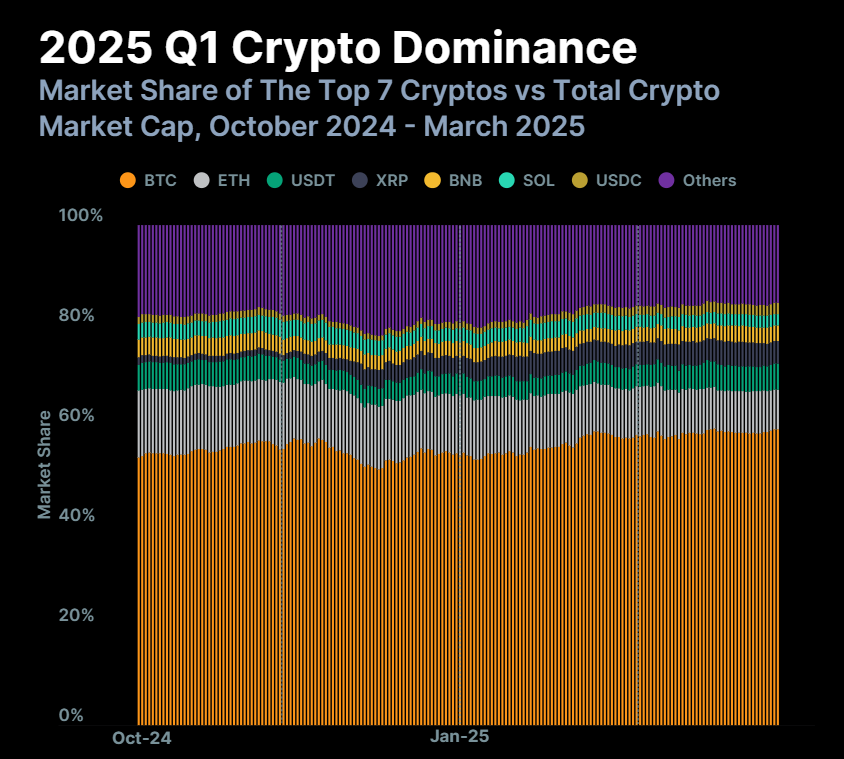
Q1 Crypto Dominance chart. Source: CoinGecko
Gold and US Treasuries outperformed Bitcoin
Bitcoin price rallied at the start of this year and reached a new all-time high of $106,182 on January 22, two days after Trump’s inauguration. This marked a year-to-date (YTD) top for BTC, as it trended down to end Q1 with a -11.8% decline at $82,514.
Amidst this quarter of turmoil and uncertainty due to the US tariff concerns, geopolitical instability, expected Federal Reserve (Fed) interest rate cuts, and strong central bank demand fueled a rally in the precious metal and positioned Gold as a safe-haven asset, as reported in the previous article.
CoinGecko’s report explains that Gold rallied 18% in Q1. Alongside BTC, risk assets such as the NASDAQ and S&P 500 declined, falling -10.3% and -4.4%, respectively, as shown in the graph below.
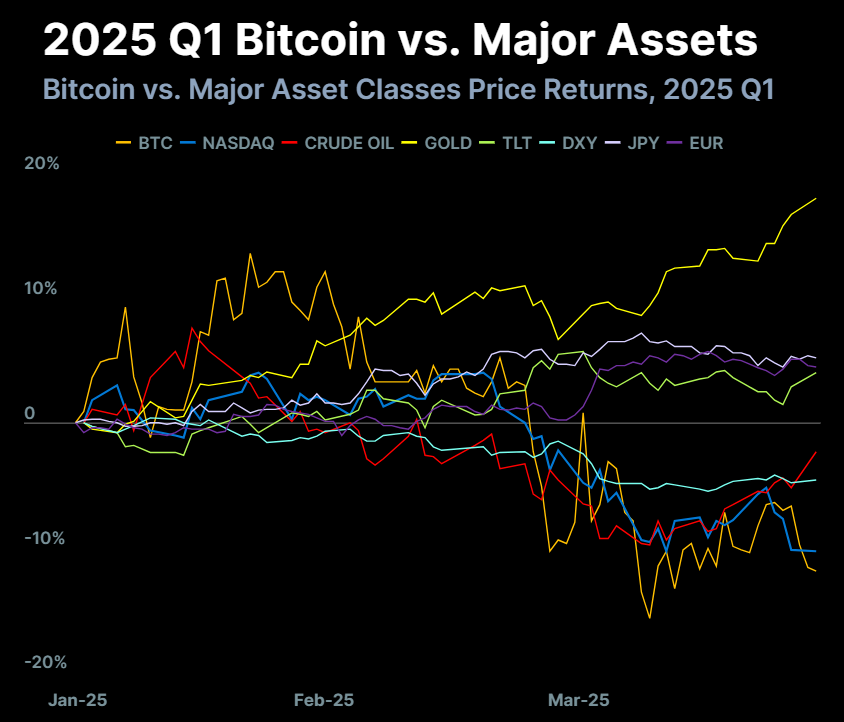
Q1 Bitcoin vs. Major assets chart. Source: CoinGecko
The report continued: “The DXY, usually inversely correlated to risk assets, fell -4.6%, potentially due to uncertainty over US tariffs. The JPY (+5.2%) and EUR (+4.5%) strengthened against the USD, the former at least partially due to further unwinding of the Yen carry trade as the BOJ raised interest rates in January.”
In an exclusive interview, Zhong Yang Chan, Head of Research at CoinGecko, told FXStreet that “the crypto market... is not immune to broader macroeconomic trends,” and emphasized that Bitcoin has shown notable resilience compared to altcoins, even amid ETF outflows and tightening monetary policy and said that “compared to other risk-on assets, we have actually seen Bitcoin weather the recent uncertainty pretty well, though altcoins have suffered badly in general. This is reflected in its dominance over the rest of the crypto market.”.
Chan added: “it is clear that the outlook for all financial markets, not just crypto, remain murky until there is more clarity and stability in macroeconomic conditions,” and “If Bitcoin is able to continue to remain resilient through this period, it will be on very firm footing for the rebound that will eventually come.”
추천 기사


