

How will Bitcoin price react to Trump’s latest crypto speech?
- Bitcoin price hit a new 10-day peak of $85,900 on Thursday, March 20, ahead of US President Trump’s speech at Blockwork's crypto digital asset summit.
- While BTC price tumbled to $83,400 after Trump’s speech, derivatives trading data suggest major reversals are unlikely.
- Technical indicators show that trading volumes must increase significantly for BTC to advance above $90,000.
Bitcoin price hit a new 10-day peak of $85,900 on Thursday, March 20, ahead of US President Donald Trump’s speech at Blockwork's crypto digital asset summit. While BTC price tumbled 4% from the day’s peak after Trump’s speech, derivatives trading signals suggest BTC is unlikely to witness rapid dips.
Why Bitcoin price tumbled 4% after Trump’s speech at Blockwork’s Crypto Summit
Bitcoin (BTC) experienced volatile price action on Thursday as President Trump spoke at Blockwork’s Digital Asset Summit.
During the speech, Trump reiterated his support for the crypto industry, emphasizing his intention to advance the proposed Crypto Strategic Reserve initiative.
However, since investors had already priced in most of these talking points during previous rallies this month, Trump's remarks failed to generate fresh bullish momentum.
 Bitcoin Price Analysis | BTCUSDT
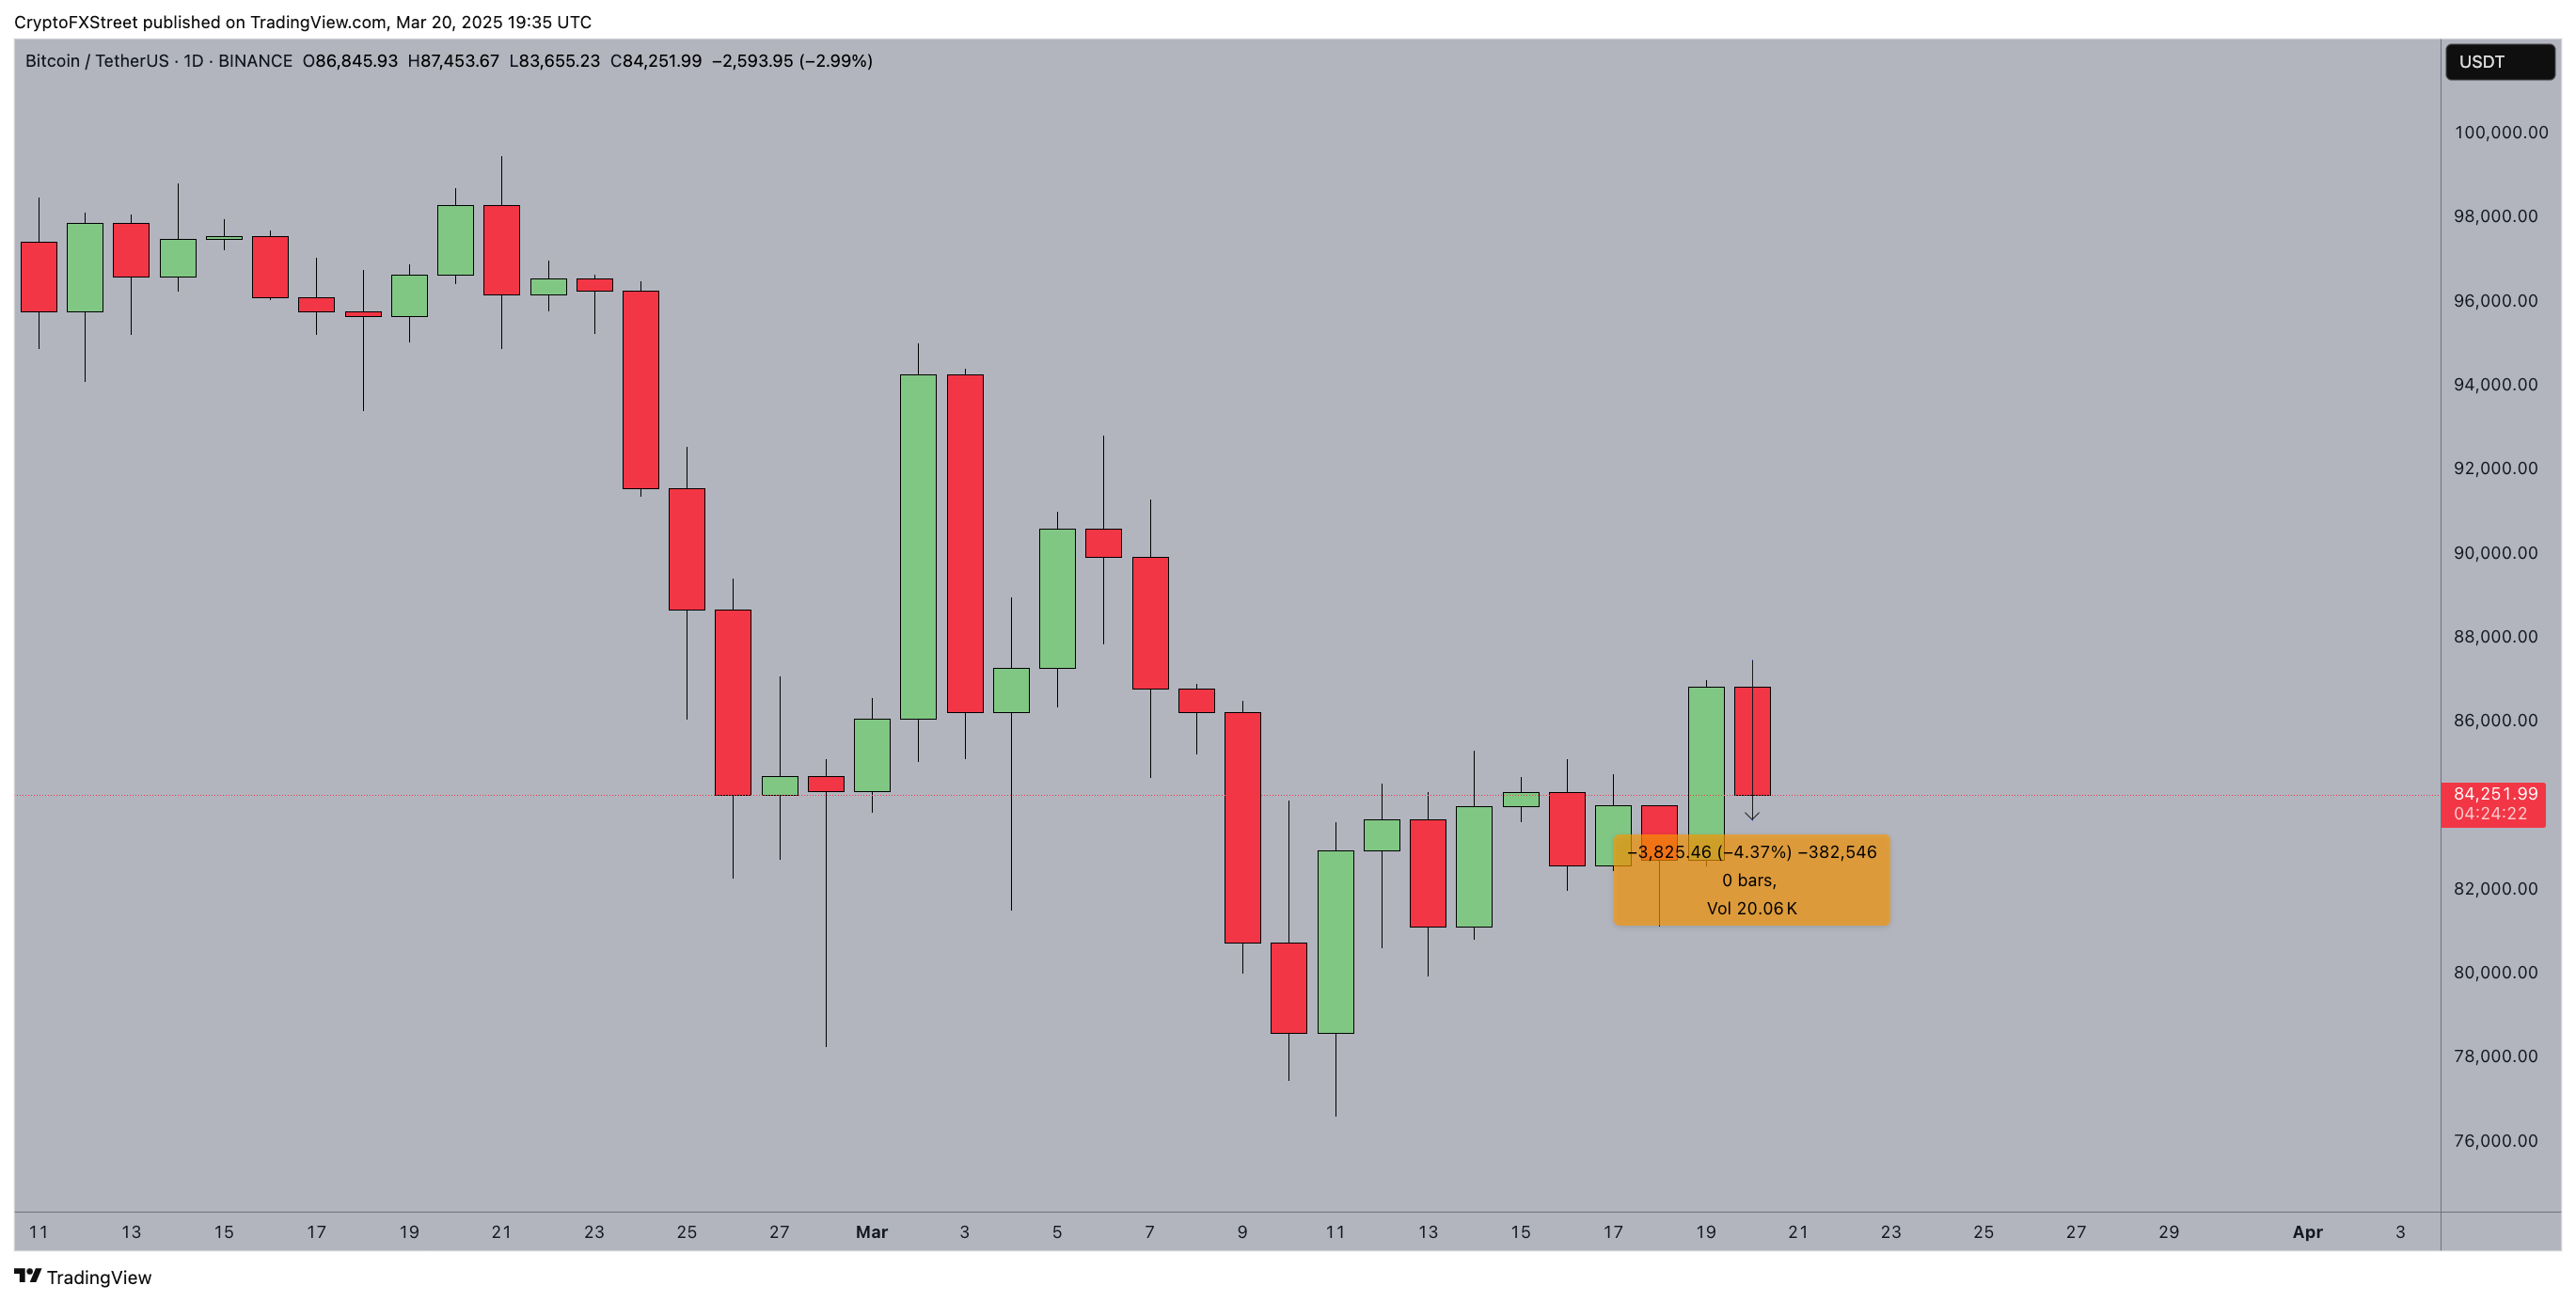
Within hours of the speech, Bitcoin tumbled to a new low of $83,600, marking a 4% decline from the day’s peak of $85,900.
The price action formed a long upper shadow, indicating a rejection at higher levels, reinforcing a potential bearish trend.
However, despite the dip, market volumes remained significantly lower than the previous trading session, suggesting that the sell-off lacked the momentum needed to trigger a larger downward move.
Despite mild Bitcoin price dip, derivatives market signals suggest bullish dominance
While Bitcoin briefly dipped 4% following Trump’s speech, derivatives market data suggests that bullish sentiment remains intact.
According to the liquidation heatmap, Bitcoin recorded $159.59 million in total liquidations over the past 24 hours with short positions accounting for $90.66 million, surpassing long liquidations of $68.94 million.
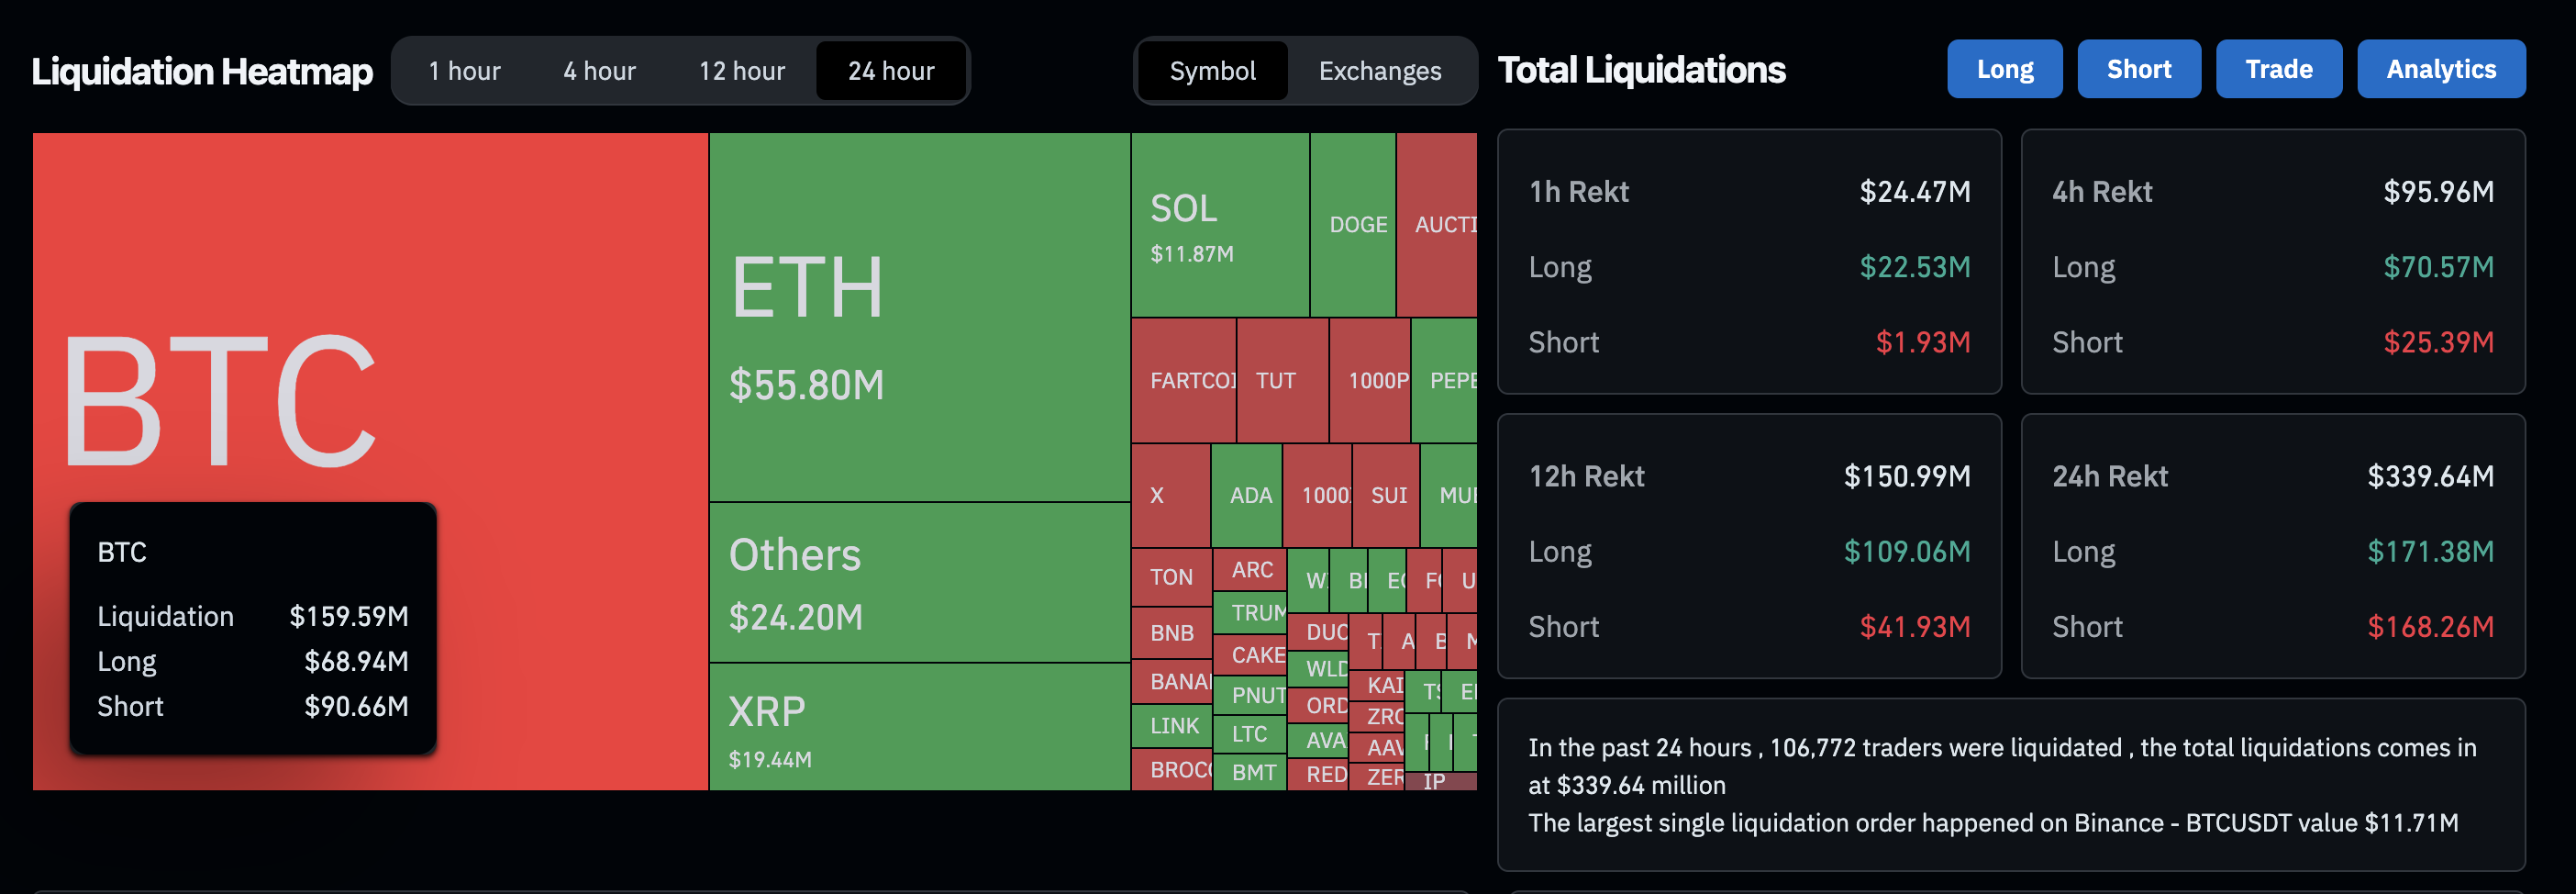 Crypto Market Liquidation Heatmap | Source: Coinglass
This trend differs from the broader crypto market, where total liquidations of $339.64 million show longs worth $171.38 million closed, outpacing shorts vs. $168.26 million.
This suggests while the sentiment among altcoin traders appears more tense, Bitcoin’s short-term traders remain dominantly bullish — with a higher proportion of short liquidations indicating that traders betting against BTC continue to get squeezed.
More so, on-chain data previously showed a $14 billion surge in large BTC transactions leading up to the Federal Reserve’s (Fed) pause in interest rate hikes, reflecting strong institutional demand.
While Trump’s speech failed to deliver new bullish catalysts, the derivatives trading signals observed on Thursday suggest BTC is unlikely to witness a prolonged sell-off.
Bitcoin price prediction: Consolidation above $82,000 could trigger $90K rally
Bitcoin price forecast suggests a period of consolidation above the $82,000 support zone could provide the momentum required for a breakout toward $90,000.
The liquidation heatmap reveals that short liquidations have exceeded long liquidations in Bitcoin markets, signaling that bearish bets are getting squeezed.
This pattern typically indicates strong buying pressure at key support levels, reinforcing the likelihood of an upward continuation.
 Bitcoin Price Prediction | BTCUSD
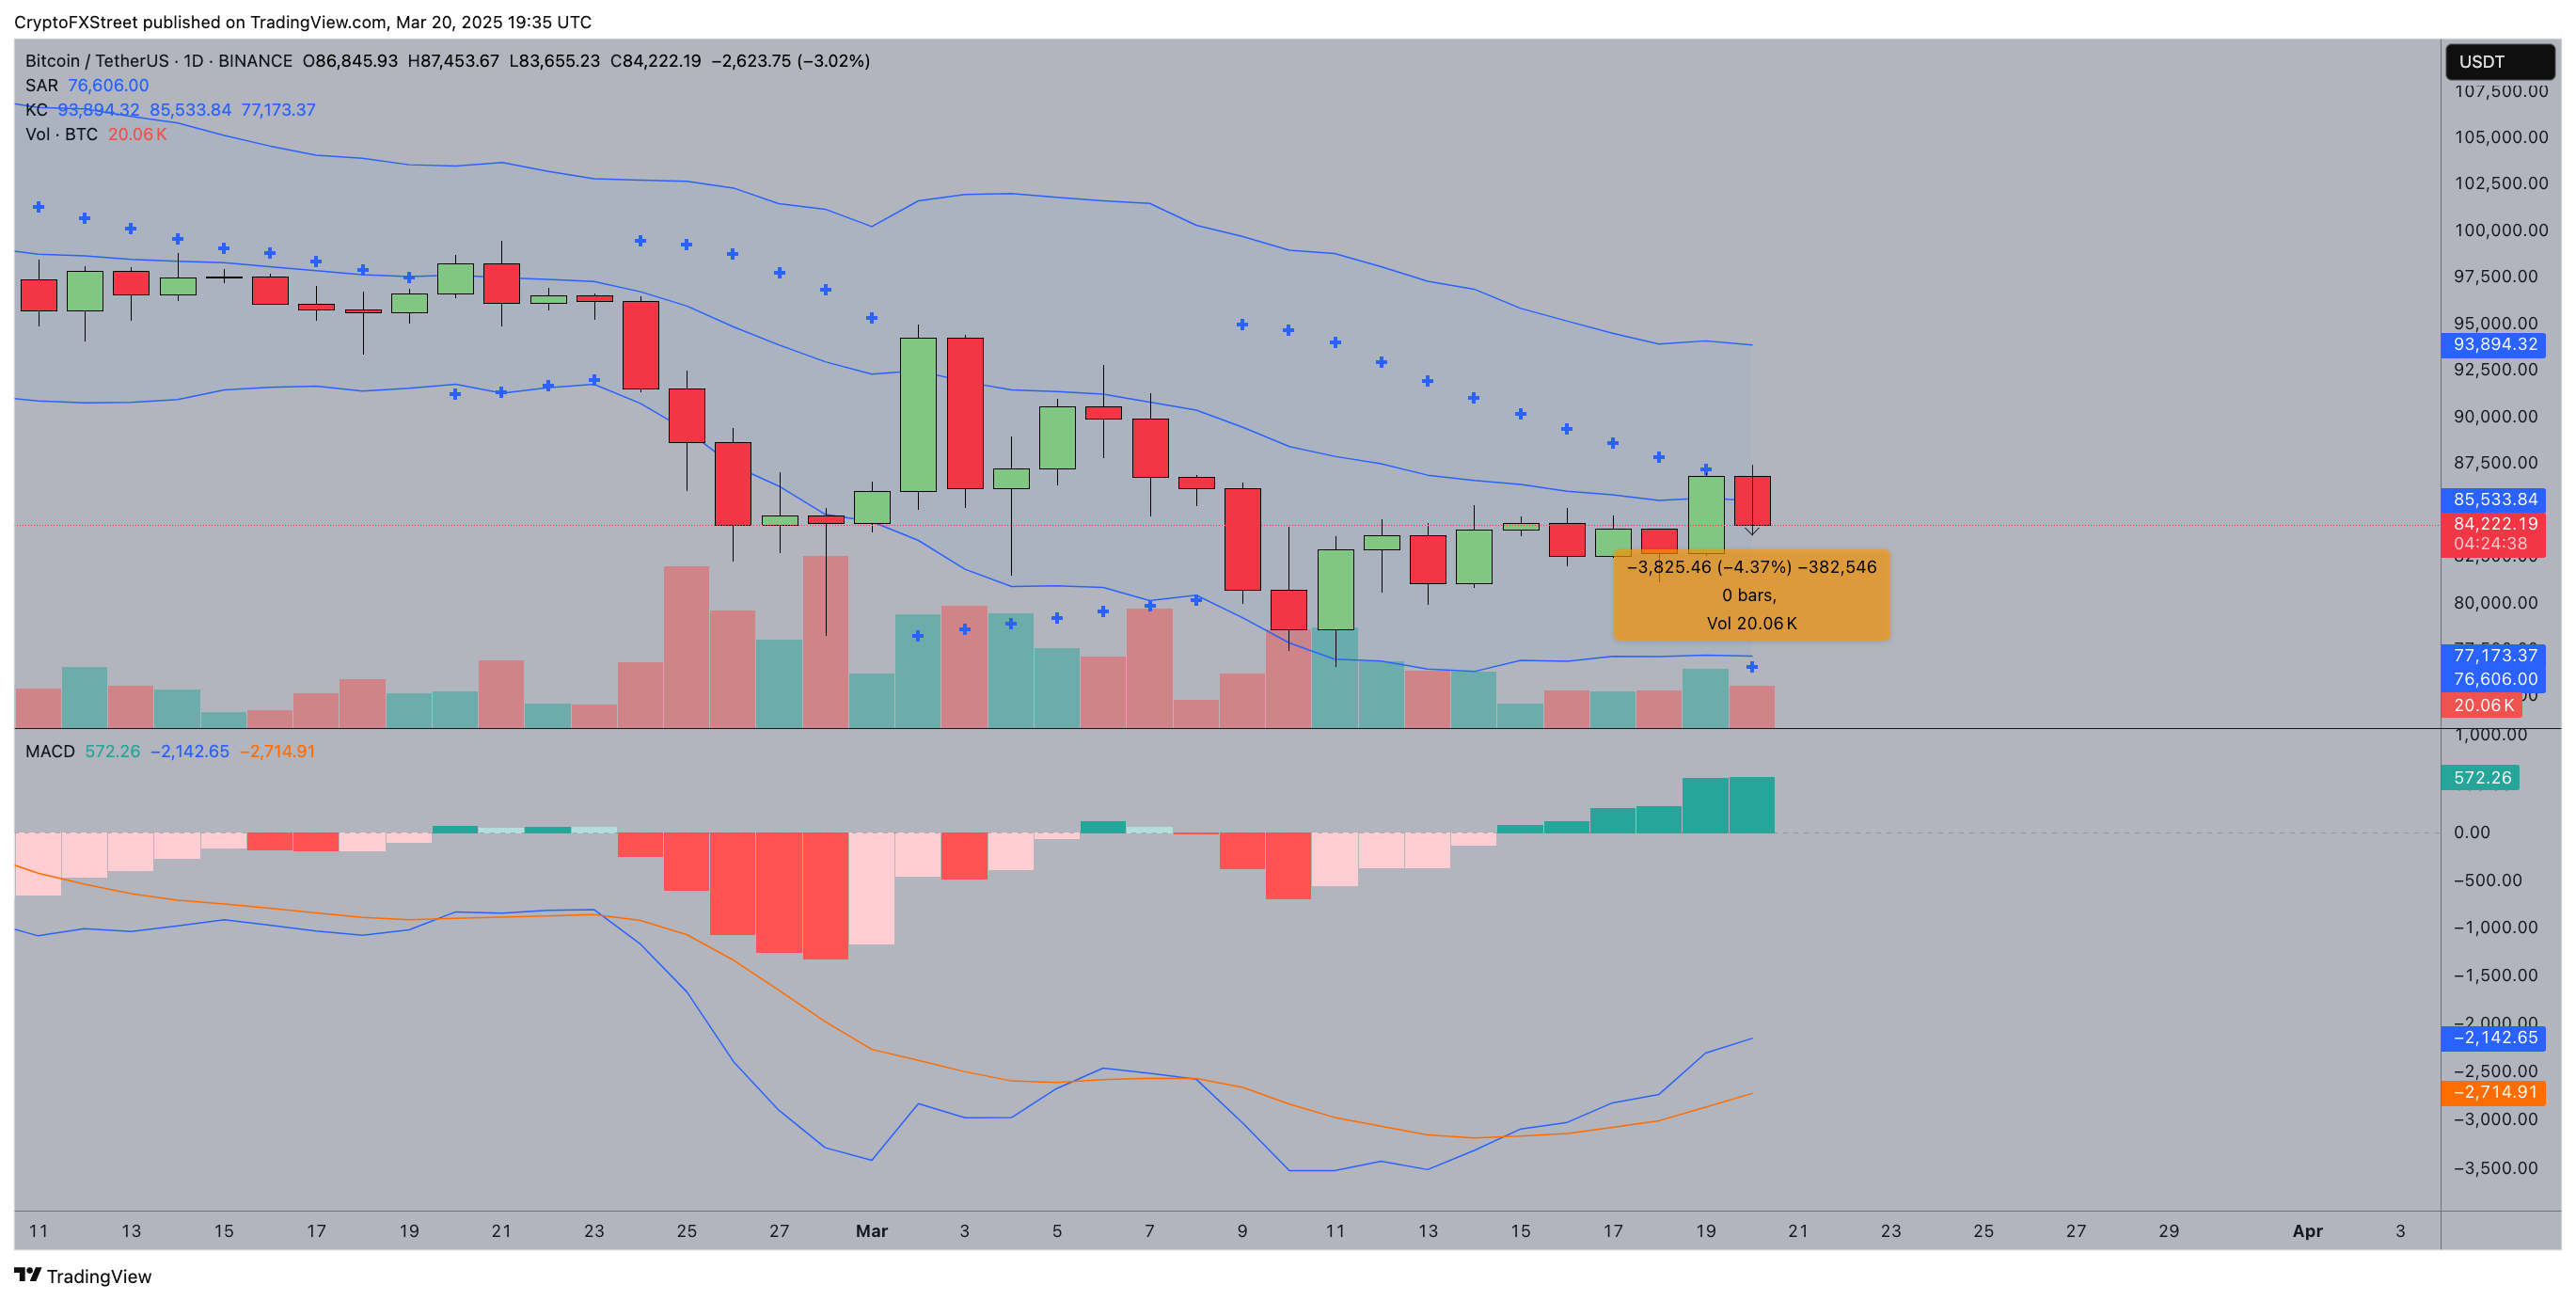
Technical indicators also support a cautiously bullish outlook.
BTC’s price action is currently stabilizing within a range between $83,600 and $85,900, with resistance evident near the upper Bollinger Band at $92,252.
The lower Bollinger Band, positioned at $78,065, presents a critical support threshold should selling pressure intensify.
The Parabolic SAR indicator, which tracks trend direction, remains below BTC’s price action, reflecting underlying bullish support.
However, the Average Daily Range (ADR) at 0.80 suggests waning volatility, implying that Bitcoin needs a volume surge to sustain a decisive breakout.
In a bullish scenario, reclaiming $86,000 with strong volume could propel BTC toward the $90,000 resistance zone.
Conversely, if Bitcoin fails to hold above $84,000, a retest of the $80,000–$78,000 range becomes likely, with further downside risk toward $76,600 if whale accumulation slows.
추천 기사


