

BNB Price Forecast: Bulls aim for $680 mark
- BNB price trades in green on Thursday after finding support around its key level the previous day.
- The technical outlook suggests a rally ahead as momentum indicators show a bullish projection, targeting $679.90.
- A daily candlestick close below $576.61 would invalidate the bullish thesis.
BNB (BNB) price is trading slightly above $624 on Thursday after finding support around its key level the previous day. The technical outlook suggests a rally ahead as momentum indicators show a bullish projection, targeting $679.90.
BNB price shows potential for a rally
BNB's price broke above its 200-day Exponential Moving Average (EMA) at around $620.5 and rose nearly 5% on Monday. This level roughly coincides with the daily resistance level at $612.50, and a breakout above these levels indicates a bullish move. However, BNB declined slightly over the next two days, retesting and finding support around the daily level of $612.50. At the time of writing on Thursday, it trades slightly higher, around $624.
If the $612.50 daily support level continues to hold, BNB price could extend the rally to retest its Feburary 22 high of $679.90.
The Relative Strength Index (RSI) supports the bullish thesis as it reads 54, above its neutral level of 50, indicating bullish momentum.
The Moving Average Convergence Divergence (MACD) also showed a bullish crossover last week, giving buy signals and suggesting a bullish trend ahead. Additionally, it shows rising green histogram levels above its neutral level of zero, indicating strength in upward momentum.
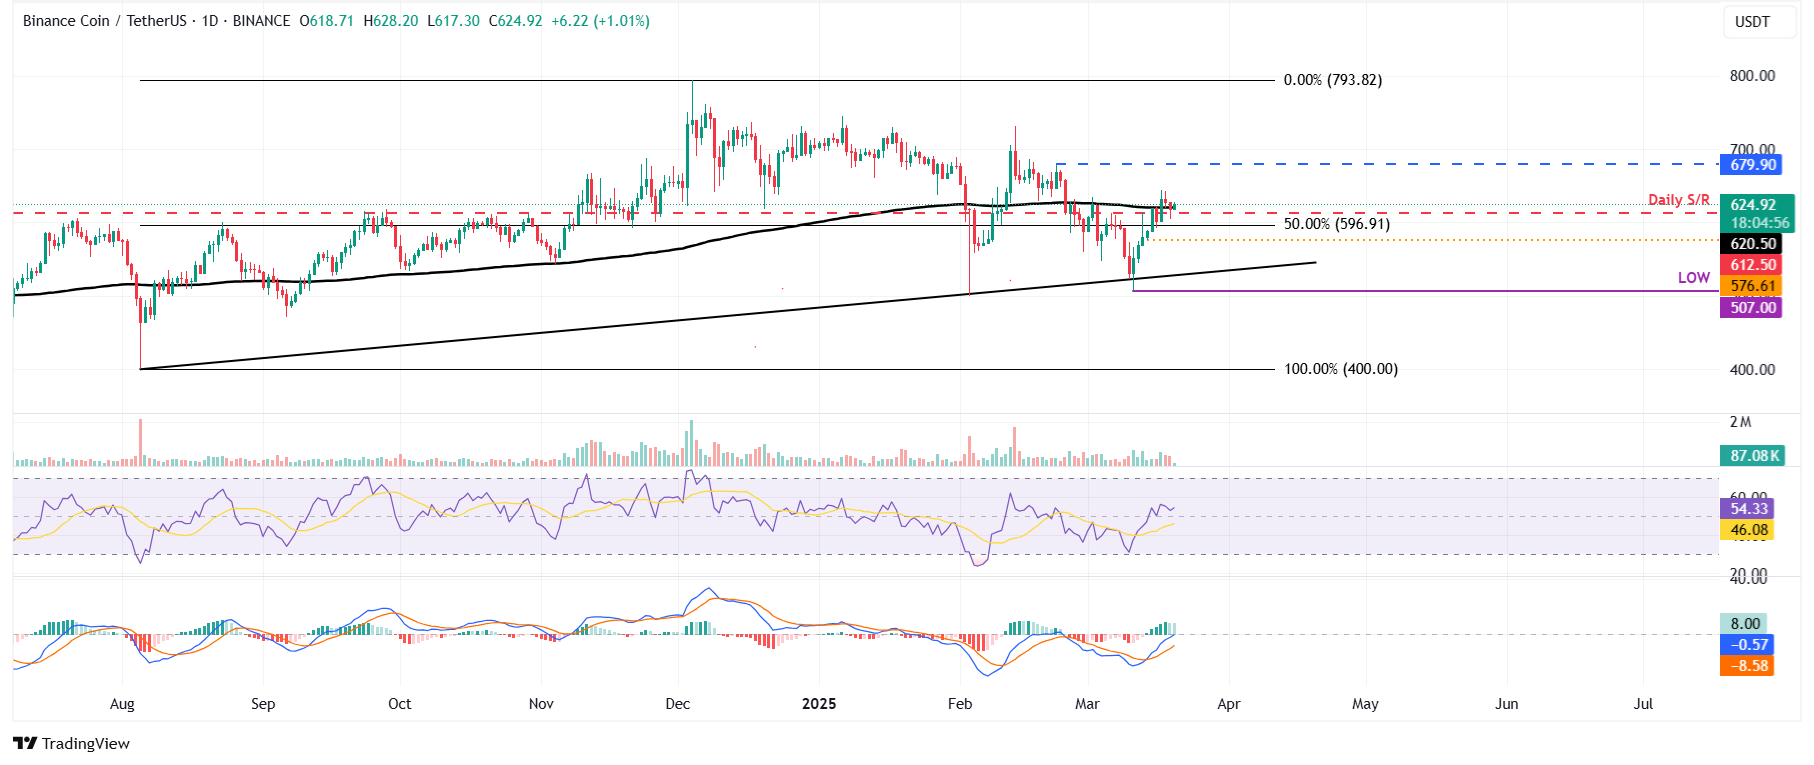
BNB/USDT daily chart
However, the bullish thesis will be invalidated if BNB breaks below its daily support at $612.50 and closes below $576.61 (March 14 low). This development would extend the price decline to retest its March 11 low of $507.
추천 기사


