

Bitcoin Weekly Forecast: Further upside likely after hitting new all-time high
- Bitcoin hit a fresh high of $76,849 on Thursday as crypto-friendly candidate Donald Trump won the US presidential election.
- Institutional demand returned with the highest single-day inflow on Thursday since the ETFs’ launch in January.
- Federal Reserve reduces interest rates by 25 basis points on Thursday, favoring BTC bulls.
Bitcoin (BTC) surged more than 10% this week, hitting a new high of $76,849 on Thursday, buoyed by the crypto-friendly candidate Donald Trump’s victory in the US presidential election.
Institutional demand returned this week, with the highest single-day inflow into the US spot Bitcoin Exchange Traded Funds (ETFs), of over $1.30 billion on Thursday, since its launch in January. Additionally, the US Federal Reserve (Fed) reduced interest rate by 25 basis points (bps) on Thursday, favoring BTC bulls and hinting at a rally continuation.
Donald Trump’s victory push BTC to a new all-time high
Bitcoin surged over 10% this week, hitting a new high of $76,849 on Thursday. This fueled investor optimism as the largest cryptocurrency by market capitalization entered price discovery mode. The rally has been largely attributed to Donald Trump’s decisive victory in the US presidential election. His pro-Bitcoin stance and proposed policies — such as eliminating taxes on Bitcoin transactions and creating a strategic reserve – have sparked bullish sentiment in the crypto community.
“BTC has now navigated three election cycles since its inception in 2009, each followed by rallies to new highs, with prices never dipping back to pre-election levels. We expect this bullish momentum to hold strong as we head into 2025.”, says QCP Capital’s analyst.
Bitcoin’s institutional demand is back on the rise
Institutional demand for Bitcoin rebounded on Wednesday, with US spot ETFs seeing an inflow of $621.90 million, according to Coinglass data, following a period of de-risking ahead of the US presidential election. Thursday marked the highest single-day inflow of $1.36 billion since the ETFs’ launch in January, bringing the total net inflow for the week to $1.32 billion. If this inflow trend persists or accelerates, it could provide additional momentum to the ongoing Bitcoin price rally.
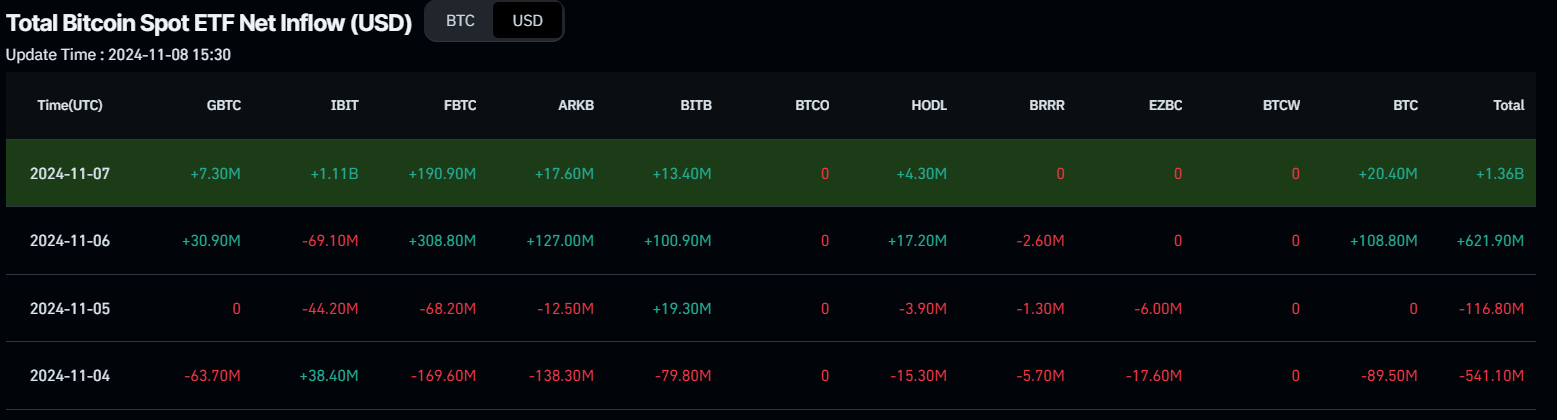
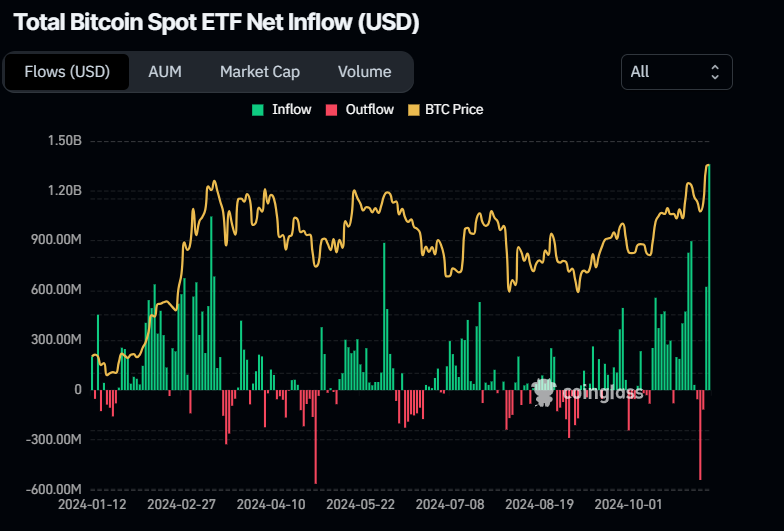
Total Bitcoin Spot ETF Net Inflow chart. Source: Coinglass
Moreover, Glassnode weekly reports highlight that capital inflow continues to grow, signaling a persistent new demand.
Bitcoin Realized Cap has increased by 3.8% over the last 30 days, one of the highest inflow levels since January 2023. It is currently trading at an all-time high (ATH) value of $656 billion, supported by a net 30-day capital inflow of $2.5 billion, as shown in the graph below.
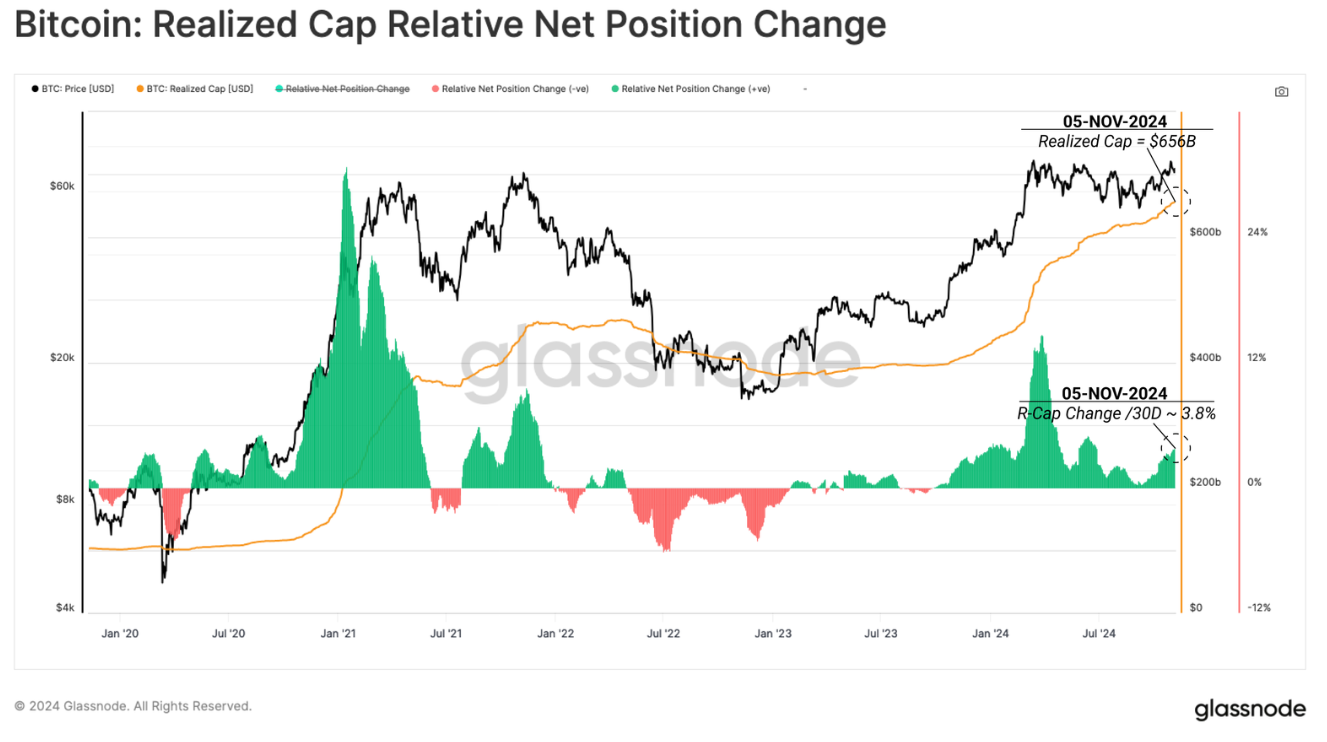
Bitcoin: Realized Cap chart. Source: Glassnode
Fed interest rate cut favors BTC bulls
The Federal Reserve reduced interest rates by 25 basis points on Thursday, a decision intended to maintain flexibility as officials navigate a slowing labor market and decrease inflation rates. This cut brings the benchmark rate to the 4.50%-4.75% range, following a 50 bps cut earlier in September.
Bitcoin and the crypto market have historically reacted positively to low interest-rate environments. Lower borrowing costs generally provide more purchasing power for investors, who would invest their money into assets rather than keeping it in banks, resulting in price surges for cryptocurrencies like Bitcoin.
How high can Bitcoin go?
Bitcoin’s weekly chart shows that the biggest crypto asset by market capitalization broke above the downward-slopping parallel channel pattern and successfully retested the breakout level at around $67,800 in mid-October. BTC rallied but was rejected around its all-time high of $73,777 last week. As of this week, it continues to rally, breaking above its previous ATH and forming a new one at $76,849.
If BTC continues to rally, the pattern’s technical target (obtained by measuring the distance between the two trendlines and extrapolating it higher) projects a new ATH of $78,955.
The Relative Strength Index (RSI) momentum indicator on the weekly chart trades at 64, above its neutral level of 50 and still far below overbought conditions, suggesting bullish momentum is gaining traction.
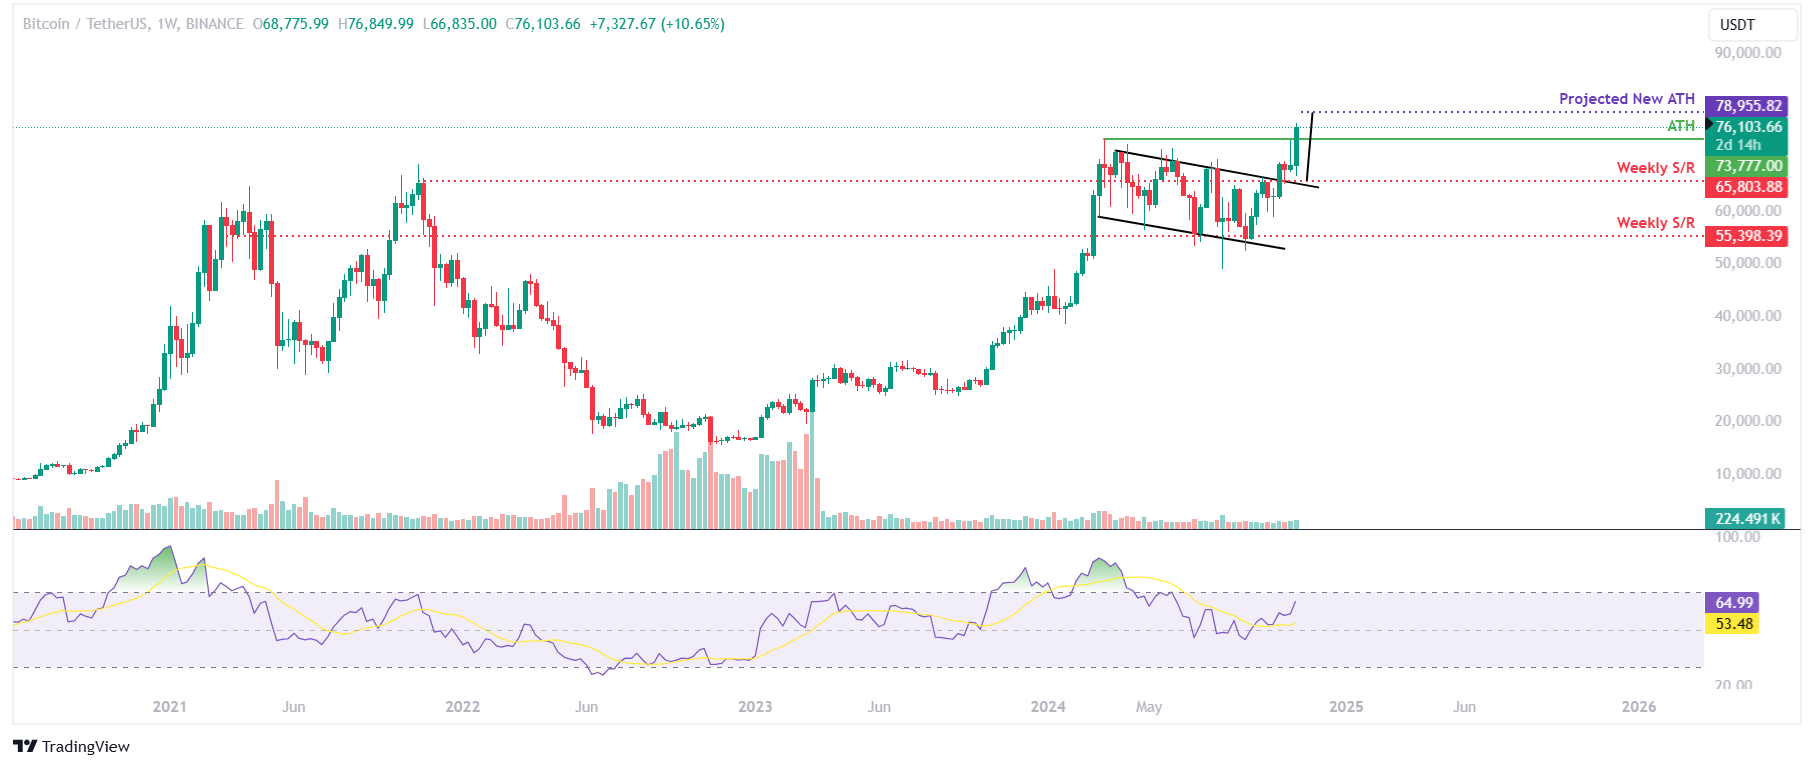
BTC/USDT weekly chart
The daily chart also shows that bulls are in control, hinting at a further rally ahead. Bitcoin price broke above its previous ATH of $73,777, seen in March, and touched a fresh all-time high of $76,849. At the time of writing on Friday, it trades at around $76,000.
If Bitcoin continues its upward momentum, it may set the stage for a potential move toward the 141.40% Fibonacci extension level (drawn from July’s high of $70,079 to August’s low of $49,072) at $78,777, which closely aligns with the technical target of the downward-sloping parallel channel pattern around $78,955 seen on the weekly chart.
The Moving Average Convergence Divergence (MACD) indicator further supports Bitcoin’s rise, signaling a bullish crossover on Wednesday’s daily chart. The MACD line (blue line) moved above the signal line (yellow line), giving a buy signal. However, the Relative Strength Index (RSI) stands at 70, around its overbought level and pointing downwards. Traders should be cautious because the chances of a price pullback increase if the RSI falls from the overbought level.
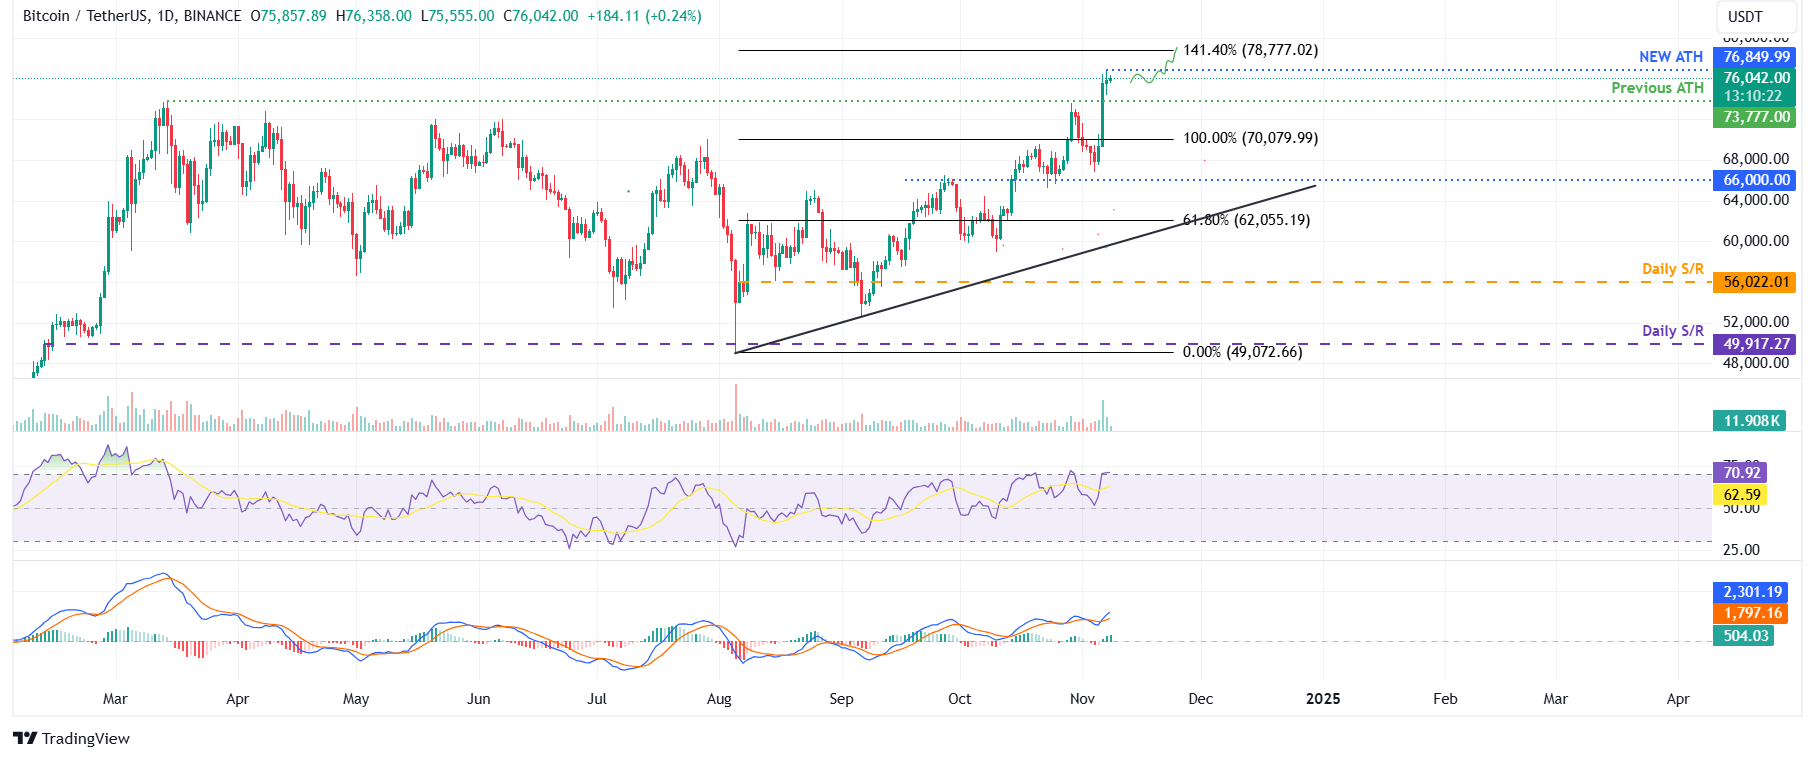
BTC/USDT daily chart
If BTC fails to maintain its upward momentum and starts a retracement, closing below $73,777, it could decline further to retest its psychologically important level of $70,000.
Bitcoin, altcoins, stablecoins FAQs
Bitcoin is the largest cryptocurrency by market capitalization, a virtual currency designed to serve as money. This form of payment cannot be controlled by any one person, group, or entity, which eliminates the need for third-party participation during financial transactions.
Altcoins are any cryptocurrency apart from Bitcoin, but some also regard Ethereum as a non-altcoin because it is from these two cryptocurrencies that forking happens. If this is true, then Litecoin is the first altcoin, forked from the Bitcoin protocol and, therefore, an “improved” version of it.
Stablecoins are cryptocurrencies designed to have a stable price, with their value backed by a reserve of the asset it represents. To achieve this, the value of any one stablecoin is pegged to a commodity or financial instrument, such as the US Dollar (USD), with its supply regulated by an algorithm or demand. The main goal of stablecoins is to provide an on/off-ramp for investors willing to trade and invest in cryptocurrencies. Stablecoins also allow investors to store value since cryptocurrencies, in general, are subject to volatility.
Bitcoin dominance is the ratio of Bitcoin's market capitalization to the total market capitalization of all cryptocurrencies combined. It provides a clear picture of Bitcoin’s interest among investors. A high BTC dominance typically happens before and during a bull run, in which investors resort to investing in relatively stable and high market capitalization cryptocurrency like Bitcoin. A drop in BTC dominance usually means that investors are moving their capital and/or profits to altcoins in a quest for higher returns, which usually triggers an explosion of altcoin rallies.
추천 기사


