

Bitcoin Price Forecast: BTC eyes return to all-time highs
Bitcoin price today: $65,975
- Bitcoin price gains 5% on Monday as data shows demand for BTC growing at fast pace since April.
- BTC Spot ETFs noted $257 million of inflows on October 14.
- Bitcoin trades under $66,000, less than 12% away from the all-time high of $73,777.
- BTC needs to close the week above $66,849 to break to the upside of the descending channel.
Bitcoin (BTC) trades close to $66,000 on Monday. The largest asset by market capitalization has noted a steady increase in its demand among traders since April 2024, according to data from crypto intelligence tracker CryptoQuant.
BTC is 12% away from its all-time high. The asset needs to close above a key resistance at $66,849 to confirm a bullish breakout from the descending channel pattern on the weekly time frame. Once the asset breaks out, BTC could attempt a return to the all-time high at $73,777.
Bitcoin price could return to all-time high for these three reasons
Bitcoin on-chain data from crypto intelligence tracker Santiment shows that retail investors and small whales holding between 10 and 1,000 BTC have consistently accumulated since October 1. In the same time period, large wallet investors and entities have shed their BTC holdings.
Consistent demand from retail traders could generate buying pressure across exchange platforms and fuel the bullish thesis for Bitcoin.
 [00.28.57, 15 Oct, 2024]-638645306902581305.png)
Bitcoin holdings of different cohorts of holders
CryptoQuant reported that there has been a spike in BTC demand, growing at the fastest monthly pace since April 2024. This fuels the potential for gains in BTC price. The apparent demand chart shows how demand increased in October, reaching its highest level in six months.
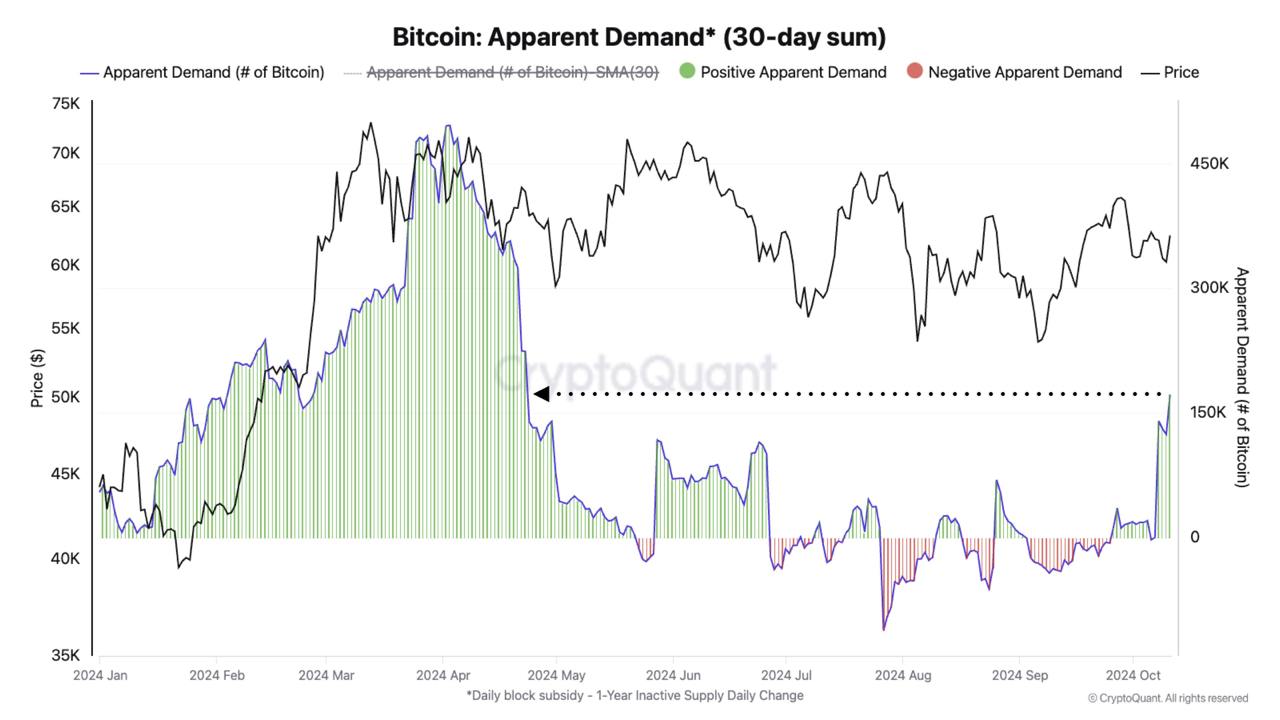
Bitcoin apparent demand on CryptoQuant
Bitcoin price forecast: BTC’s return to all-time high likely
Bitcoin formed a descending channel on the weekly time frame. The largest asset by market capitalization needs to close above resistance at $66,849, the upper boundary of the channel, to confirm a bullish breakout from the channel.
The midpoint at $60,000 marks a key support level for Bitcoin. The Moving Average Convergence Divergence (MACD) indicator shows consecutively smaller red histogram bars under the neutral line, meaning underlying negative momentum in BTC is likely waning. Traders need to keep their eyes peeled for a crossover of the MACD line above the signal line as this confirms a trend reversal.
The Relative Strength Index (RSI) reads 56, above the neutral level and well below the overbought zone at 70.
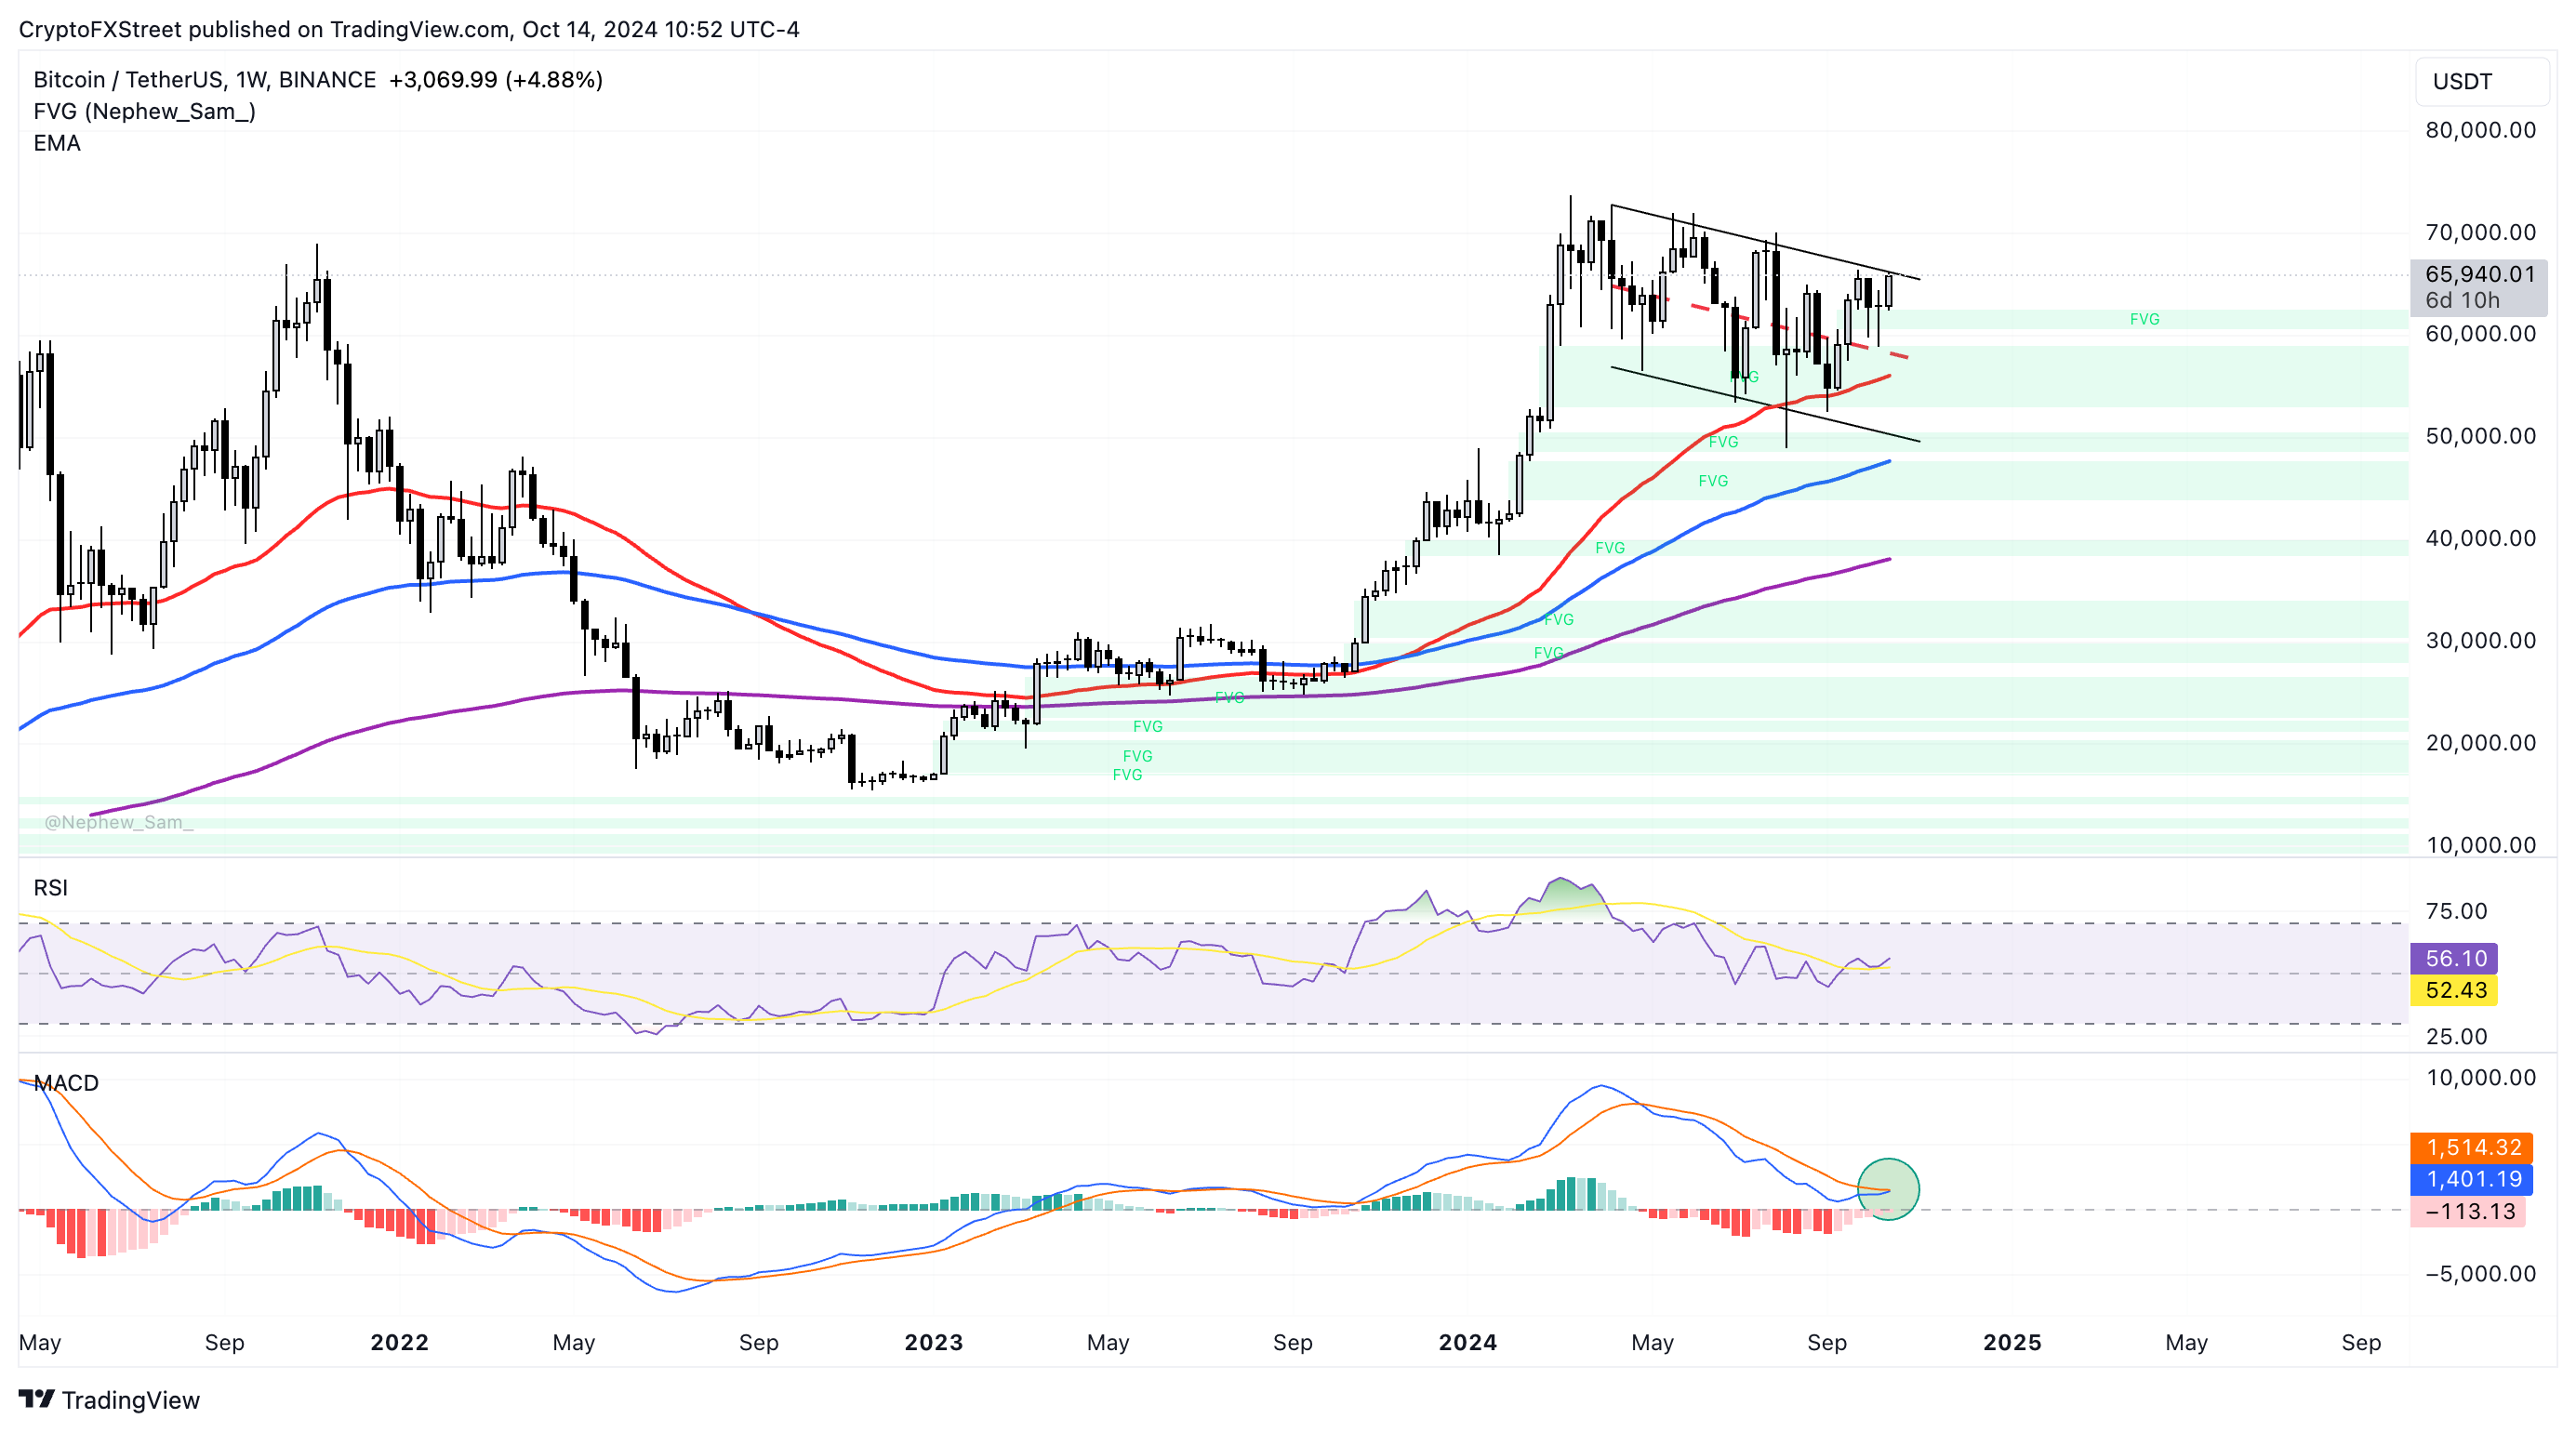
BTC/USDT weekly chart
On the daily time frame, BTC is 11.94% away from its all-time high. The asset faces resistance at two key levels, $70,011 and $66,849. Both these levels have acted as key resistance for BTC for nearly six months now.
MACD shows there is underlying positive momentum in BTC on the daily time frame, and RSI is at 63, above the neutral level of 50.
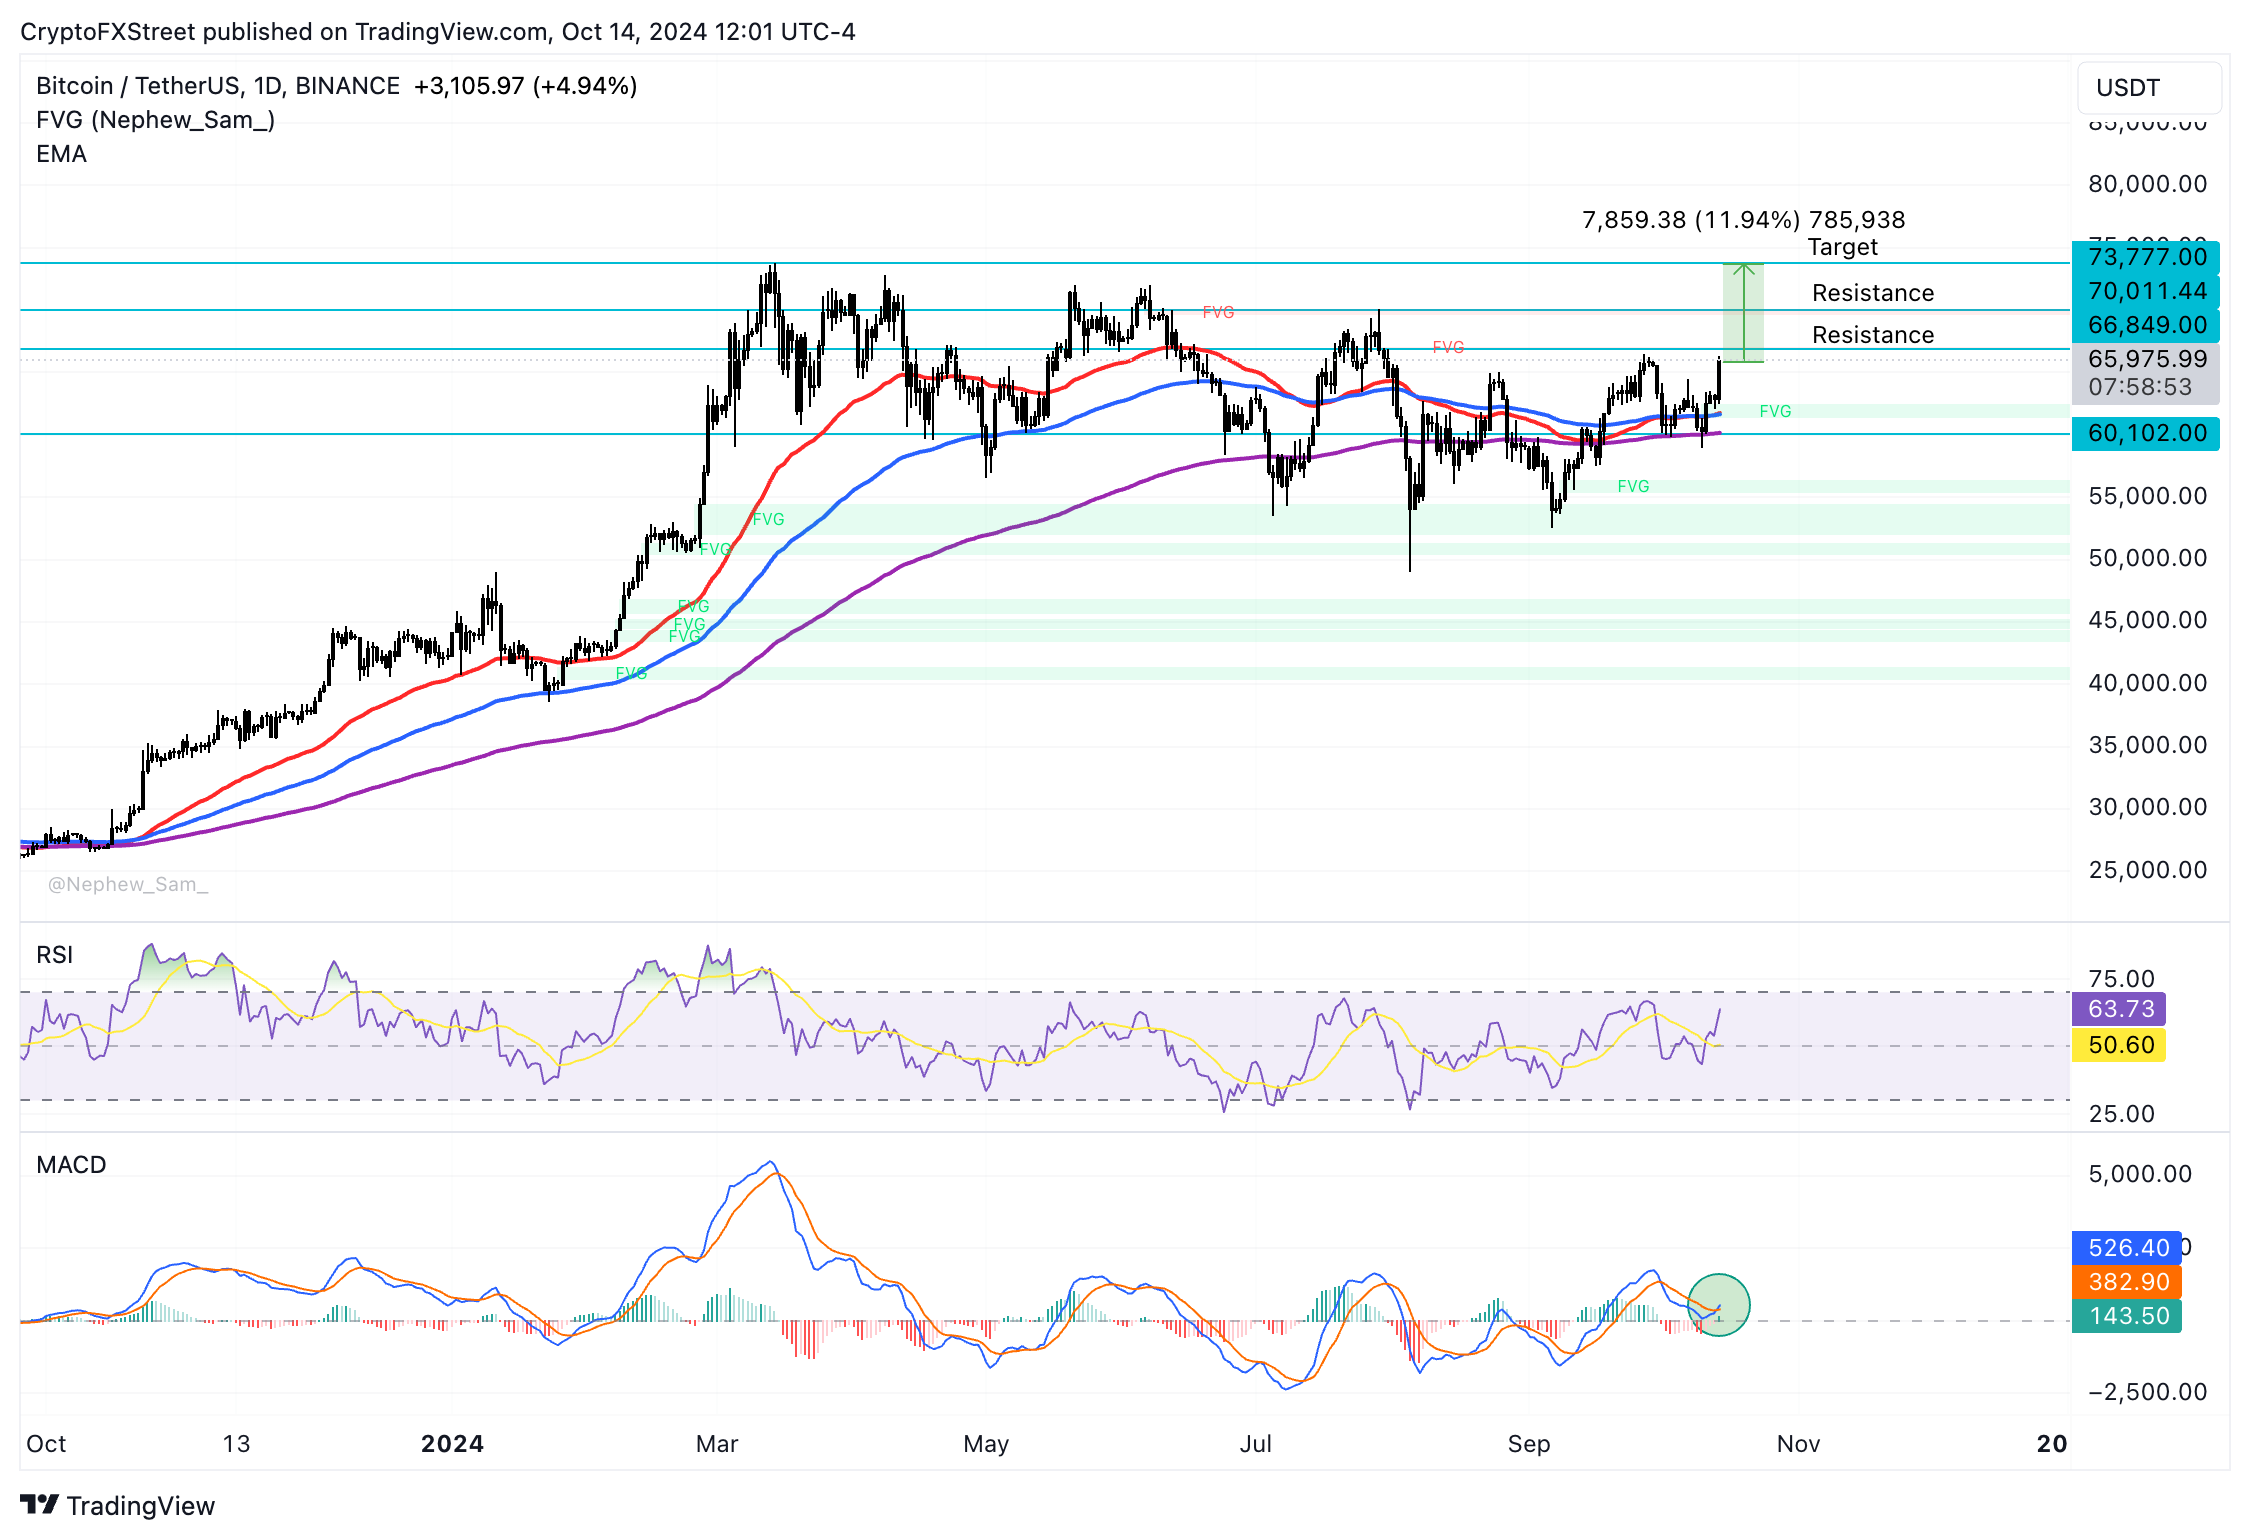
BTC/USDT daily chart
If Bitcoin fails to close above the October 12 low of $62,457, it could invalidate the bullish thesis for BTC. The asset could collect liquidity in the Fair Value Gap (FVG) between $61,321 and $62,457.
Bitcoin, altcoins, stablecoins FAQs
Bitcoin is the largest cryptocurrency by market capitalization, a virtual currency designed to serve as money. This form of payment cannot be controlled by any one person, group, or entity, which eliminates the need for third-party participation during financial transactions.
Altcoins are any cryptocurrency apart from Bitcoin, but some also regard Ethereum as a non-altcoin because it is from these two cryptocurrencies that forking happens. If this is true, then Litecoin is the first altcoin, forked from the Bitcoin protocol and, therefore, an “improved” version of it.
Stablecoins are cryptocurrencies designed to have a stable price, with their value backed by a reserve of the asset it represents. To achieve this, the value of any one stablecoin is pegged to a commodity or financial instrument, such as the US Dollar (USD), with its supply regulated by an algorithm or demand. The main goal of stablecoins is to provide an on/off-ramp for investors willing to trade and invest in cryptocurrencies. Stablecoins also allow investors to store value since cryptocurrencies, in general, are subject to volatility.
Bitcoin dominance is the ratio of Bitcoin's market capitalization to the total market capitalization of all cryptocurrencies combined. It provides a clear picture of Bitcoin’s interest among investors. A high BTC dominance typically happens before and during a bull run, in which investors resort to investing in relatively stable and high market capitalization cryptocurrency like Bitcoin. A drop in BTC dominance usually means that investors are moving their capital and/or profits to altcoins in a quest for higher returns, which usually triggers an explosion of altcoin rallies.
추천 기사


