

Bitcoin Weekly Forecast: Will BTC decline further?
- Bitcoin price extends its decline for a second consecutive week until Friday after rejection from a key resistance barrier.
- US spot Bitcoin ETFs posted $103.5 million in inflows until Thursday.
- On-chain data shows some signs of optimism for Bitcoin in the long term.
Bitcoin’s (BTC) price fell over 6% at some point this week until Thursday, extending losses for a second consecutive week, as it faced rejection from a key resistance barrier. However, BTC is slightly recovering on Friday as United States (US) spot Bitcoin Spot Exchange Traded Funds (ETF) recorded over $103 million in inflow through Thursday and on-chain data shows long-term optimism for the biggest crypto asset by market capitalization.
Bitcoin reaction this week
Bitcoin extends its decline so far this week, after declining 4.2% the prior week when it faced its $66,000 psychological level.
Bitcoin declined slightly at the start of the week, a move that could be related to lower inflows into US spot Bitcoin ETFs, which signals lower institutional demand. The fall in institutional demand can be clearly observed by comparing week-on-week inflow data from Coinglass.
From the last week of September to the first week of October, the flow into US spot Bitcoin ETFs decreased from $1.10 billion in inflows to $262.8 million in outflows. Despite lowering institutional demand, Metaplanet Inc., a company publicly listed on the Tokyo Stock Exchange, announced an additional purchase of 108.786 bitcoin on Monday for a total investment of 1 billion yen (approximately $6.7 million).
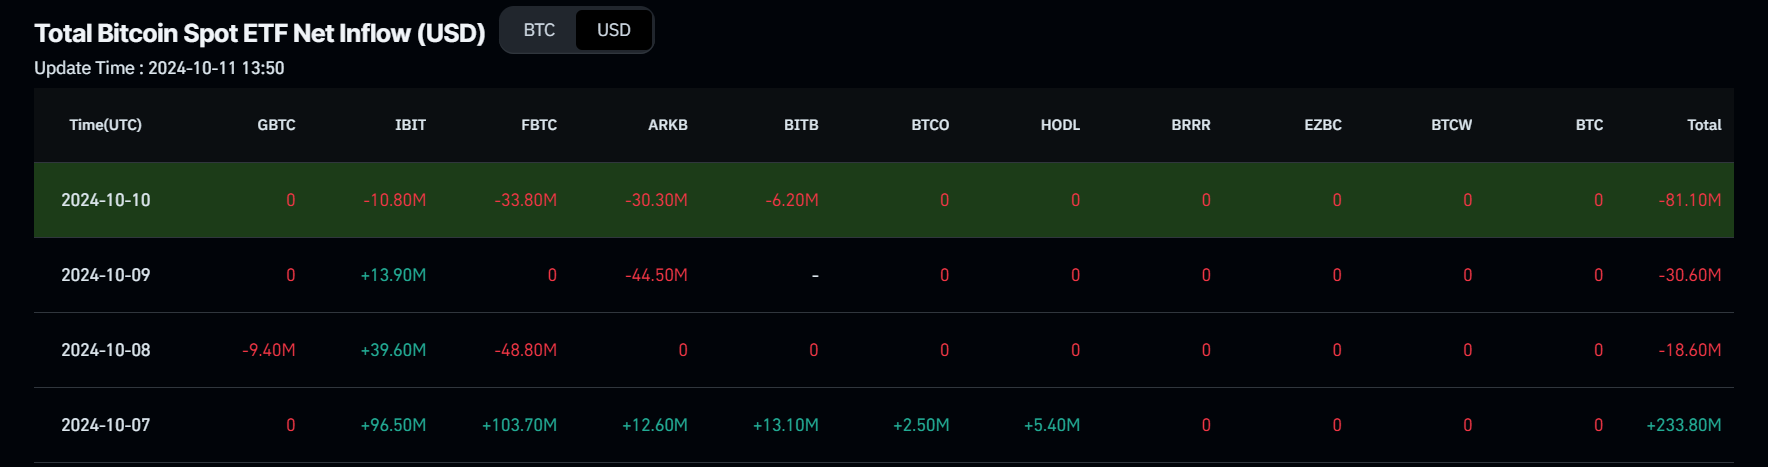
Total Bitcoin Spot ETF Net Inflow chart. Source: Coinglass
On Tuesday, Bitcoin hovered around $62,000. A crypto asset trading firm, QCP Capital, and Bloomberg report highlighted that Chinese investors may have sold USDT to fund stock purchases since the end of September, while BTC stayed flat.
On Wednesday, Bitcoin declined further by over 2.5%, losing its support level of $62,000.
At the same time, Lookonchain data showed that the United States government appears now ready to sell 69,370 BTC — worth $4.33 billion — confiscated from a mysterious SilkRoad user called “Individual X.” This came to light when the US Supreme Court declined to hear Battle Born Investments’ case over the ownership of 69,370 BTC seized from Silk Road and gave the government full control over the seized funds.
If the US government decided to sell the newly acquired Bitcoin, as it did two months ago when it transferred 10,000 BTC, worth $593.5 million, to Coinbase Prime, this event could generate bearish sentiment among traders, potentially contributing to a decline in Bitcoin price. Currently, the US government holds 203,239 BTC worth $12.63 billion, including the newly acquired 69,370 BTC.
The #USgovernment now appears free to sell 69,370 $BTC($4.33B) confiscated from #SilkRoad Individual X.
— Lookonchain (@lookonchain) October 8, 2024
On Oct. 7, the U.S. Supreme Court declined to hear Battle Born Investments' case over the ownership of 69,370 $BTC($4.33B) seized from #SilkRoad, giving the government full… pic.twitter.com/GipGCOpxq9
On Thursday, Bitcoin experienced significant volatility, declining from a high of $61,321 to a low of $58,946 before closing at $60,326. The latest US inflation data for September likely influenced this. The Consumer Price Index (CPI) rose by 2.4% year-over-year in September, decelerating from 2.5% in August but above market expectations of 2.3%. Meanwhile, monthly CPI rose 0.2%, consistent with August’s increase, according to the US Bureau of Labor Statistics (BLS).
According to Eren Sengezer, European Session Lead Analyst at FXStreet, “Following the Fed’s decision to lower the policy rate by 50 basis points (bps) at the September meeting, investors expect the US central bank to dial down the degree of easing by opting for a 25 bps cut at the next meeting”.
If the US interest rate is cut further, it could be a positive sign for risk assets like Bitcoin, as investors would consider investing their money into risk assets for high return rather than keeping it at a lower rate in the bank.
As of Friday, Bitcoin trades slightly above $61,000, recovering part of the initial weekly losses.
Optimistic signs for Bitcoin
New York Digital Investment Group (NYDIG) reported that Bitcoin remains the best-performing asset this year, with a 49.2% year-to-date gain.
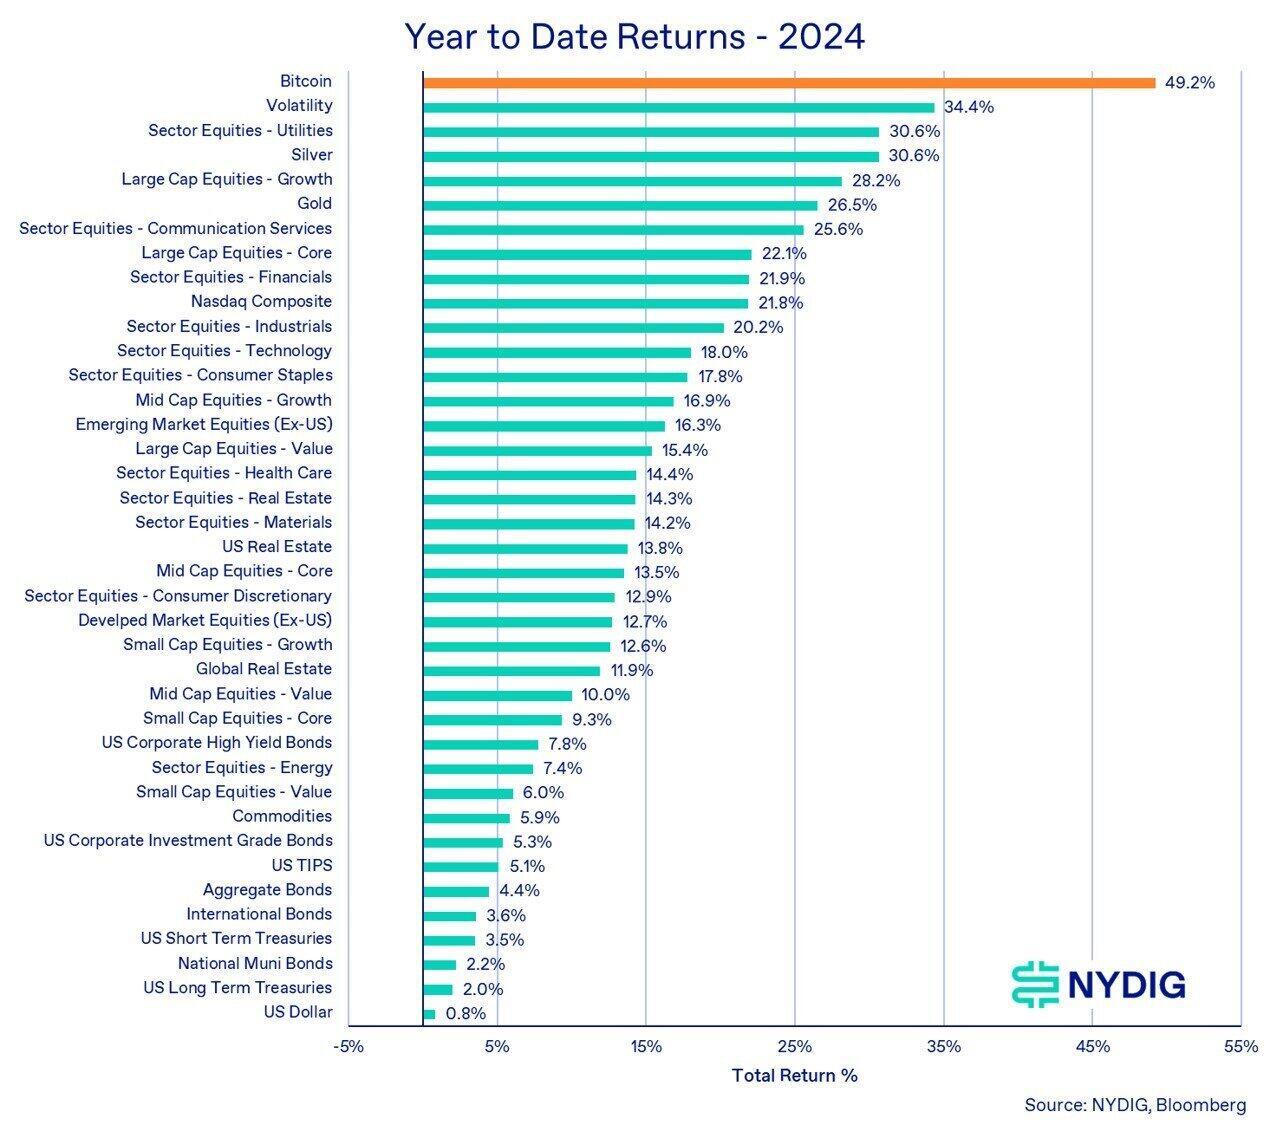
Different types of assets year-to-date returns chart. Source: NYDIG
Additionally, a recent tweet from The Kobeissi Letter explains that the total money supply in the United States (US), the Euro area, Japan, and China has reached a new record of $89.7 trillion, with $7.3 trillion added over the last year.
Diving deep, Bitcoin has a history of rising alongside the M2 money supply, with a lag of 75 to 90 days. Most analysts expect a healthy rally for BTC as 2024 closes out despite any headwinds that may influence economic conditions.
Moreover, market analyst Joe Consorti shows that the M2 trend suggests that Bitcoin could hit $90,000 by the end of 2024. CryptoQuant data also has a similar projection for Bitcoin’s price.
If bitcoin continues following the trajectory of global M2 money supply, it's heading to $90,000 before the end of the year. pic.twitter.com/Kd3YlDT12H
— Joe Consorti ⚡️ (@JoeConsorti) September 30, 2024
Apart from rising M2 Money Supply, the CryptoQuant report highlights how the rising stablecoin market capitalization could also be a positive sign for Bitcoin and other cryptocurrencies.
The report explains that liquidity in the crypto markets, measured by stablecoin value, reached a record high in late September. The total market capitalization of major US Dollar-backed stablecoins is now $169 billion, up $40 billion, or 31%, year-to-date (YTD). Increased stablecoin market capitalization is generally associated with higher Bitcoin and crypto prices, as it provides more liquidity to the markets.
Furthermore, the report mentions that larger balances of stablecoins on exchanges positively correlate with higher Bitcoin and crypto prices. Since January 2023, when the current bull cycle started, the total amount of USDT (ERC20) on exchanges has grown from $9.2 billion to $22.7 billion (+146%). Notably, these balances have grown by 20%, even as Bitcoin’s price has remained flat.
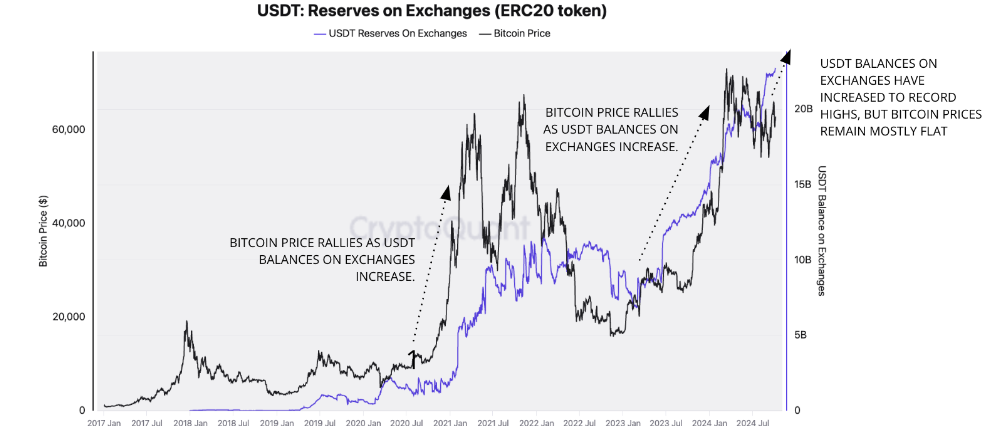
USDT: Reserve on Exchanges chart. Source: CryptoQuant
Bitcoin technical outlook
Bitcoin’s weekly chart shows that the biggest crypto asset by market capitalization faced resistance after testing the descending trendline last week and continued to decline by over 6% so far until Thursday.
This descending trendline (formed by connecting multiple weekly closes since the end of March) roughly coincides with the weekly resistance level of around $65,800, making it a key resistance zone. If BTC continues its decline, it could fall further to retest its next weekly support around $55,400, which roughly coincides with its 50-weekly Exponential Moving Average at $55,615.
The Relative Strength Index (RSI) momentum indicator hovers around its neutral level of 50, indicating indecisiveness among traders. The ongoing decline could continue if the RSI falls decisively below its neutral level.
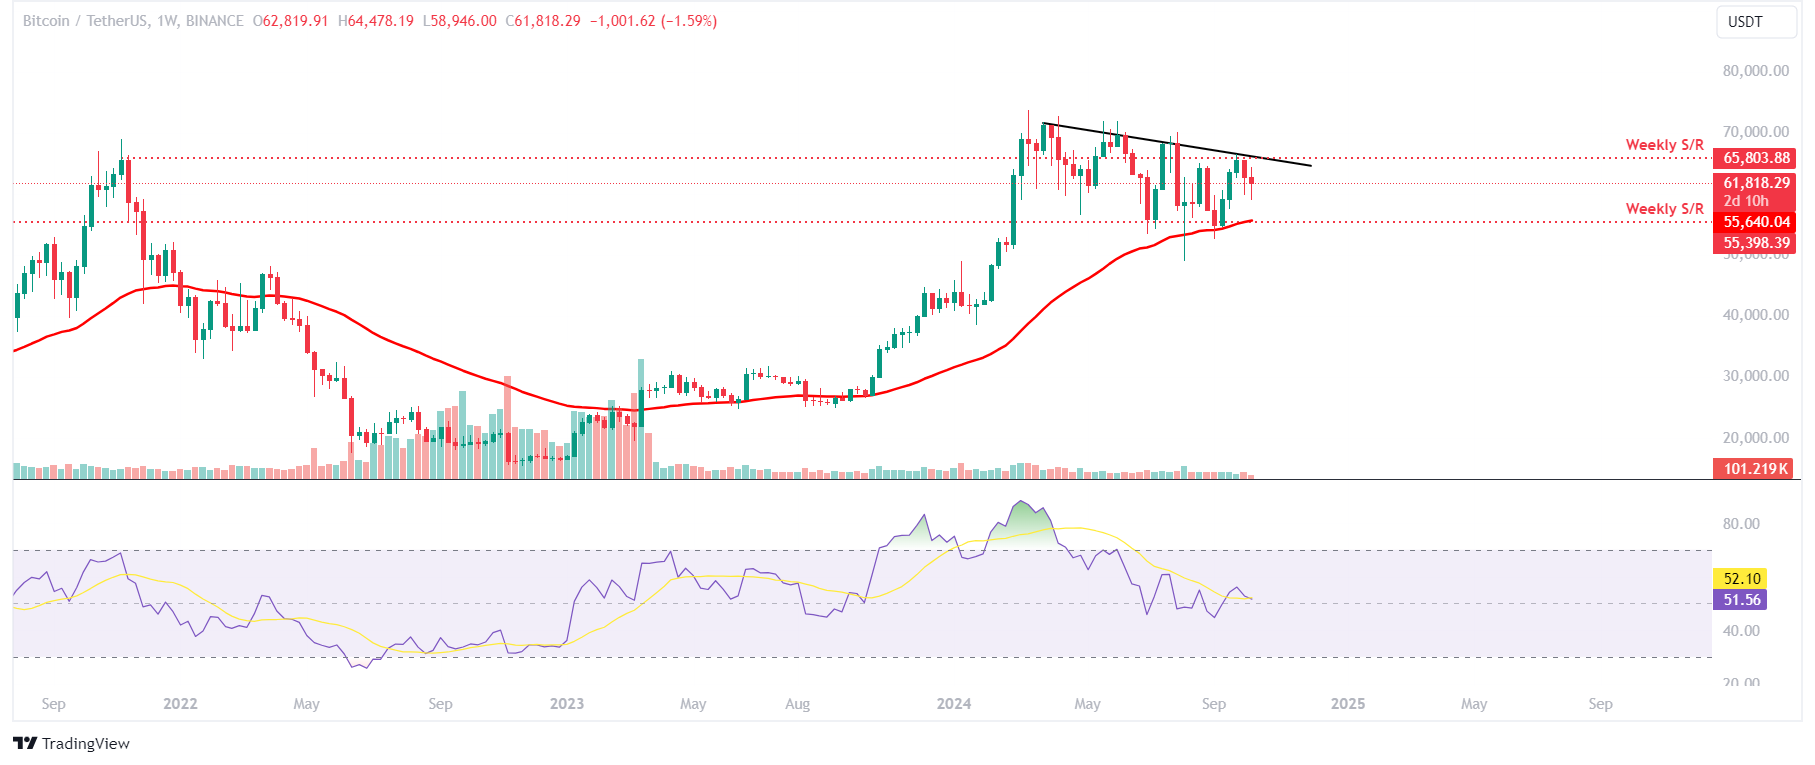
BTC/USDT weekly chart
The daily chart, however, shows some signs of a cooldown from the recent sell-off. On Thursday, BTC found support around its 200-day EMA at $60,036. As of Friday, Bitcoin trades above $61,800.
In case BTC closes below $60,036, it could decline over 4% and retest the September 16 low of $57,493, which roughly coincides with the ascending trendline (drawn by joining multiple lows since August 5).
The RSI technical indicator supports the bearish outlook as trades below its neutral level of 50, suggesting weak momentum, which could further lower Bitcoin’s price.
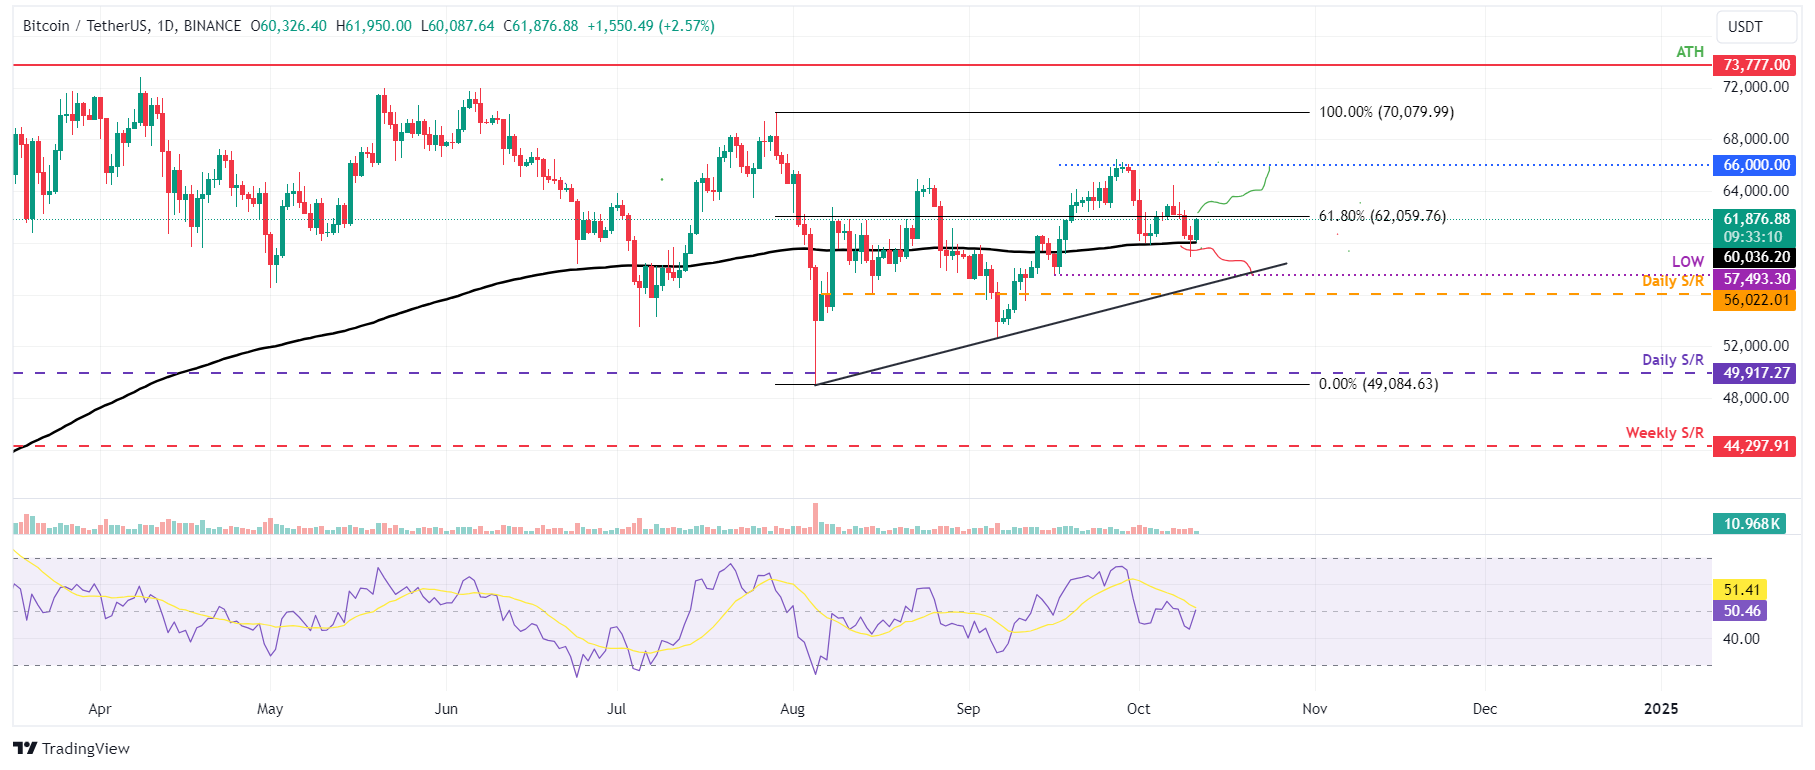
BTC/USDT daily chart
However, if BTC closes above $62,059, the bearish thesis will be invalidated. This scenario extends Bitcoin’s rise to retest its psychologically important $66,000 level.
Bitcoin, altcoins, stablecoins FAQs
Bitcoin is the largest cryptocurrency by market capitalization, a virtual currency designed to serve as money. This form of payment cannot be controlled by any one person, group, or entity, which eliminates the need for third-party participation during financial transactions.
Altcoins are any cryptocurrency apart from Bitcoin, but some also regard Ethereum as a non-altcoin because it is from these two cryptocurrencies that forking happens. If this is true, then Litecoin is the first altcoin, forked from the Bitcoin protocol and, therefore, an “improved” version of it.
Stablecoins are cryptocurrencies designed to have a stable price, with their value backed by a reserve of the asset it represents. To achieve this, the value of any one stablecoin is pegged to a commodity or financial instrument, such as the US Dollar (USD), with its supply regulated by an algorithm or demand. The main goal of stablecoins is to provide an on/off-ramp for investors willing to trade and invest in cryptocurrencies. Stablecoins also allow investors to store value since cryptocurrencies, in general, are subject to volatility.
Bitcoin dominance is the ratio of Bitcoin's market capitalization to the total market capitalization of all cryptocurrencies combined. It provides a clear picture of Bitcoin’s interest among investors. A high BTC dominance typically happens before and during a bull run, in which investors resort to investing in relatively stable and high market capitalization cryptocurrency like Bitcoin. A drop in BTC dominance usually means that investors are moving their capital and/or profits to altcoins in a quest for higher returns, which usually triggers an explosion of altcoin rallies.
추천 기사


