SUI Price Forecast: Technical indicators show bearish divergence

출처 Fxstreet
  • Sui price faced rejection from its all-time high of $2.18 on Monday, hinting at a decline ahead.
  • Technical analysis shows that SUI has formed a bearish divergence on a momentum indicator.
  • A daily candlestick close above $2.18 would invalidate the bearish thesis.

Sui (SUI) price extends its decline on Wednesday after being rejected from its all-time high of $2.18 on Monday. Technical analysis further supports a short-term decline, as the formation of a bearish divergence on a momentum indicator suggests weakening upward momentum.

Sui price shows signs of weakness

Sui price was rejected from its all-time high of $2.18 on Monday after three straight weeks of rallying over 70%, and it declined slightly the next day. At the time of writing on Wednesday, it continues to trade down around $1.90. If this resistance level at $2.18 holds, Sui's price could extend the decline by 27% to tag $1.38, its daily support level.

Moreover, the Relative Strength Index (RSI) indicator supports this bearish thesis in the daily chart. The higher high in SUI’s price formed on Monday does not reflect the RSI lower high for the same period. This development is termed a bearish divergence and often leads to a reversal of the trend or a short-term crash.
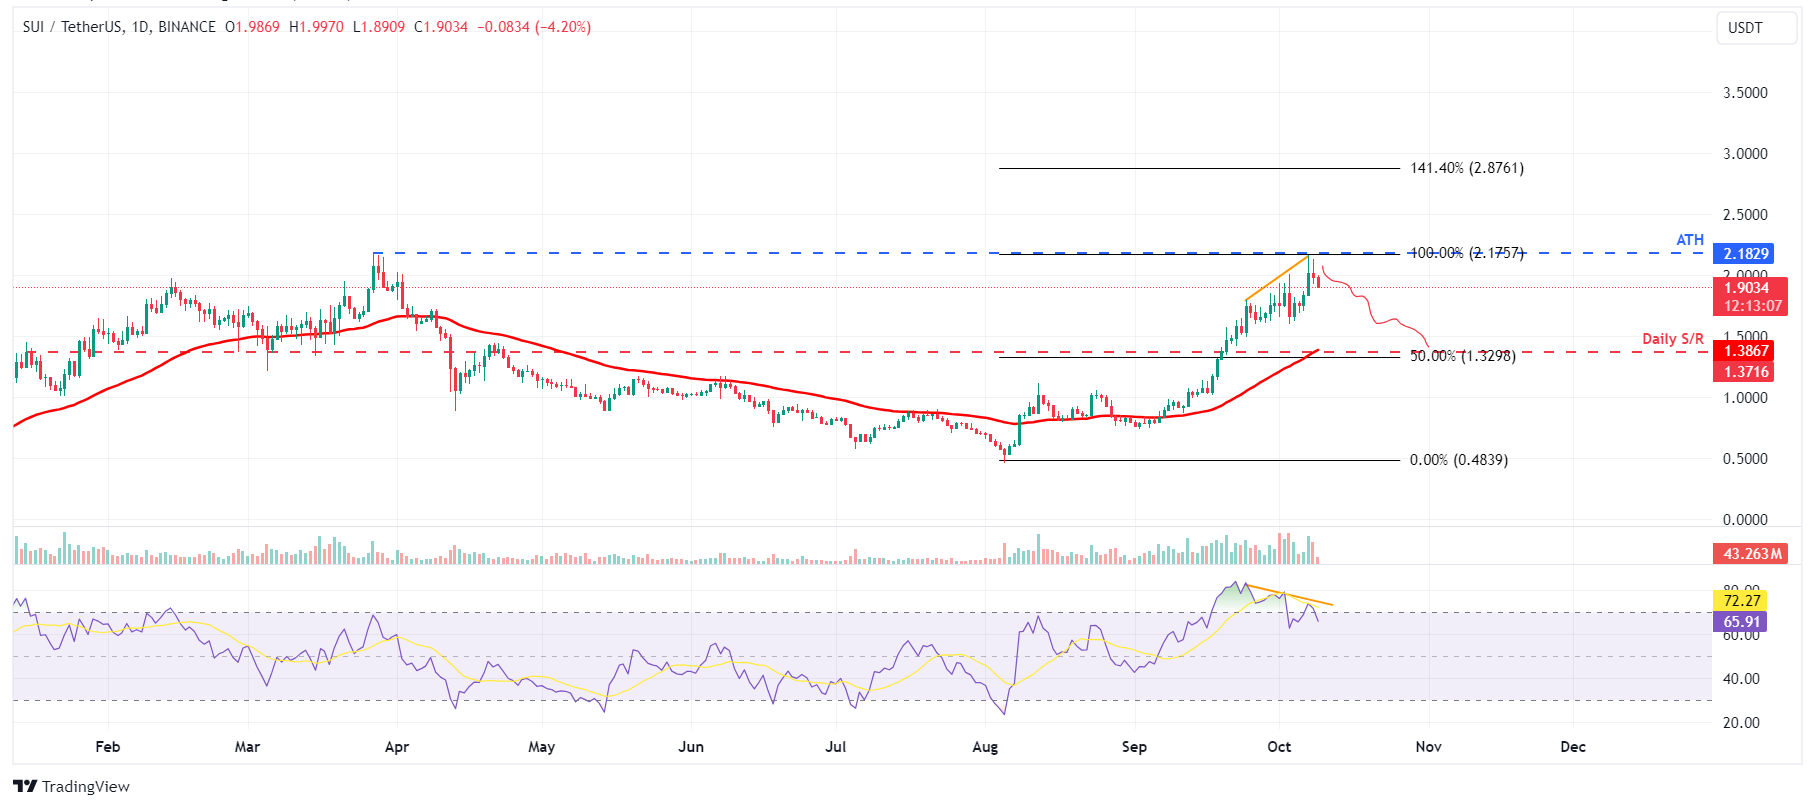
SUI/USDT daily chart

SUI/USDT daily chart

However, the bearish thesis would be invalidated if the SUI price breaks and closes above $2.18. This scenario could lead to a rally in Sui's price to form a new all-time high of $2.87, the 141.40% Fibonacci extension level drawn from an early August low of $0.48 to an early October high of $2.17.

면책 조항: 정보 제공 목적으로만 사용됩니다. 과거 성과가 미래 결과를 보장하지 않습니다.
placeholder
도지코인 가격 전망: 이익 실현 매물 급증… 급락 위험 커져도지코인(DOGE)은 월요일 작성 시점 기준으로 주간 핵심 지지선인 0.18달러 아래에서 등락을 이어가며, 매수 모멘텀이 약화되고 있음을 시사하고 있다.
저자  FXStreet
6 월 16 일 월요일
도지코인(DOGE)은 월요일 작성 시점 기준으로 주간 핵심 지지선인 0.18달러 아래에서 등락을 이어가며, 매수 모멘텀이 약화되고 있음을 시사하고 있다.
placeholder
은 가격 전망: 35.40달러 지지선 위에서는 매수 우위 지속은 가격(XAG/USD)은 목요일 아시아 거래 시간대에 36.55~36.60달러 부근에서 매도 압력을 받으며 전일 강세 흐름 중 일부를 반납했다. 이는 주간 상단 저항선 부근까지의 상승분을 일부 되돌리는 흐름으로 해석된다.
저자  FXStreet
7 월 03 일 목요일
은 가격(XAG/USD)은 목요일 아시아 거래 시간대에 36.55~36.60달러 부근에서 매도 압력을 받으며 전일 강세 흐름 중 일부를 반납했다. 이는 주간 상단 저항선 부근까지의 상승분을 일부 되돌리는 흐름으로 해석된다.
placeholder
스텔라(XLM) 가격 전망: PayPal 스테이블코인 통합 기대감 속 삼각형 패턴 돌파 시도스텔라(XLM)는 금요일 보도 시점 기준으로 약 1% 상승하며, 일요일 5% 급등세에 소폭 상승분을 더했다. 수요일 지지선 반등 이후 약 12% 상승한 XLM은 현재 하락 삼각형 패턴의 저항선 부근에 근접하고 있다.
저자  FXStreet
7 월 07 일 월요일
스텔라(XLM)는 금요일 보도 시점 기준으로 약 1% 상승하며, 일요일 5% 급등세에 소폭 상승분을 더했다. 수요일 지지선 반등 이후 약 12% 상승한 XLM은 현재 하락 삼각형 패턴의 저항선 부근에 근접하고 있다.
placeholder
스텔라(XLM) 가격 전망: TVL 및 스테이블코인 활동 증가 속 XLM 강세 주도스텔라(XLM)는 주중 상승세를 이어가며 현재까지 약 5% 상승, 수요일 기준 0.260달러 부근에서 거래되고 있다. 총예치금(TVL) 사상 최고치 경신과 스테이블코인 활동 증가 등 온체인 데이터가 강세 전망에 힘을 싣고 있다.
저자  FXStreet
7 월 09 일 수요일
스텔라(XLM)는 주중 상승세를 이어가며 현재까지 약 5% 상승, 수요일 기준 0.260달러 부근에서 거래되고 있다. 총예치금(TVL) 사상 최고치 경신과 스테이블코인 활동 증가 등 온체인 데이터가 강세 전망에 힘을 싣고 있다.
placeholder
비트코인, 2025년 들어 세 번째 사상 최고치 경신… 규제 명확성과 국고 수요가 상승세 견인비트코인(BTC)은 수요일 $111,980의 이전 고점을 돌파하며 사상 최고가를 또 한 번 경신, 현재 ‘가격 발견 구간(price discovery)’에 진입했다. 이는 2025년 들어 1월 20일, 5월 22일에 이어 세 번째 최고가 경신 기록이다.
저자  FXStreet
7 월 10 일 목요일
비트코인(BTC)은 수요일 $111,980의 이전 고점을 돌파하며 사상 최고가를 또 한 번 경신, 현재 ‘가격 발견 구간(price discovery)’에 진입했다. 이는 2025년 들어 1월 20일, 5월 22일에 이어 세 번째 최고가 경신 기록이다.
goTop
quote