


Top Altcoins Price Forecast: Ethereum, Ripple, Hyperliquid attempt recovery as bearish risks persist
- Ethereum recovers above $2,500, up nearly 3% on Tuesday after falling over 3.50% the previous day.
- Ripple is up 2% on Tuesday, testing a rising support trendline near $1.33 amid risks of a bearish breakout.
- Hyperliquid hovers above $82, recovering from an intraday low of $79.52 as bearish momentum persists.
Top altcoins, including Ethereum (ETH), Ripple (XRP), and Hyperliquid (HYPE), are trading in the green on Tuesday, after a 4% to 6% decline the previous day. ETH- and HYPE-focused Exchange Traded Funds (ETFs) see persistent selling pressure, with previous week’s outflows extending to Monday, while XRP ETFs remain muted. The technical outlook for ETH, XRP, and HYPE is mixed as the prevailing near-term correction risks continuation.
ETF outflows weigh on Ethereum and Hyperliquid
Ethereum and Hyperliquid are losing institutional confidence in the near term, as persistent ETF outflows signal increased selling pressure from investor redemptions. SoSoValue data shows Ethereum ETFs recorded $85.40 million in outflows on Monday, extending last week’s $542.07 million in redemptions and marking the tenth consecutive day of outflows.
On the other hand, HYPE-focused ETFs saw $2.35 million in outflows on Monday, following $9.43 million in redemptions last week.

Ethereum retests the broken 50-day EMA
Ethereum trades around $2,511 at press time on Tuesday, testing its broken 50-day Exponential Moving Average (EMA) at $2,501. The Major Altcoin holds well above the 200-day EMA at $2,307, suggesting a persistent constructive bias.
Momentum on the daily chart remains weak, with the Moving Average Convergence Divergence (MACD) below its signal line in negative territory, while the Relative Strength Index (RSI) sits at a neutral 44, suggesting that bullish momentum is moderating.
For a sustained recovery, Ethereum must surpass its 50-day EMA at $2,501 and the August 21 high at $2,546, which could open the path toward the September 21 high at $2,807.
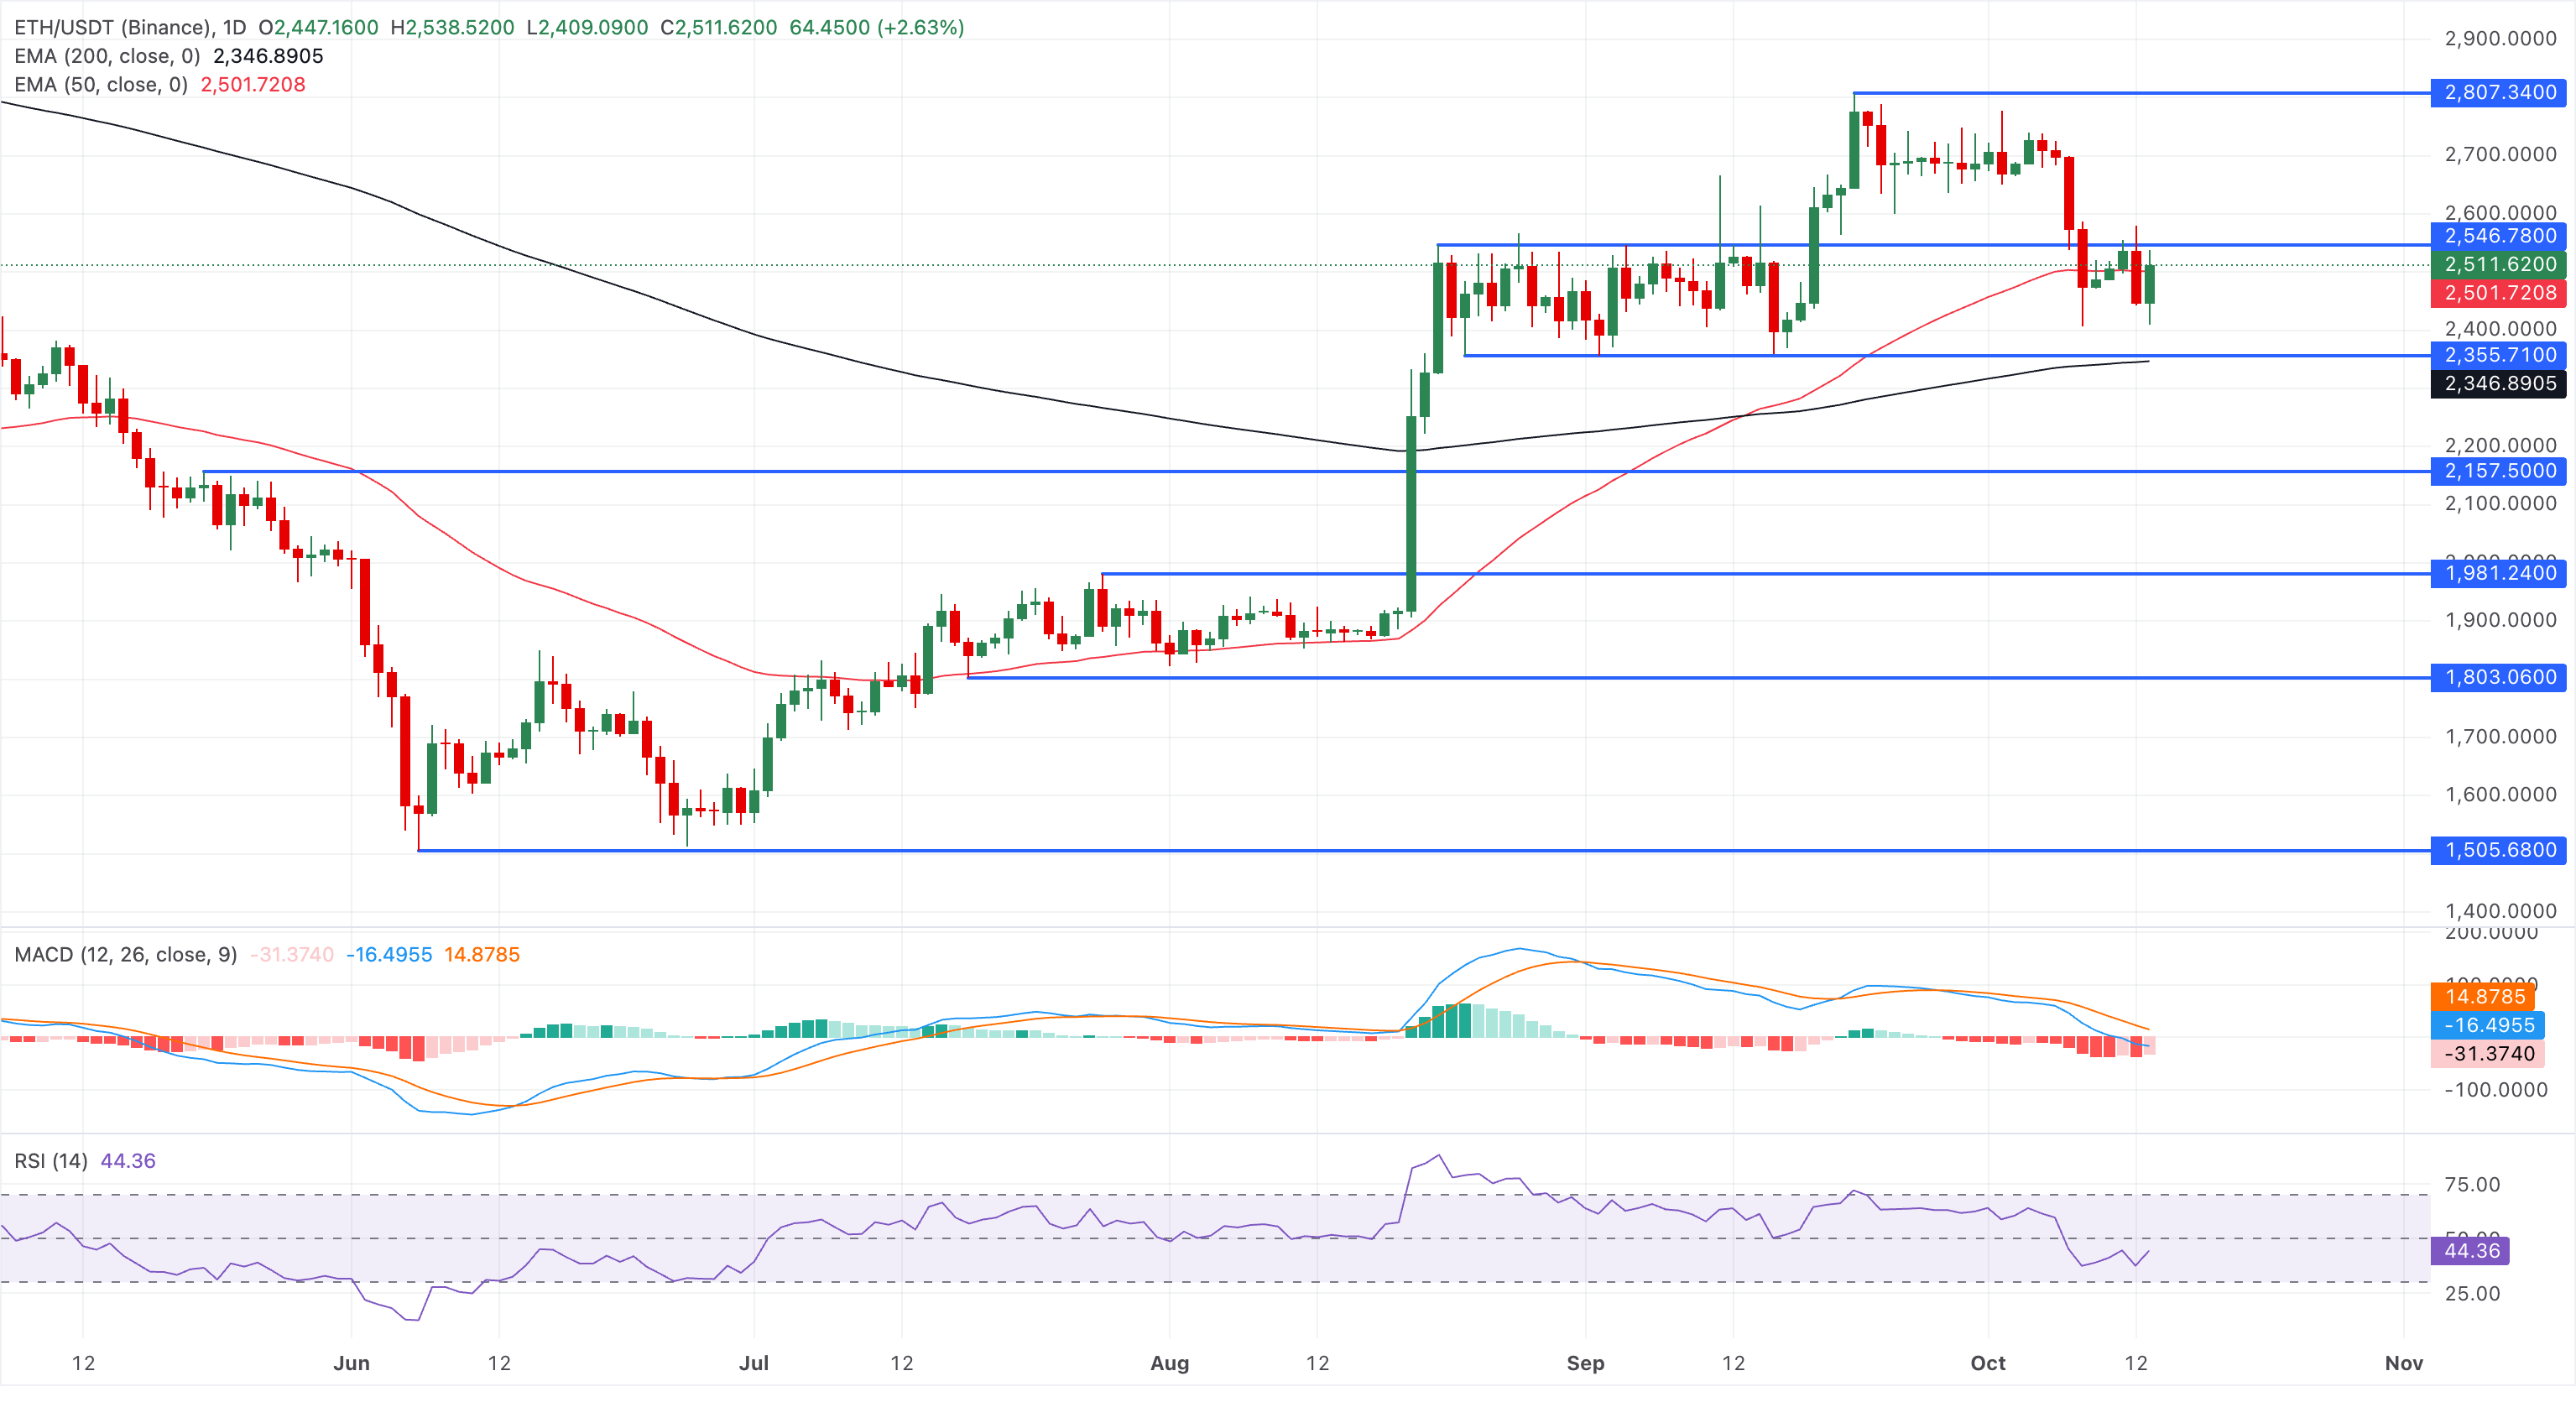
On the downside, immediate support is seen at a structural floor formed by the August 23 low at $2,355 and the 200-day EMA around $2,307.
Ripple risks breaking below a crucial support trendline
Ripple hovers above $1.3600, maintaining a bearish near-term bias as it remains below both the 50- and 200-day EMAs at $1.3959 and $1.3907, respectively. The cross-border remittance token is testing an upward support trendline, with a break near $1.3346.
Momentum indicators on the daily chart remain soft, with the RSI at 41 hovering below the midline and the MACD extending below zero with negative histogram readings, suggesting that selling pressure is still dominant.
The path of least resistance warns of a bearish close below the support trendline near $1.3346, which could extend the decline toward the June 16 high at $1.2560. Any deeper pullbacks could test the June 8 and August 2 highs around $1.1866 and $1.0933, respectively.
Looking up, initial resistance aligns at the 50- and 200-day EMAs around $1.3959 and $1.3907, forming a dense cap that bulls would need to reclaim to ease the current downside tone, ahead of the descending trendline resistance near $1.4502.
Hyperliquid faces downside risk below $80
Hyperliquid trades at $82.56, maintaining a bearish near-term tone as the price holds below the 50-day EMA at $83.72 but remains well above the longer-term 200-day EMA at $65.94. This configuration suggests a corrective phase within a broader uptrend.
Momentum shows a bearish bias on the daily chart, with the MACD stuck below zero and its signal line hinting at lingering downside pressure, while the RSI around 43 reinforces a mildly bearish, rather than oversold, environment.
A bearish close for the day could extend the decline toward the June 1 high of $75.76, followed by the July 15 high of $68.98.
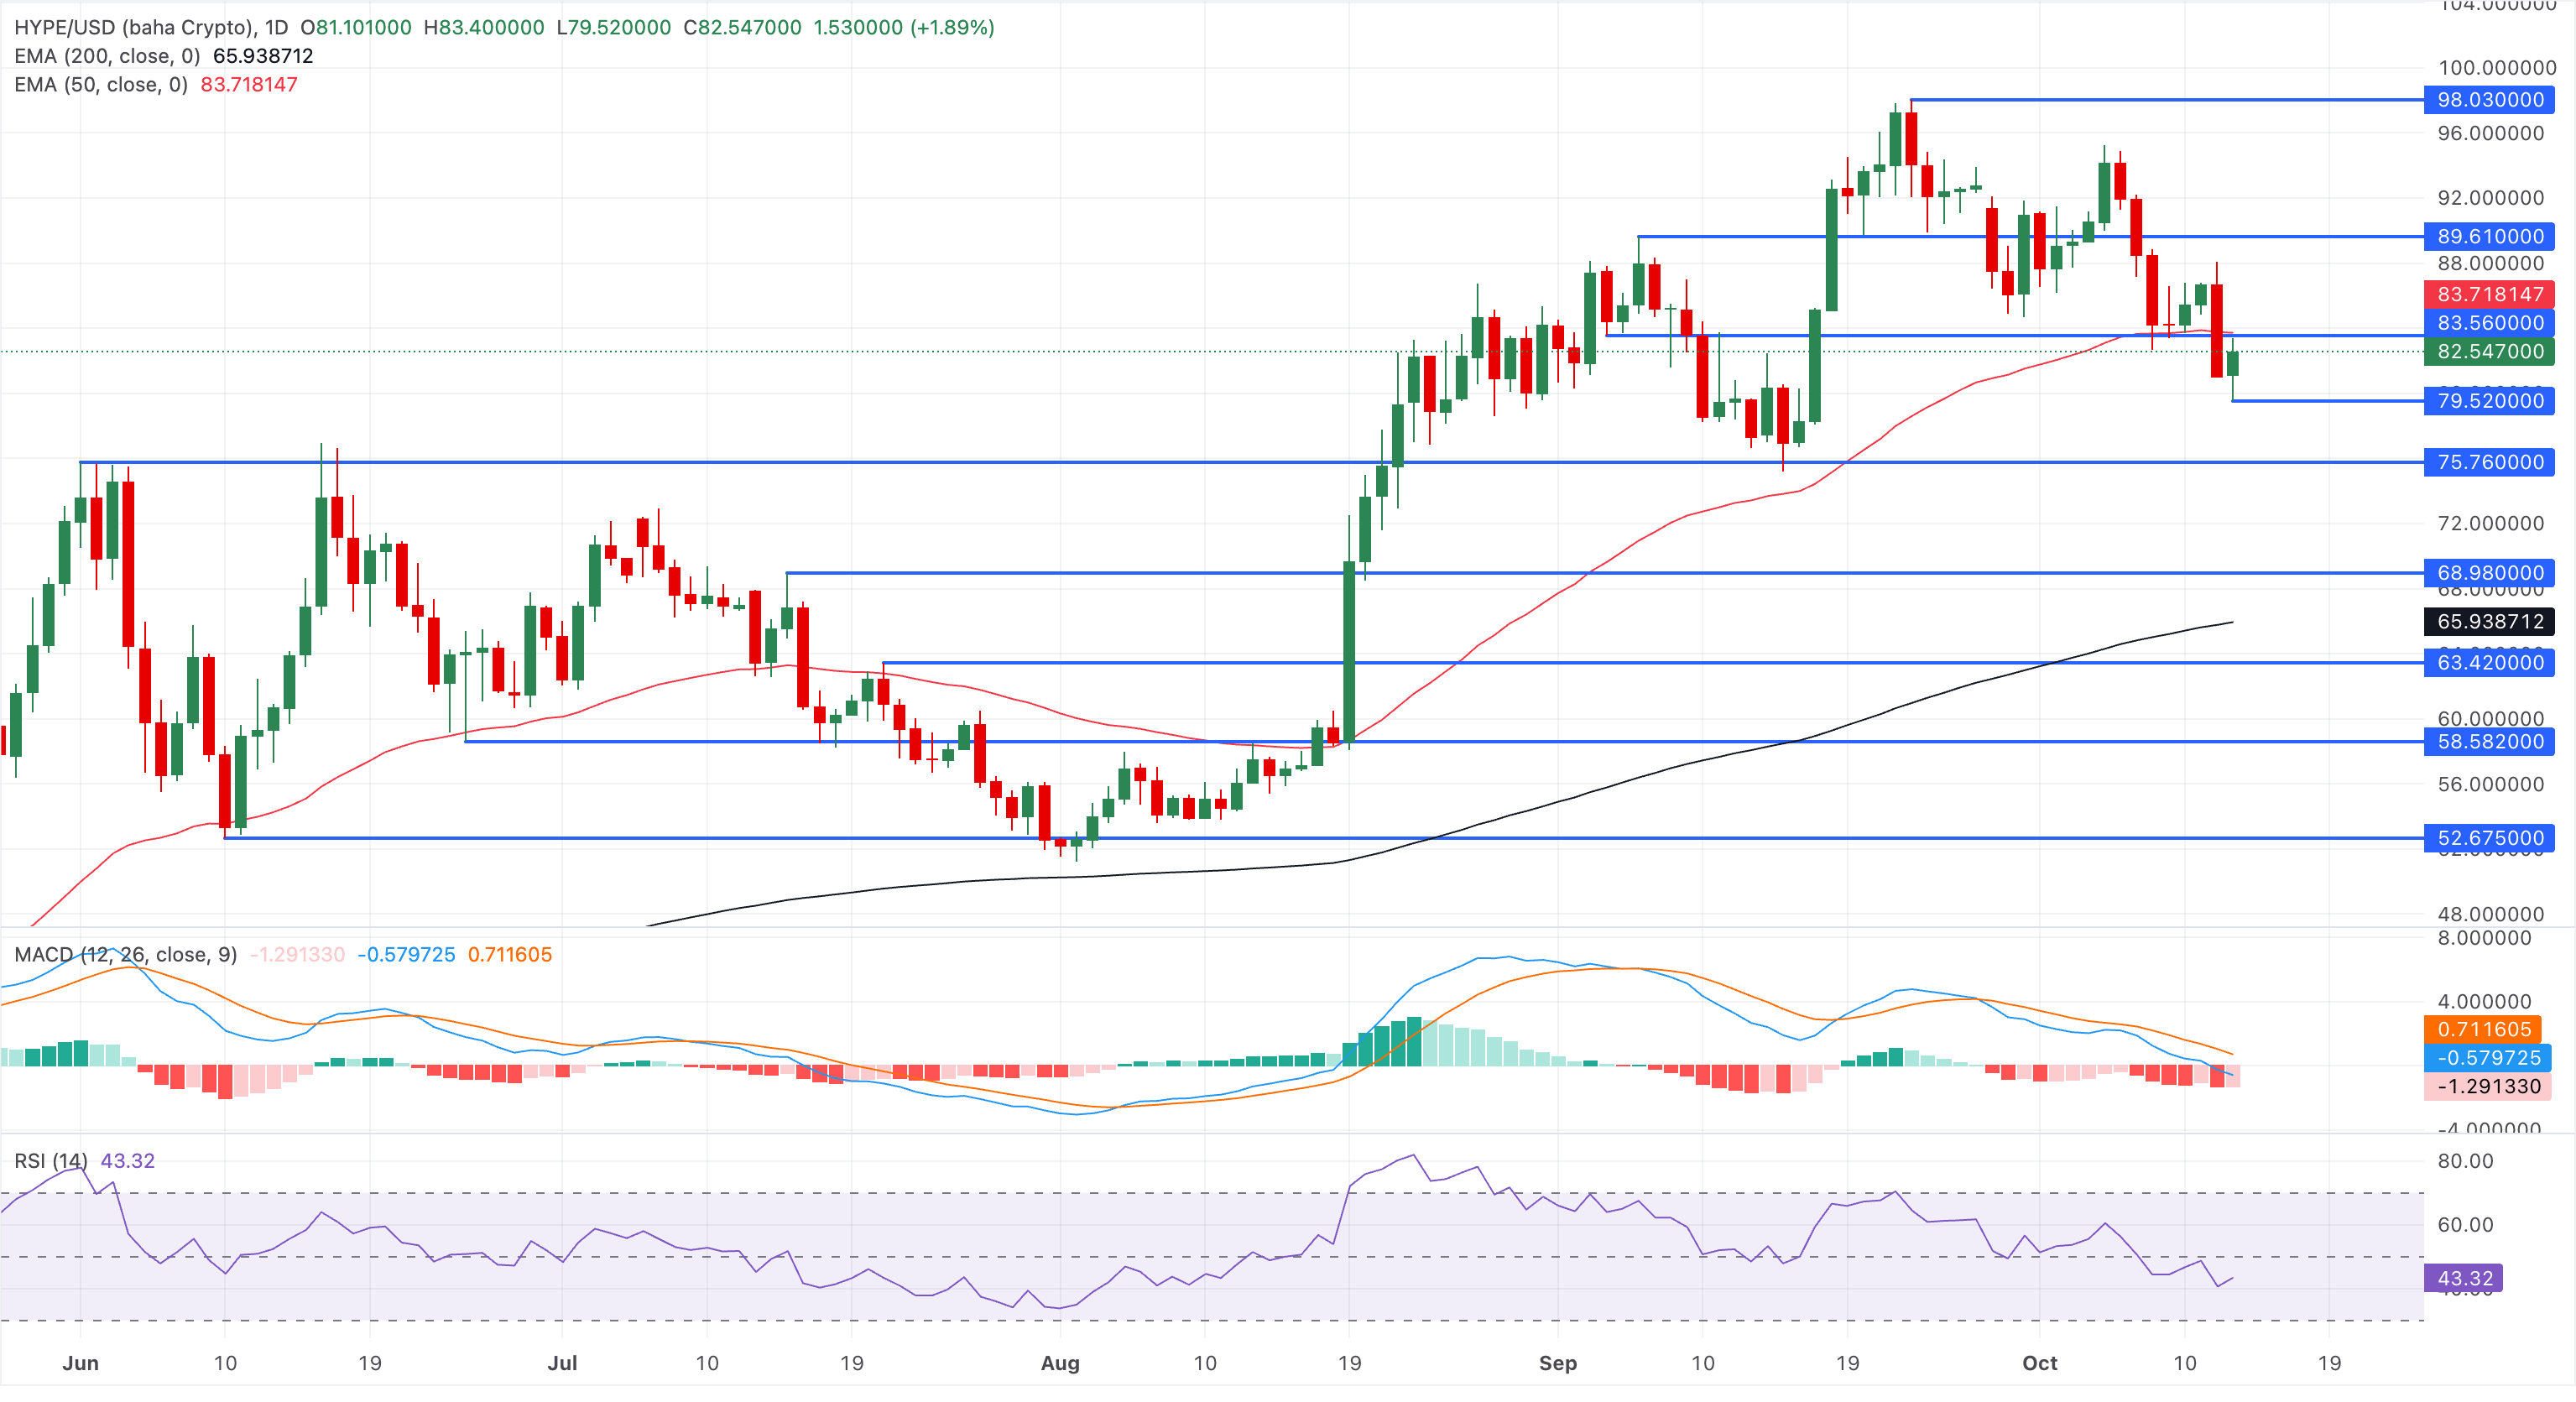
On the topside, initial resistance is at the 50-day EMA at $83.72, and a sustained break above this level would be needed to ease immediate selling pressure and reopen the path toward higher levels.
(The technical analysis of this story was written with the help of an AI tool. Know more.)
추천 기사


