


Bitcoin Weekly Forecast: BTC holds firm, but the $100 Oil threat could change the game
- Bitcoin recovers modestly through Friday, trading near $65,400, holding strong above the 200-week SMA.
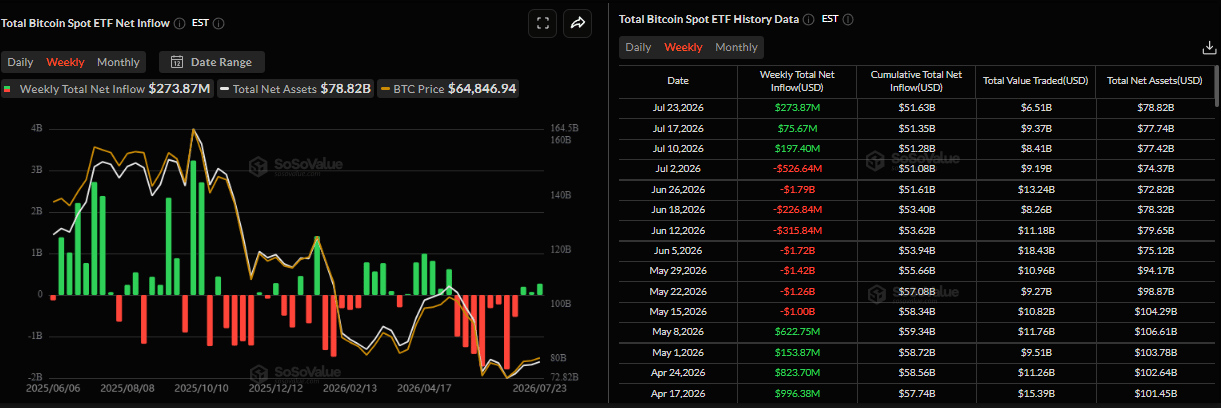
- US-listed spot ETFs recorded inflows of $273.83 million through Thursday, pointing to the third consecutive week of inflows.
- Escalating US-Iran tensions and Donald Trump’s new tariffs continue to dampen risk appetite, limiting BTC’s upside.
Bitcoin (BTC) is modestly recovering, trading at $65,400 on Friday and holding firmly above the key support zone. US-listed spot Bitcoin Exchange Traded Funds (ETFs) supported BTC’s modest recovery as they continued to attract institutional inflows through Thursday, pointing to the third consecutive week of inflows. Despite BTC’s resilience, higher Oil prices, driven by the escalating US-Iran conflict and US President Donald Trump’s new tariffs, have revived inflation concerns, limiting the Crypto King’s upside.
Bitcoin rally stalls as inflation and trade war fears resurface
Bitcoin began the week on a positive note as optimism builds around a potential de-escalation in the Middle East. On Monday, mediators proposed a 10-day ceasefire between the US and Iran, fueling hopes of a peace deal. Amid this optimism, the Crypto King climbed toward its mid-June peak, reaching a daily high of $65,956 on Tuesday. However, the rally lost momentum in the second half of the week, with BTC correcting by 2.46% through Thursday as tensions in the Middle East rose again.
The US military announced that it completed another round of strikes against Iran on Thursday, marking the 13th straight night of operations. The latest attacks come amid a widening regional confrontation, with Iran and its allies launching retaliatory strikes against US-linked military assets in Kuwait, Bahrain and Jordan. In addition, Iran-aligned Houthis extended the Middle East war to a second major shipping chokepoint and struck two Saudi oil tankers in the Red Sea. This exacerbates concerns about energy supply disruptions amid the closure of the Strait of Hormuz, lifting Oil prices, with West Texas Intermediate (WTI) reaching $92.5 per barrel, a fresh high since June 11.
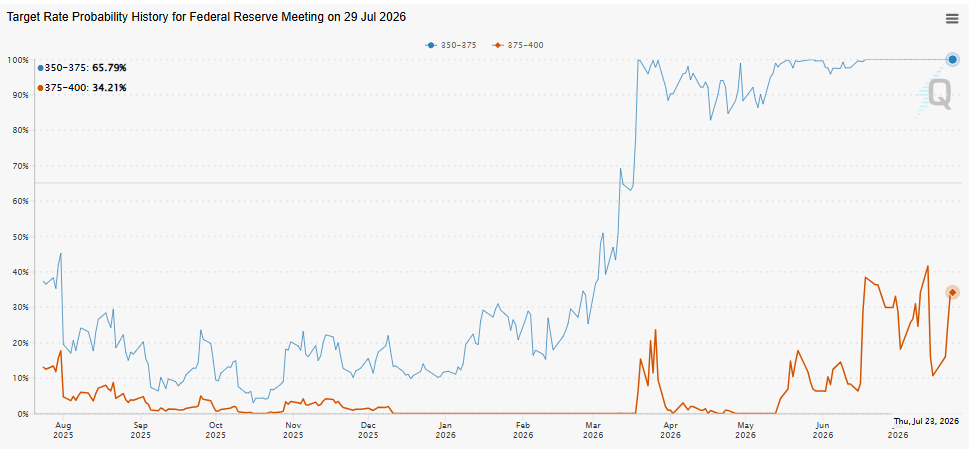
The sharp surge in Oil prices this week has reignited inflation concerns, which are weighing on risk sentiment. The CME FedWatch Tool chart below shows the probability of a July rate hike rising to 34.21%, up from 16.03% at the beginning of this week. This change reflects expectations that the Federal Reserve (Fed) could maintain a more hawkish stance, which weighs on risky assets such as BTC.
Moreover, the Trump administration is set to impose sweeping new tariffs ranging from 10% to 12.5% on goods from 60 of its largest trading partners, covering nearly all US imports. The move has reignited fears of a global trade war and higher inflation, further weighing on traders' risk appetite and capping BTC’s recovery.
Institutional demand shows mild signs of optimism
Institutional demand reflects mild signs of strength so far this week. SoSoValue data show that spot BTC ETFs recorded an inflow of $273.87 million through Thursday. If Friday shows positive flow, BTC is about to enter its third week of steady inflows.
These positive flows suggest institutional investors are gradually returning to the market; however, the magnitude remains modest compared with the heavy outflows recorded from mid-May to early July. If the trend extends through the end of the week, continued ETF demand could help cushion Bitcoin’s downside despite persistent geopolitical headwinds.
Can new ethics provisions clear the path for CLARITY Act passage?
On the regulatory front, US Senate Republicans released what appears to be a near-final draft of the Digital Asset Market Clarity (CLARITY) Act this week, boosting hopes that the long-awaited crypto market-structure bill could move closer to passage before the summer recess.
The latest draft focuses on ethics provisions, following the White House’s agreement to a comprehensive framework for it in the legislation. The update introduces a contentious ethics package that would ban the President, senior officials, and their spouses from issuing or sponsoring digital assets for personal gain while in office. This aims to curb potential conflicts of interest in a space where politics and financial interest often collide.
The restrictions on direct crypto ties for the President and other senior government officials are currently set to conclude in 2029, and enforcement falls to the Department of Justice (DOJ) through civil actions. It leaves the DOJ in the role of policing related ethics complaints. Officials must also sell holdings or place them in blind trusts, with violating tokens barred from exchanges.
However, with lawmakers expected to shift their attention to the November US midterm elections after the summer recess, early August may represent the last realistic window for the bill to advance through the regular legislative process. For the Crypto King, the bill’s passage could prove a key bullish catalyst by providing regulatory clarity, strengthening institutional confidence, and supporting broader adoption of digital assets.
Technical outlook: Holds strong above key support zone
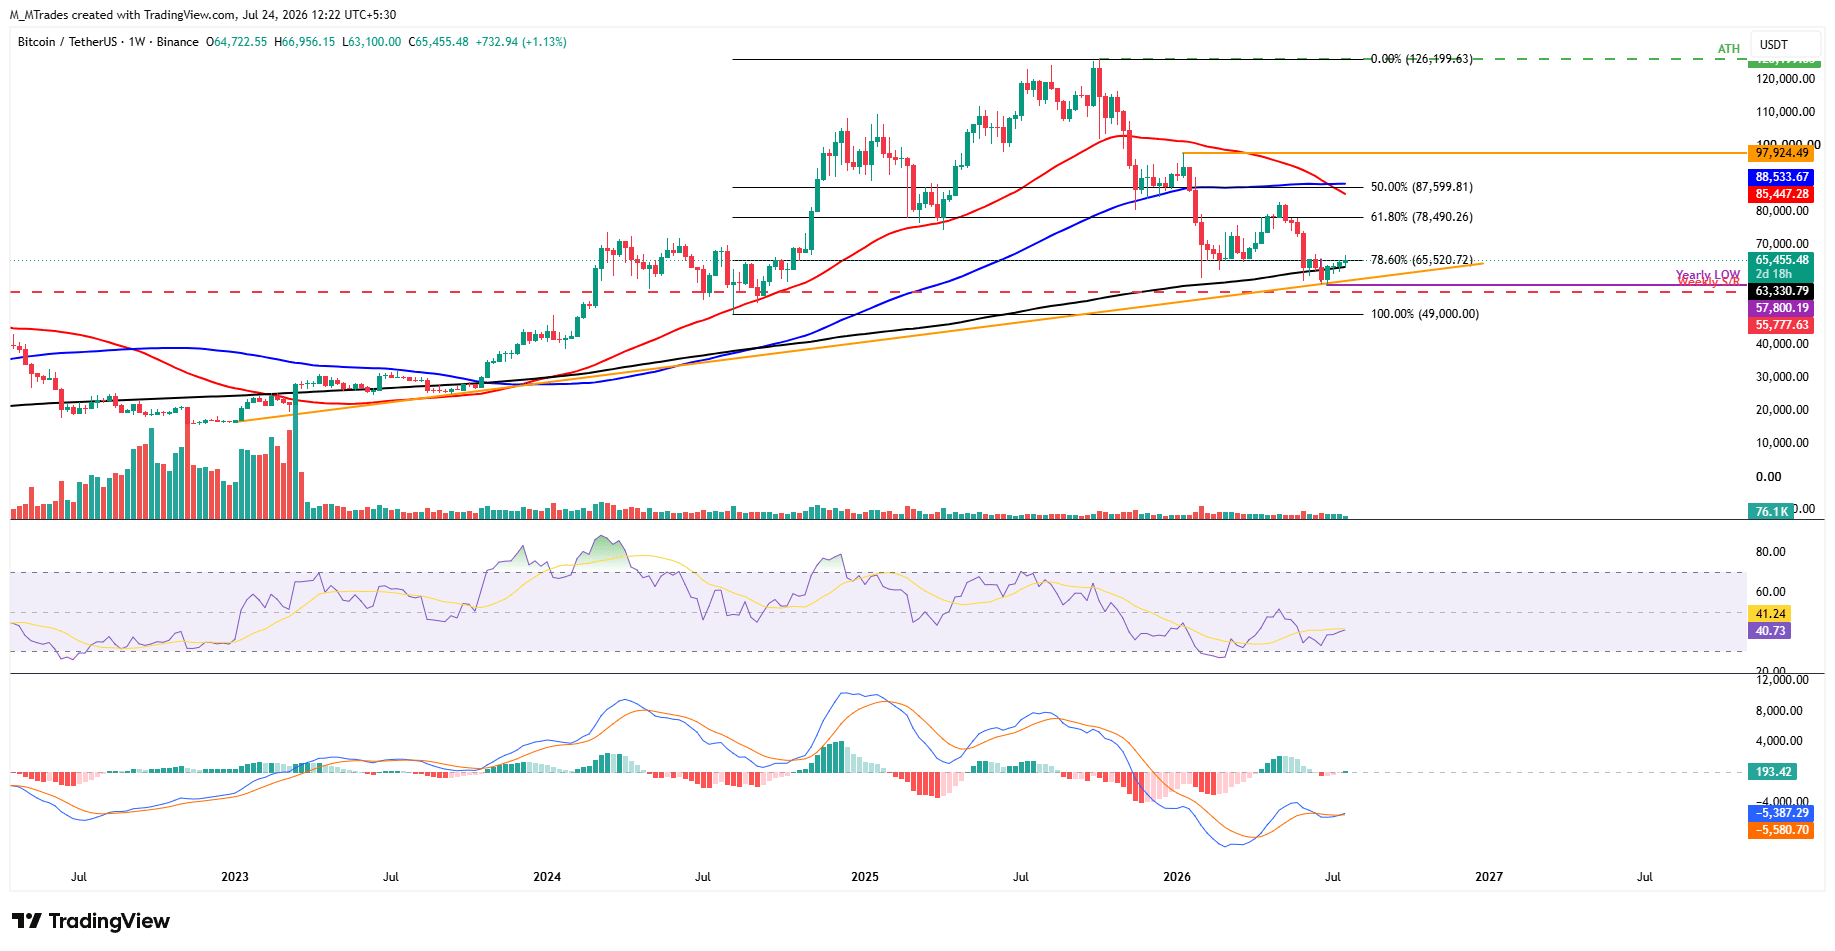
Bitcoin recovered slightly, over 1%, trading above $65,400 on Friday after finding support around the 200-week Simple Moving Average (SMA) at $63,330. BTC is extending the recovery, pointing to the fourth consecutive week of gains, having retested and found support near the ascending trendline (drawn by connecting multiple lows since January 2023) at the end of June.
If the Crypto King holds above the 200-day SMA at $63,330 and closes above the immediate resistance at the 78.60% Fibonacci retracement level at $65,520 (drawn from the August 2024 low of $49,000 to the October 2025 record high at $126,199), then BTC could extend the recovery toward the 61.80% Fibonacci retracement level at $78,490.
Momentum indicators on the weekly chart show mild signs of fading bearish sentiment: the Relative Strength Index (RSI) is trending higher toward the neutral 50 level, with a reading of 40 on Friday. Meanwhile, the Moving Average Convergence Divergence (MACD) flipped to a bullish crossover this week, supporting a positive outlook.
However, if BTC fails to find support around the 200-day SMA at $63,330 and closes below it on a weekly basis, it could extend the losses toward the ascending trendline support, roughly around $59,500.
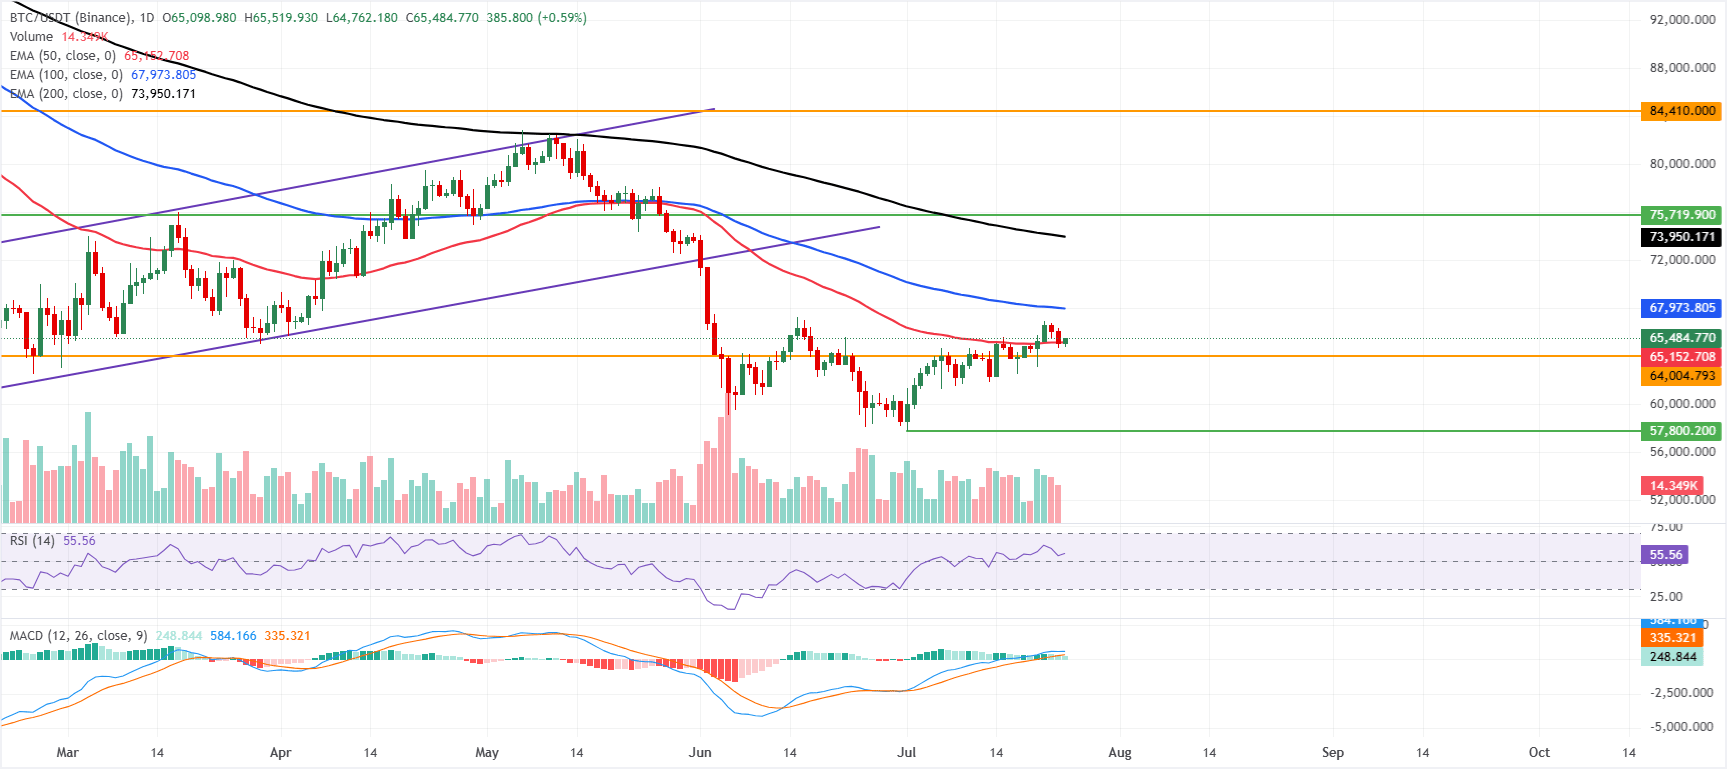
On the daily chart, BTC is holding a mildly bullish near-term bias, staying just above the 50-day Exponential Moving Average (EMA) at $65,152. However, BTC is still trading beneath the 100-day EMA at $67,973 and the 200-day EMA at $73,950, suggesting that while a rebound is underway, the broader trend structure remains capped by medium- and long-term EMAs.
The RSI on the daily chart is at 55 and leans positive without signaling overbought conditions. At the same time, the MACD remains in positive territory, hinting that upside momentum is present but not yet forceful enough to challenge the higher resistance band.
On the downside, initial support is provided by the 50-day EMA at $65,152, with a deeper structural floor emerging at the horizontal level of $64,004. A sustained break below this latter zone would weaken the current constructive tone and expose further downside.
On the topside, bulls face their first meaningful barrier at the 100-day EMA near $67,973, followed by the 200-day EMA at $73,950; a daily close above these clustered medium- and long-term EMAs would strengthen the bullish case and open the way toward the more distant horizontal resistance around $84,410.
(The technical analysis of this story was written with the help of an AI tool. Know more.)
Bitcoin, altcoins, stablecoins FAQs
Bitcoin is the largest cryptocurrency by market capitalization, a virtual currency designed to serve as money. This form of payment cannot be controlled by any one person, group, or entity, which eliminates the need for third-party participation during financial transactions.
Altcoins are any cryptocurrency apart from Bitcoin, but some also regard Ethereum as a non-altcoin because it is from these two cryptocurrencies that forking happens. If this is true, then Litecoin is the first altcoin, forked from the Bitcoin protocol and, therefore, an “improved” version of it.
Stablecoins are cryptocurrencies designed to have a stable price, with their value backed by a reserve of the asset it represents. To achieve this, the value of any one stablecoin is pegged to a commodity or financial instrument, such as the US Dollar (USD), with its supply regulated by an algorithm or demand. The main goal of stablecoins is to provide an on/off-ramp for investors willing to trade and invest in cryptocurrencies. Stablecoins also allow investors to store value since cryptocurrencies, in general, are subject to volatility.
Bitcoin dominance is the ratio of Bitcoin's market capitalization to the total market capitalization of all cryptocurrencies combined. It provides a clear picture of Bitcoin’s interest among investors. A high BTC dominance typically happens before and during a bull run, in which investors resort to investing in relatively stable and high market capitalization cryptocurrency like Bitcoin. A drop in BTC dominance usually means that investors are moving their capital and/or profits to altcoins in a quest for higher returns, which usually triggers an explosion of altcoin rallies.
추천 기사


