


Crypto Today: Bitcoin, Ethereum, XRP pare losses as breakout potential builds
- Bitcoin stabilizes above $65,000, eyeing a short-term breakout despite renewed outflows from US-listed spot ETFs.
- Ethereum maintains a neutral-to-bullish tone near $1,900 amid reducing capital inflows through ETFs.
- XRP bulls defend the $1.10 critical support level, building on relatively stable momentum indicators.
Bitcoin (BTC) is edging higher on Friday, albeit gradually, after reclaiming support above $65,000. Meanwhile, Ethereum (ETH) shows signs of stability near the immediate $1,900 hurdle, backed by mild capital inflows. Ripple (XRP), on the other hand, holds above the pivotal $1.10, with its upside structurally constrained below $1.15.
Bitcoin ETFs renew outflows as the US-Iran war persists
The United States (US) has conducted air strikes for a thirteenth consecutive night, with Iranian media reporting explosions in multiple cities, including Khorramabad, Jask, Ahvaz, and Bandar Abbas.
President Donald Trump stated he is weighing a “massive attack” on Iran and will soon determine whether to resume large-scale military operations. Iranian Foreign Minister Abbas Araghchi described the US action as “mindless aggression,” warning that Washington will now face a steeper price to secure an end to the conflict.
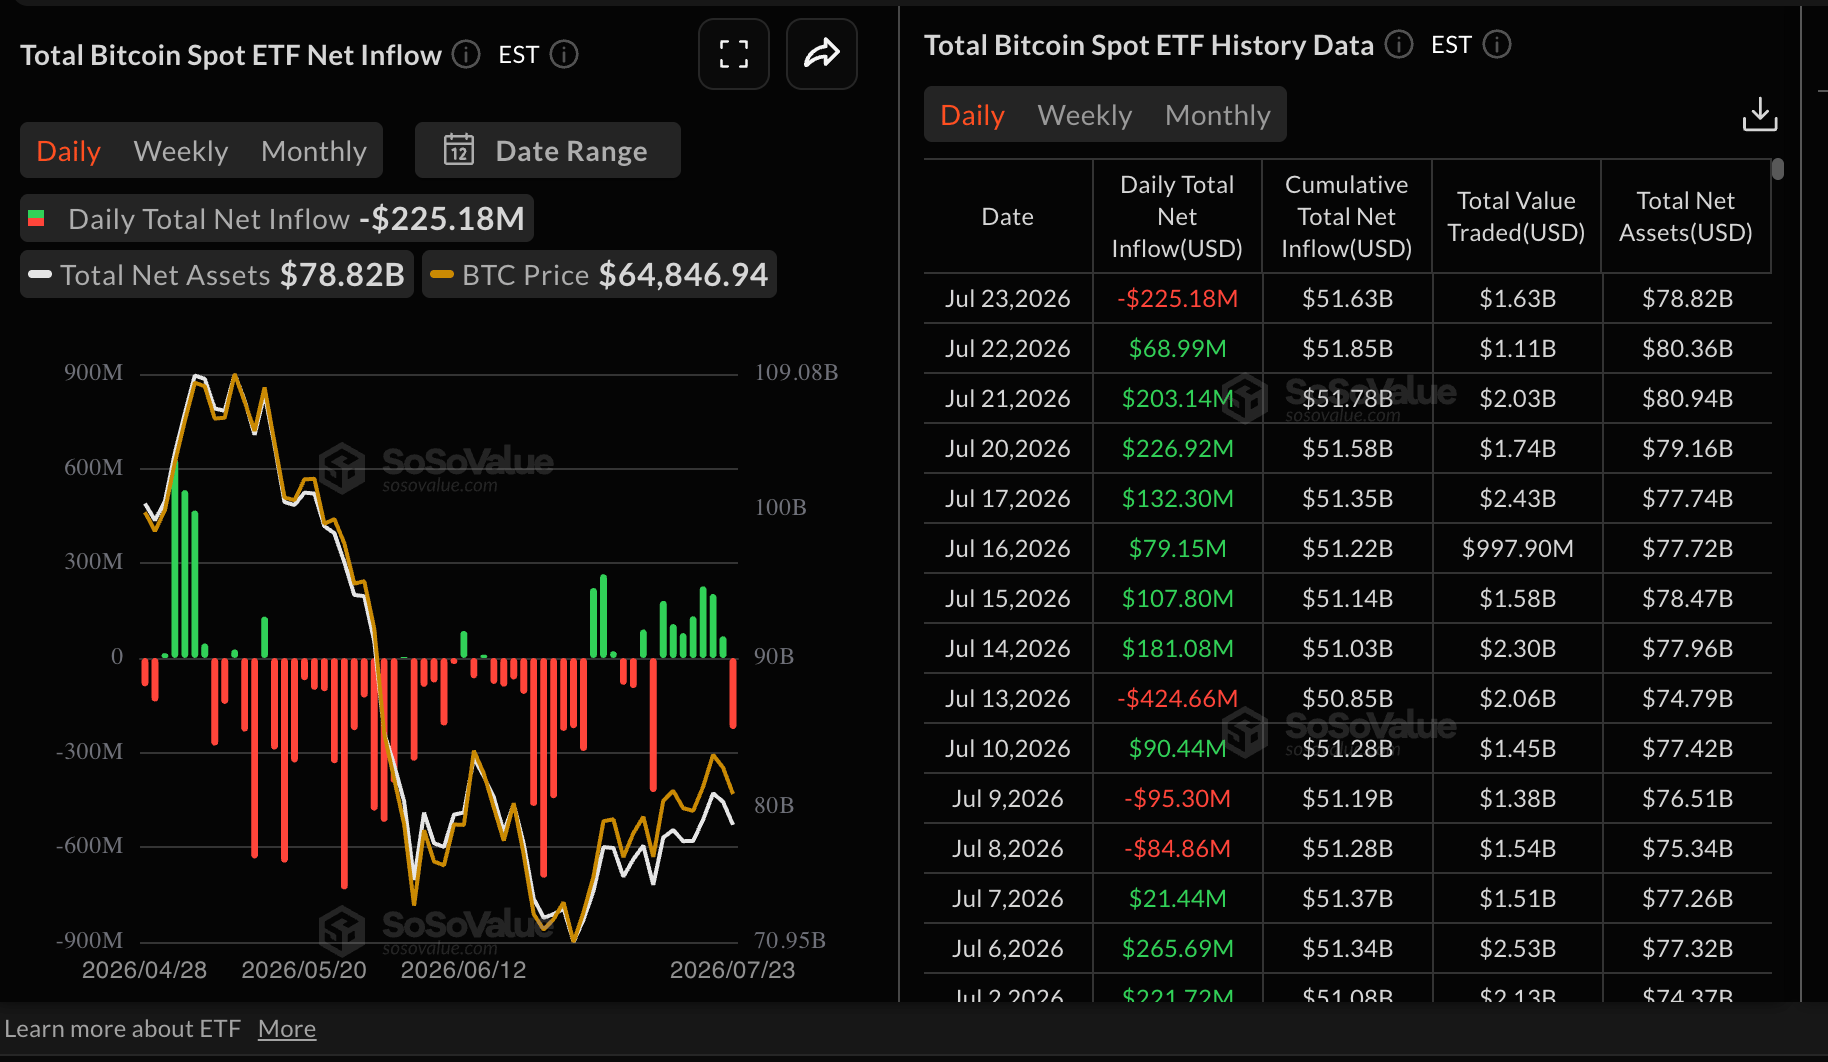
Meanwhile, risk-off sentiment is evident among institutional investors, who drew out roughly $225 million from US-listed spot Exchange-Traded Funds (ETFs) on Thursday, following seven consecutive days of inflows. According to SoSoValue data, cumulative inflows stand at $51.63 billion, with net assets at $78.82 billion, underpinning investors' long-term positive BTC outlook.
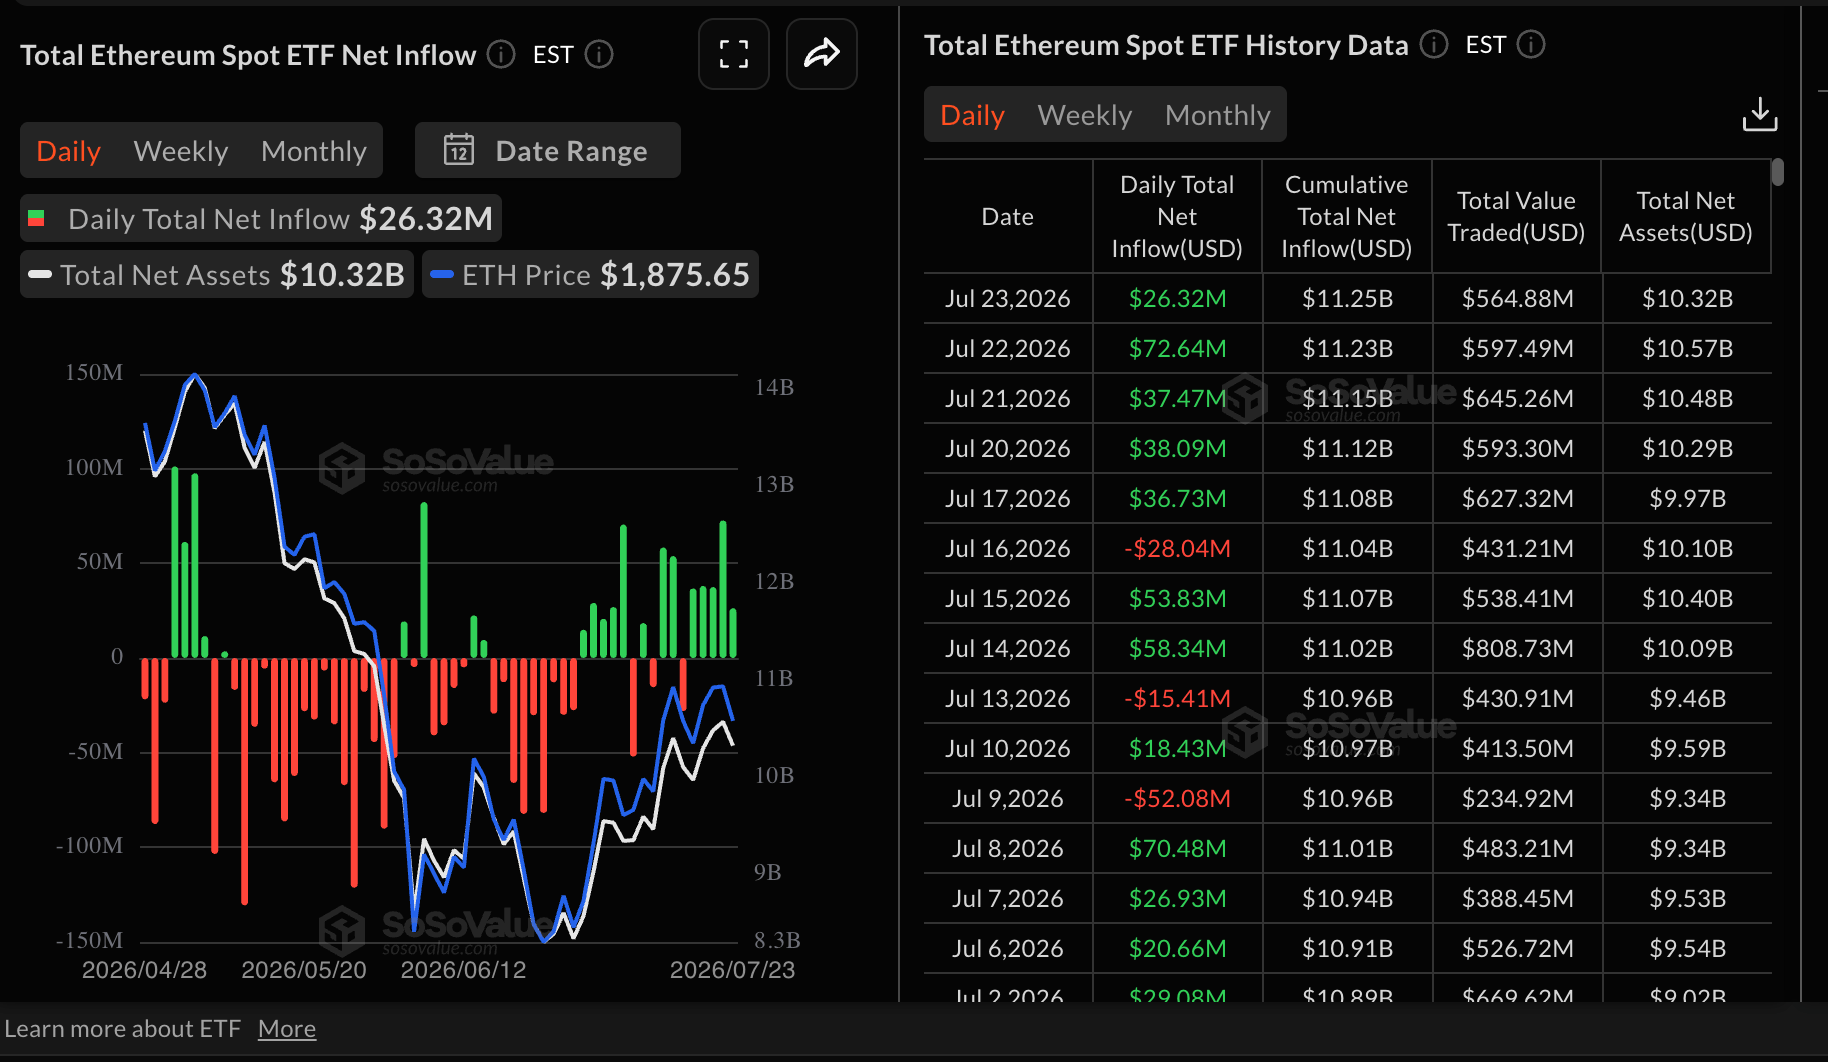
Ethereum spot ETFs continue to recover, with Thursday’s inflows falling to $26 million, from Wednesday’s $73 million. Cumulative inflows edged higher to $11.25 billion from $11.23 billion over the same period, while average assets under management stand at $10.32 billion.
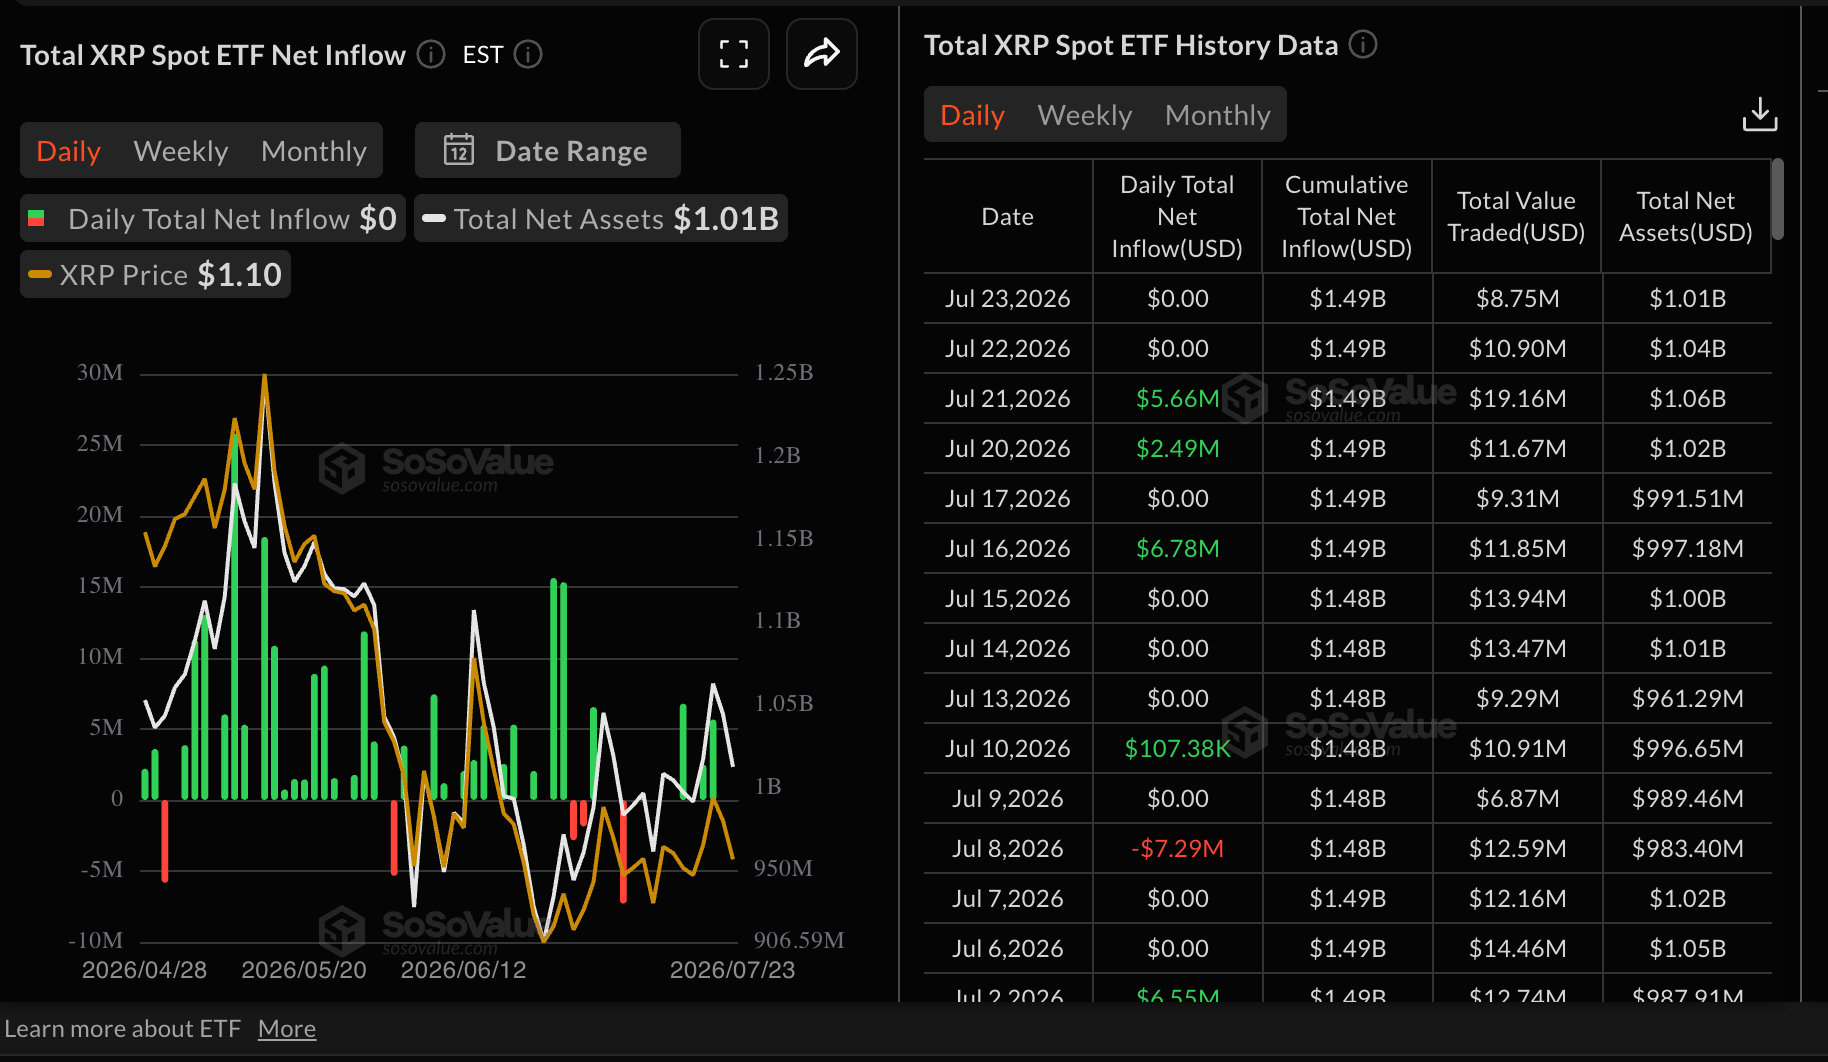
Appetite for XRP ETFs has notably lagged that for Bitcoin and Ethereum, with activity remaining muted on Wednesday and Thursday. Looking back, inflows totaled $2.5 million on Monday and roughly $6 million on Tuesday.
According to SoSoValue, cumulative inflows are steady at $1.49 billion, with net assets averaging $1 billion, underscoring investors’ long-term interest in XRP investment products.
“The cryptocurrency market is navigating one of its most complex phases of the year. Bitcoin is no longer driven solely by capital flows or technical indicators; instead, its price action has become a direct reflection of an increasingly intertwined macroeconomic and geopolitical landscape, Simon-Peter Massabni, Head of Business Development at XS.com, said in a comment.
Price analysis: Bitcoin holds higher support
Bitcoin trades above $65,000, holding a mildly constructive but still capped tone as price sits above the 50-day Exponential Moving Average (EMA) at roughly $65,150 and the Bollinger Bands’ middle layer near $64,312, while remaining well below the 100-day and 200-day EMAs at about $67,967 and $73,733 respectively.
This configuration suggests an early recovery phase rather than a clean bullish trend, with the Relative Strength Index (RSI) around 55 on the daily chart and the Moving Average Convergence Divergence (MACD) histogram staying comfortably positive, hinting that upside momentum is improving but not yet strong enough to challenge the broader overhead trend filters.
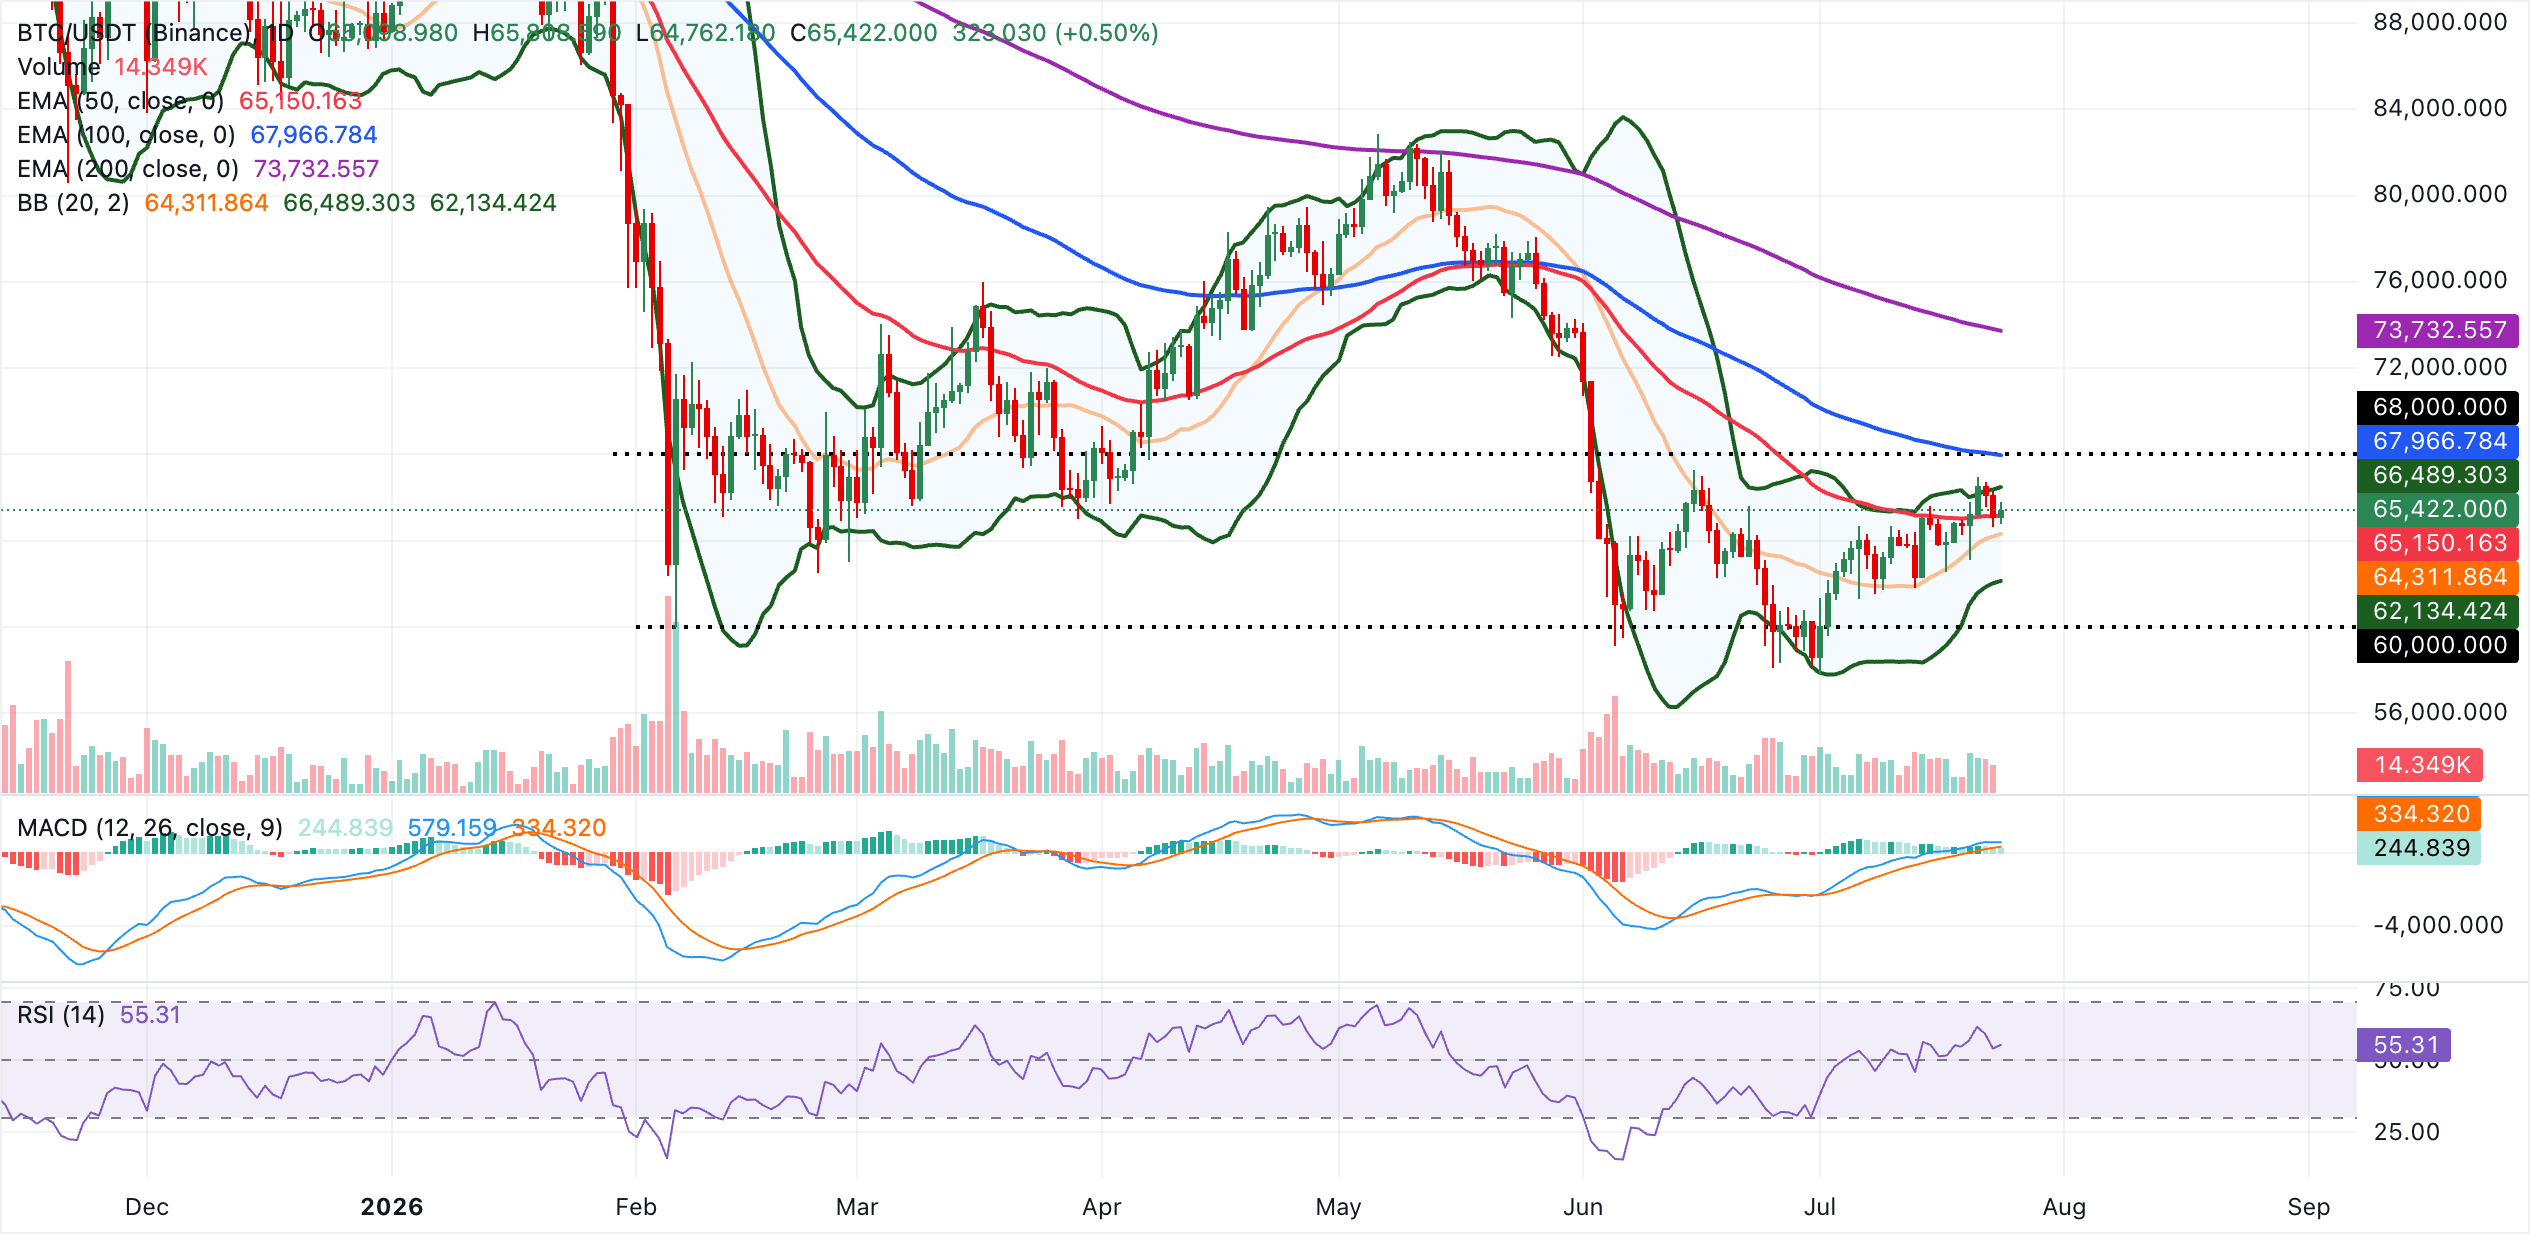
On the topside, initial resistance appears at the upper Bollinger Band around $66,489, where volatility caps the recent bounce, followed by the 100-day EMA near $67,967 and then the more meaningful 200-day EMA around $73,733 as a major medium-term barrier. On the downside, immediate support is provided first by the 50-day EMA at approximately $65,150, with further demand expected at the Bollinger middle band around $64,312. A deeper setback toward the lower band near $62,134 would likely be needed to threaten the nascent constructive bias on the daily timeframe.
Altcoins outlook: Ethereum and XRP show signs a bullish turnaround
Ethereum trades at $1,892, holding a neutral-to-bullish tone as price stays above the 50-day EMA near $1,832 and the SuperTrend support around $1,741, but still below the higher-order 100-day and 200-day EMAs. This configuration suggests an ongoing recovery phase within a broader corrective structure, with dip-buying interest emerging above the mid-$1,800s.
The MACD indicator remains in positive territory but has been easing, while the RSI around 58 points to constructive yet not overextended upside momentum.
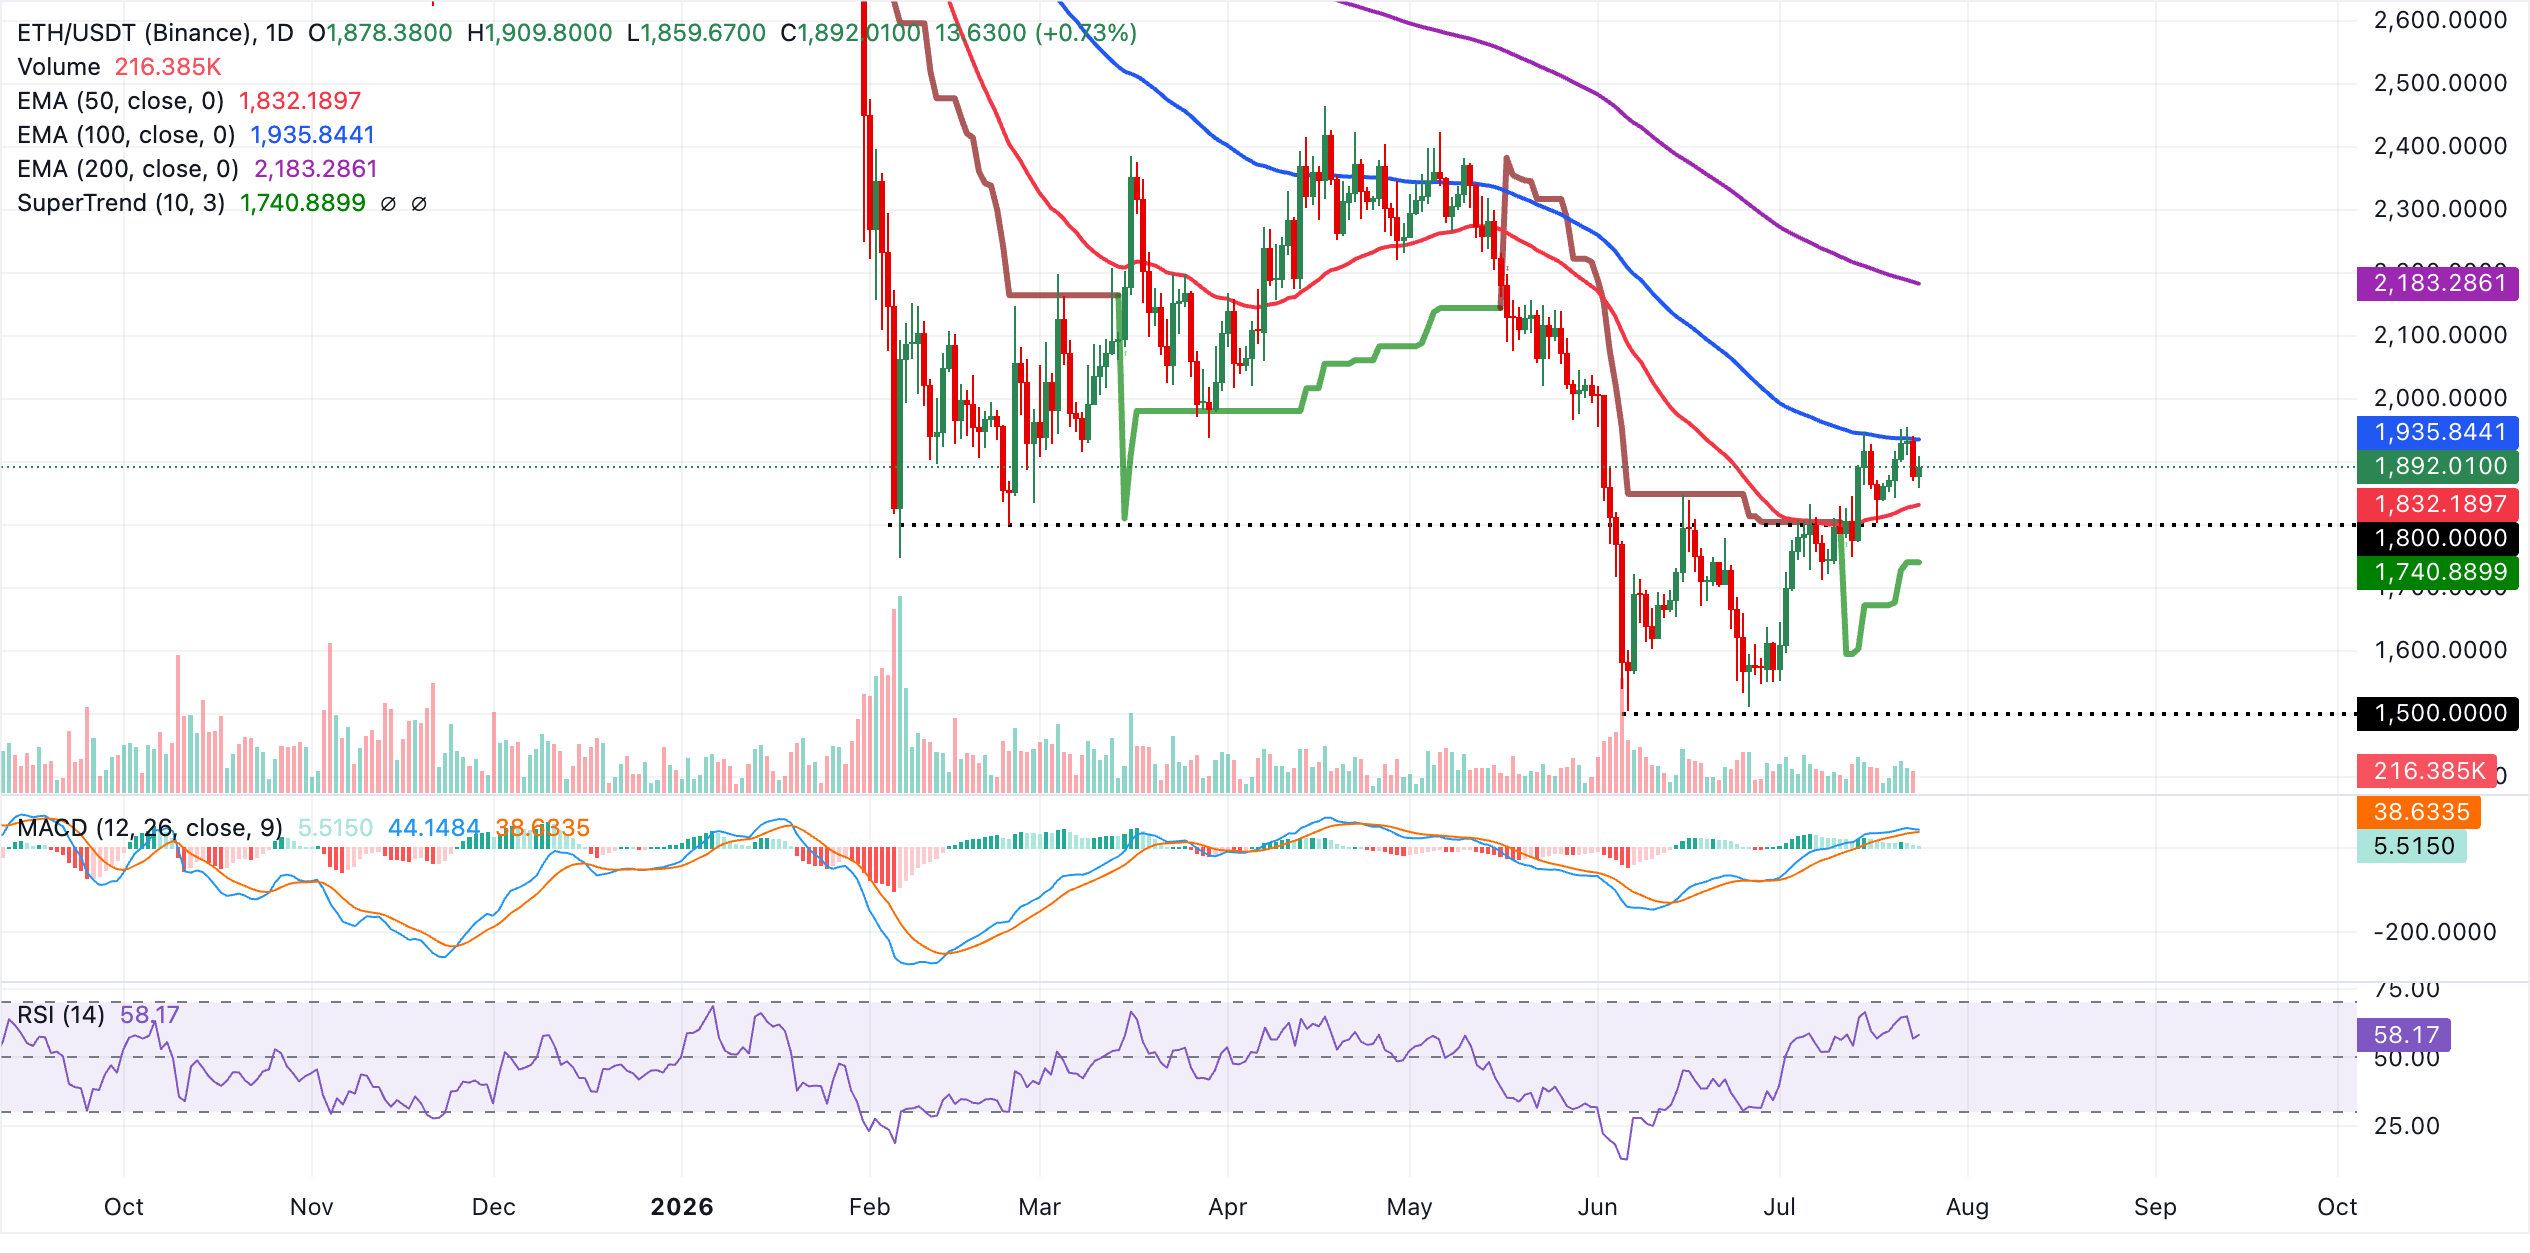
On the topside, initial resistance appears at the 100-day EMA close to $1,936, and a sustained break above this level would expose the 200-day EMA near $2,183 as the next bullish objective. On the downside, immediate support is defined by the 50-day EMA at roughly $1,832, with a deeper pullback toward the SuperTrend line around $1,741 likely to attract buyers if the current advance pauses or corrects.
XRP, on the other hand, trades at $1.11. The pair remains in a broader bearish context with price holding below the 50-day, 100-day and 200-day EMAs, keeping rallies capped despite the recent rebound from sub-$1.10 levels.
The Parabolic SAR at $1.07 sits underneath spot and suggests nearby trend-follow support, while the RSI hovers around the neutral 50 line on the daily chart, indicating a lack of strong directional conviction as momentum consolidates. The MACD histogram remains marginally positive but is easing, hinting that bullish pressure is waning beneath overhead averages.
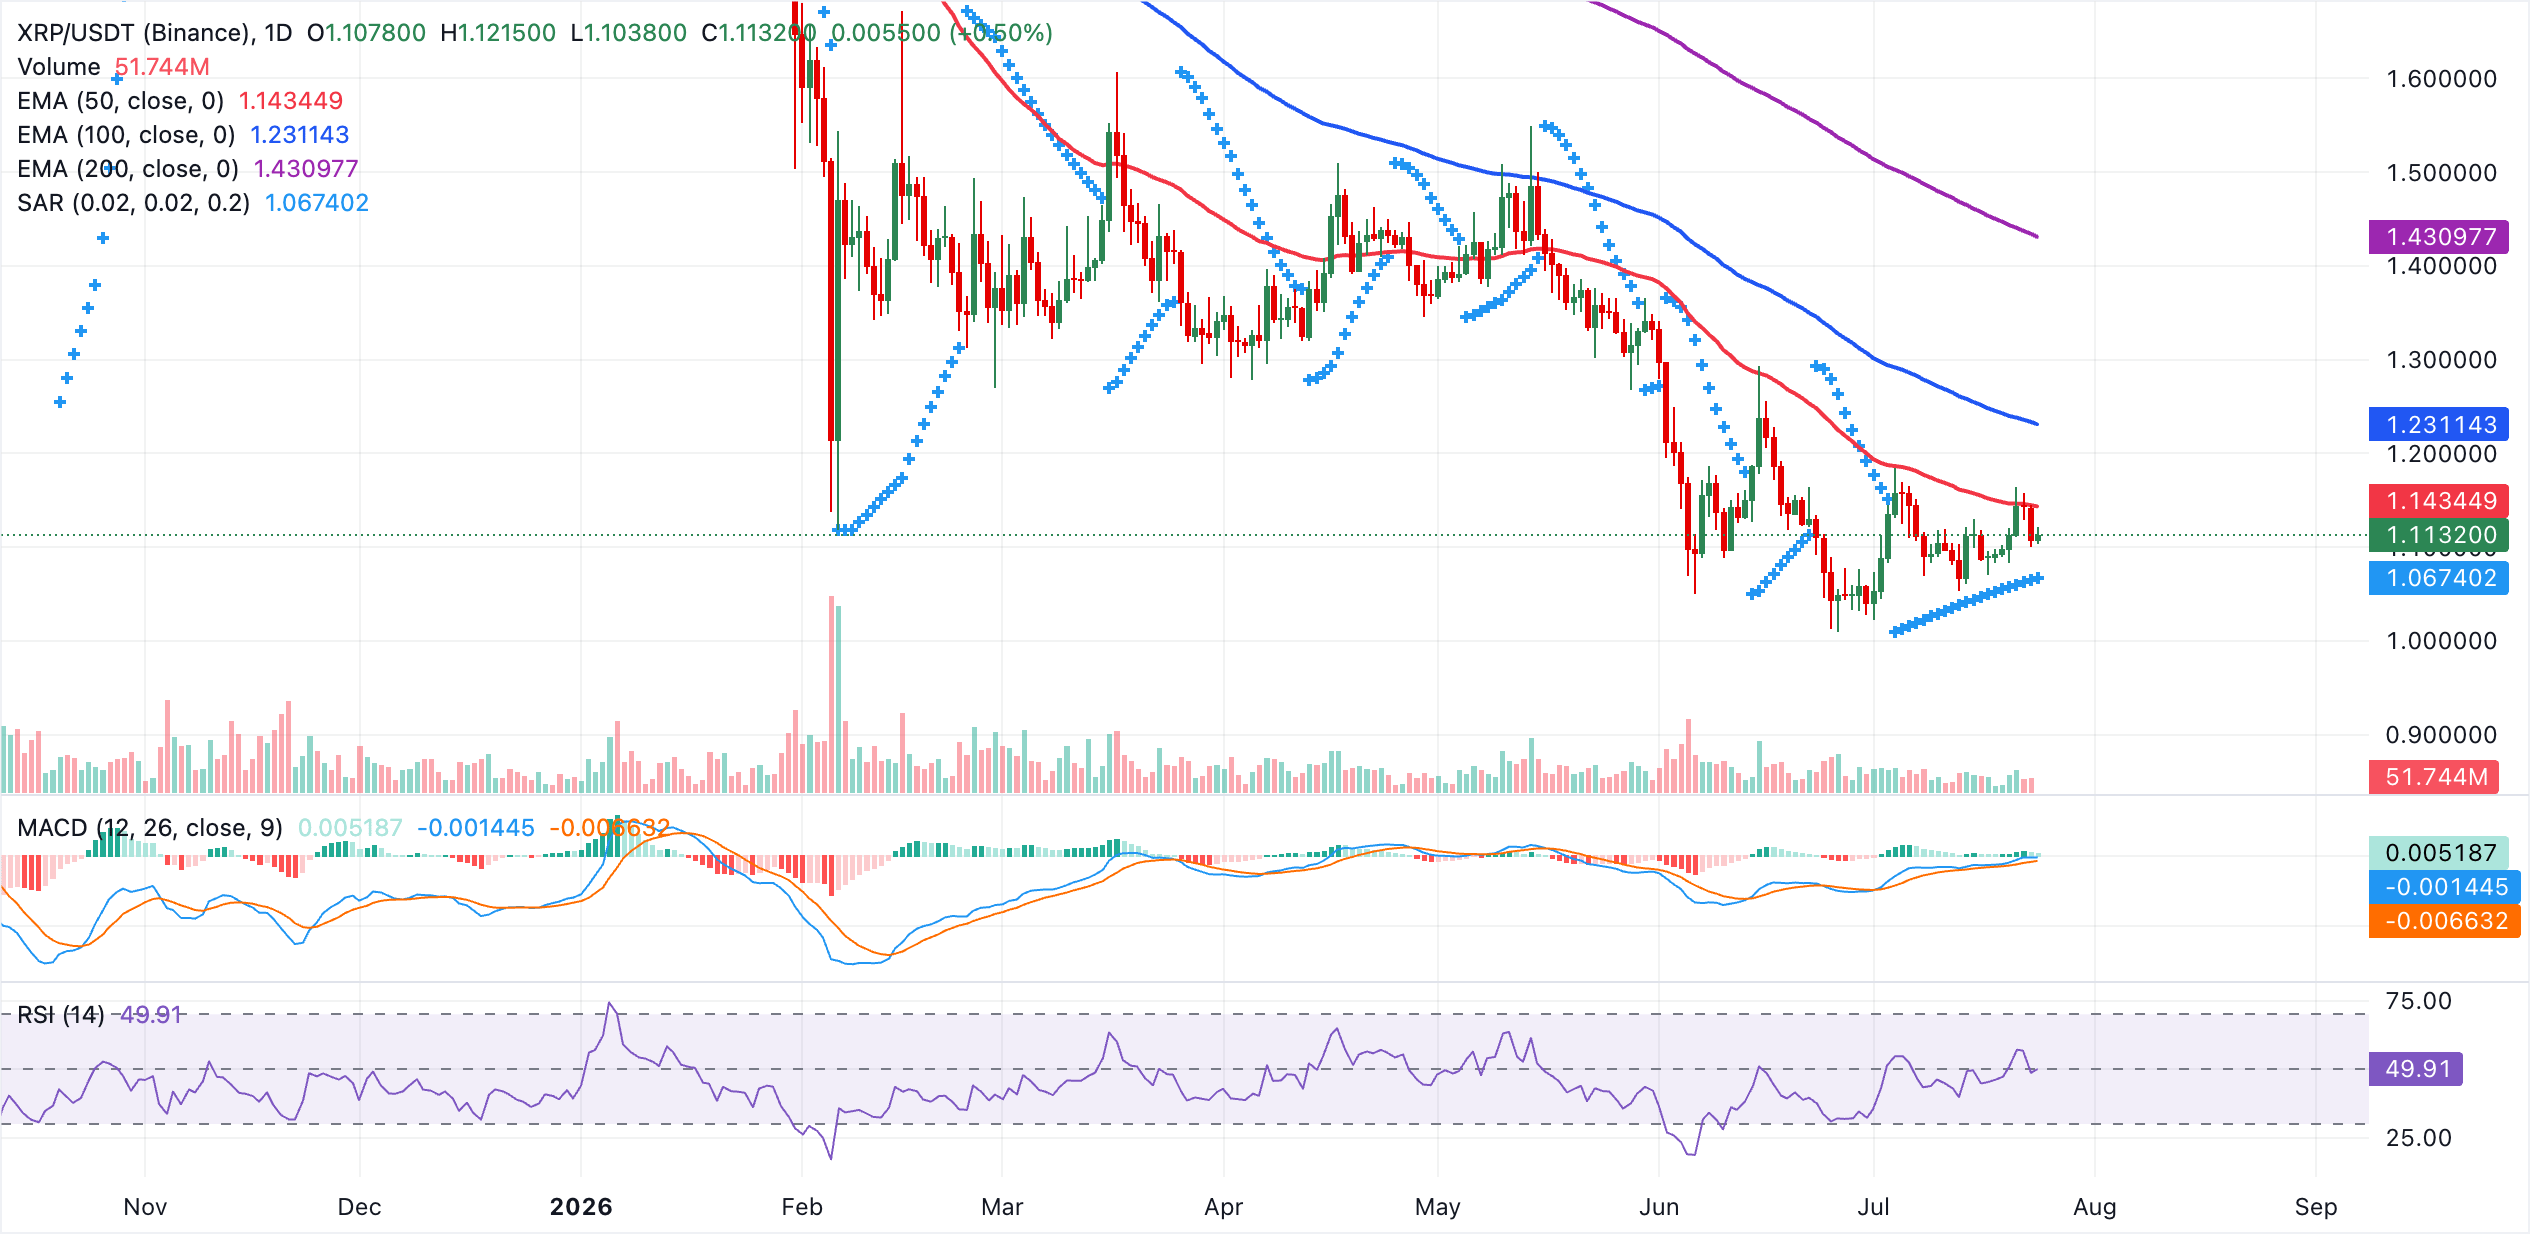
Initial resistance aligns with the 50-day EMA at $1.14. A daily close above this level would be needed to open the way toward the 100-day EMA at $1.23, with the 200-day EMA higher up at $1.43 reinforcing the medium-term bearish structure. On the downside, immediate support is provided by the Parabolic SAR level at $1.07. A break below this floor would likely expose the pair to a deeper retracement, reinforcing the prevailing downside bias as long as price holds beneath the key EMAs.
(The technical analysis of this story was written with the help of an AI tool. Know more.)
Crypto ETF FAQs
An Exchange-Traded Fund (ETF) is an investment vehicle or an index that tracks the price of an underlying asset. ETFs can not only track a single asset, but a group of assets and sectors. For example, a Bitcoin ETF tracks Bitcoin’s price. ETF is a tool used by investors to gain exposure to a certain asset.
Yes. The first Bitcoin futures ETF in the US was approved by the US Securities & Exchange Commission in October 2021. A total of seven Bitcoin futures ETFs have been approved, with more than 20 still waiting for the regulator’s permission. The SEC says that the cryptocurrency industry is new and subject to manipulation, which is why it has been delaying crypto-related futures ETFs for the last few years.
Yes. The SEC approved in January 2024 the listing and trading of several Bitcoin spot Exchange-Traded Funds, opening the door to institutional capital and mainstream investors to trade the main crypto currency. The decision was hailed by the industry as a game changer.
The main advantage of crypto ETFs is the possibility of gaining exposure to a cryptocurrency without ownership, reducing the risk and cost of holding the asset. Other pros are a lower learning curve and higher security for investors since ETFs take charge of securing the underlying asset holdings. As for the main drawbacks, the main one is that as an investor you can’t have direct ownership of the asset, or, as they say in crypto, “not your keys, not your coins.” Other disadvantages are higher costs associated with holding crypto since ETFs charge fees for active management. Finally, even though investing in ETFs reduces the risk of holding an asset, price swings in the underlying cryptocurrency are likely to be reflected in the investment vehicle too.
추천 기사


