

Bitcoin Price Forecast: BTC sinks to 21-month low amid ETF outflows, US-Iran peace uncertainty
- Bitcoin stabilizes around $59,000 after falling to a 21-month low of $57,800 on Wednesday.
- Institutional sell-off remains robust, with spot ETFs recording an outflow of over $222 million on Tuesday, extending the negative streak.
- Geopolitical uncertainty remains elevated after Iran ruled out talks with US envoys, clouding prospects for a peace agreement and keeping risk sentiment fragile.
Bitcoin (BTC) trades around $59,000 on Wednesday after plunging to a 21-month low of $57,800, the lowest level since mid-September 2024. Institutional selling supports this price correction, with spot Exchange Traded Funds (ETFs) recording an outflow of over $222 million on Tuesday, extending their recent streak of withdrawals. In addition, uncertainty surrounding US-Iran developments has kept investors cautious, weighing on Crypto King’s prices.
US-Iran uncertainty dampens risk appetite
Geopolitical uncertainty remains elevated after Iran said on Tuesday that it would not meet with top US envoys who traveled to Doha, Qatar, following last week’s outbreak of hostilities.
Iranian officials added that both sides must still sort out the terms of the ceasefire they signed two weeks ago before they could tackle more difficult topics, such as possible limits to its nuclear program.
Meanwhile, the Qatari government confirmed that US envoys Jared Kushner and Steve Witkoff would meet the Qatari prime minister to discuss ongoing US-Iran talks and regional developments. However, there are no high-level meetings scheduled between the US and Iran.
These developments highlight the fragile state of the recent ceasefire and cloud the outlook for a durable peace agreement. This growing uncertainty has dampened the risk appetite, with BTC slipping to a 21-month low of $57,800 on Wednesday. Moreover, any breakdown in talks or renewed military escalation between the two countries could further weaken the risk sentiment, potentially triggering a fresh sell-off in BTC.
Institutional selling pushes BTC to new yearly lows
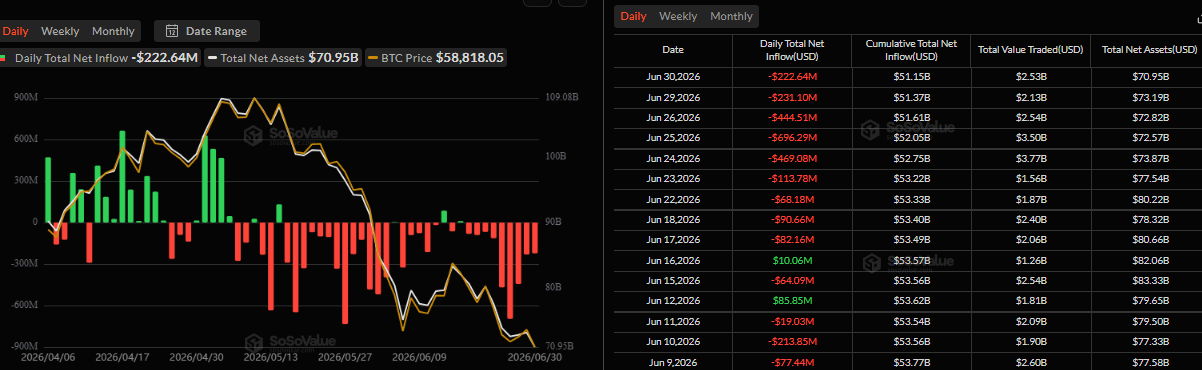
Institutional demand continues to weaken so far this week. SoSoValue data show that spot BTC ETFs recorded an outflow of $222.64 million on Tuesday after an outflow of $231.10 million on Monday. Tuesday’s outflow marked the ninth consecutive day of outflows since mid-June, highlighting fading institutional demand. If this outflow trend continues this week, BTC could see further correction.
Is quarter-end rebalancing BTC’s next bullish catalyst?
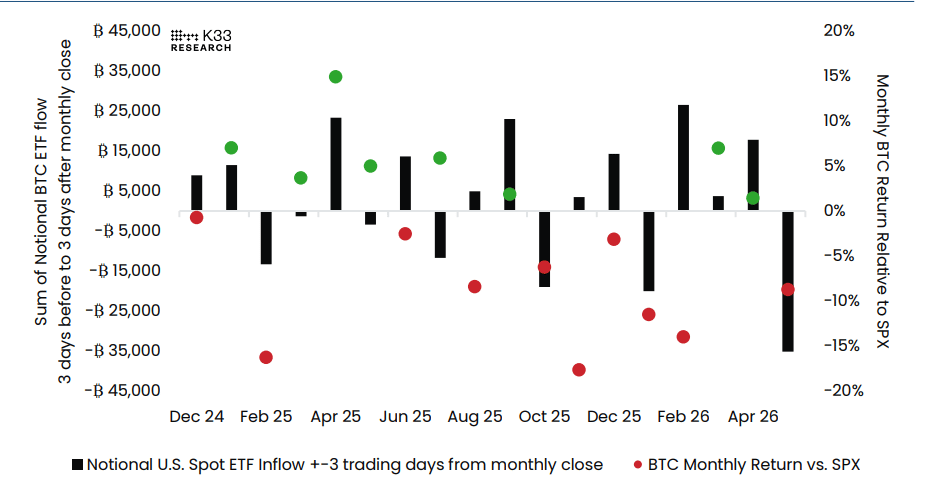
A K33 research report on Tuesday suggests quarter-end portfolio rebalancing could provide short-term support for Bitcoin.
The chart below shows that over the past 18 months, 9 months have seen net ETF flows during the six-day window surrounding month-end (three trading days before and three trading days after month-end) diverge materially from the prevailing trend during the rest of the month.
“In several of these cases, months in which Bitcoin underperformed the S&P 500 were followed by stronger ETF inflows around month-end and into the start of the following month,” said K33 Research analyst.
The analyst further explained that this behavior is consistent with portfolio rebalancing, as investors may increase their Bitcoin exposure after periods of relative underperformance to restore target asset allocations. However, the relationship has not been universal. The remaining nine months in the sample did not exhibit the same pattern, indicating that portfolio rebalancing is not a persistent driver of Bitcoin ETF flows and likely represents just one of several factors influencing institutional demand.
Meanwhile, the trend has become more consistent over the past four quarters. If this pattern continues, quarter-end portfolio rebalancing could provide a much-needed tailwind for Bitcoin, potentially supporting a short-term recovery during the first few trading days of July.
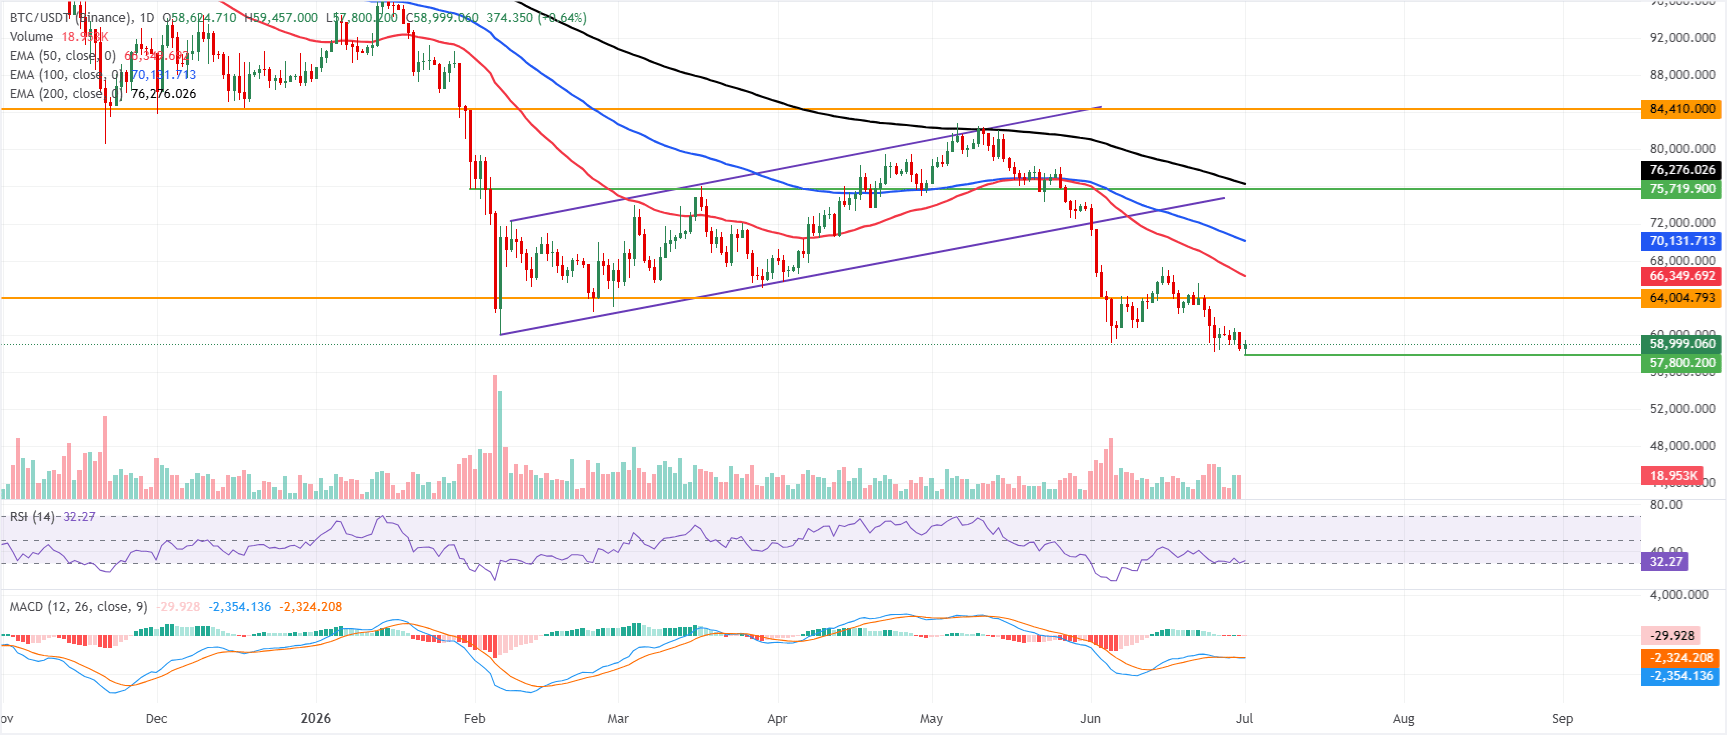
Bitcoin Price Forecast: Slips to a 21-month low
Bitcoin price is recovering slightly to $59,000 after hitting a new yearly low of $57,800 on Wednesday. BTC has extended its slide well below the key Exponential Moving Averages (EMAs), which keeps the bias firmly bearish. The 50-day EMA at $66,349, the 100-day EMA at $70,131 and the 200-day EMA at $76,276 all sit overhead, suggesting a market that remains capped by a dense band of medium- and long-term trend resistance.
The Relative Strength Index (RSI) on the daily chart hovers near 32, hinting at lingering weak momentum rather than a capitulation low. At the same time, the Moving Average Convergence Divergence (MACD) turns slightly negative again around the zero line, suggesting that the latest bounce is stalling under layered overhead supply.
On the topside, initial resistance emerges at the prior horizontal barrier near $64,004, ahead of the 50-day EMA near $66,349, with further recovery levels at the 100-day EMA near $70,131 and the 200-day EMA near $76,276.
A more substantial bullish reassessment would require a daily close above these clustered EMAs, while a failure to reclaim the $64,000 area would leave BTC vulnerable to a renewed downside extension targeting the key psychological level at $55,000.
(The technical analysis of this story was written with the help of an AI tool.)
Bitcoin, altcoins, stablecoins FAQs
Bitcoin is the largest cryptocurrency by market capitalization, a virtual currency designed to serve as money. This form of payment cannot be controlled by any one person, group, or entity, which eliminates the need for third-party participation during financial transactions.
Altcoins are any cryptocurrency apart from Bitcoin, but some also regard Ethereum as a non-altcoin because it is from these two cryptocurrencies that forking happens. If this is true, then Litecoin is the first altcoin, forked from the Bitcoin protocol and, therefore, an “improved” version of it.
Stablecoins are cryptocurrencies designed to have a stable price, with their value backed by a reserve of the asset it represents. To achieve this, the value of any one stablecoin is pegged to a commodity or financial instrument, such as the US Dollar (USD), with its supply regulated by an algorithm or demand. The main goal of stablecoins is to provide an on/off-ramp for investors willing to trade and invest in cryptocurrencies. Stablecoins also allow investors to store value since cryptocurrencies, in general, are subject to volatility.
Bitcoin dominance is the ratio of Bitcoin's market capitalization to the total market capitalization of all cryptocurrencies combined. It provides a clear picture of Bitcoin’s interest among investors. A high BTC dominance typically happens before and during a bull run, in which investors resort to investing in relatively stable and high market capitalization cryptocurrency like Bitcoin. A drop in BTC dominance usually means that investors are moving their capital and/or profits to altcoins in a quest for higher returns, which usually triggers an explosion of altcoin rallies.
추천 기사


