

Ripple Price Forecast: XRP targets $1.25 as downside risks grow, subdued ETF activity
- XRP hovers above $1.33, weighed down by macroeconomic headwinds.
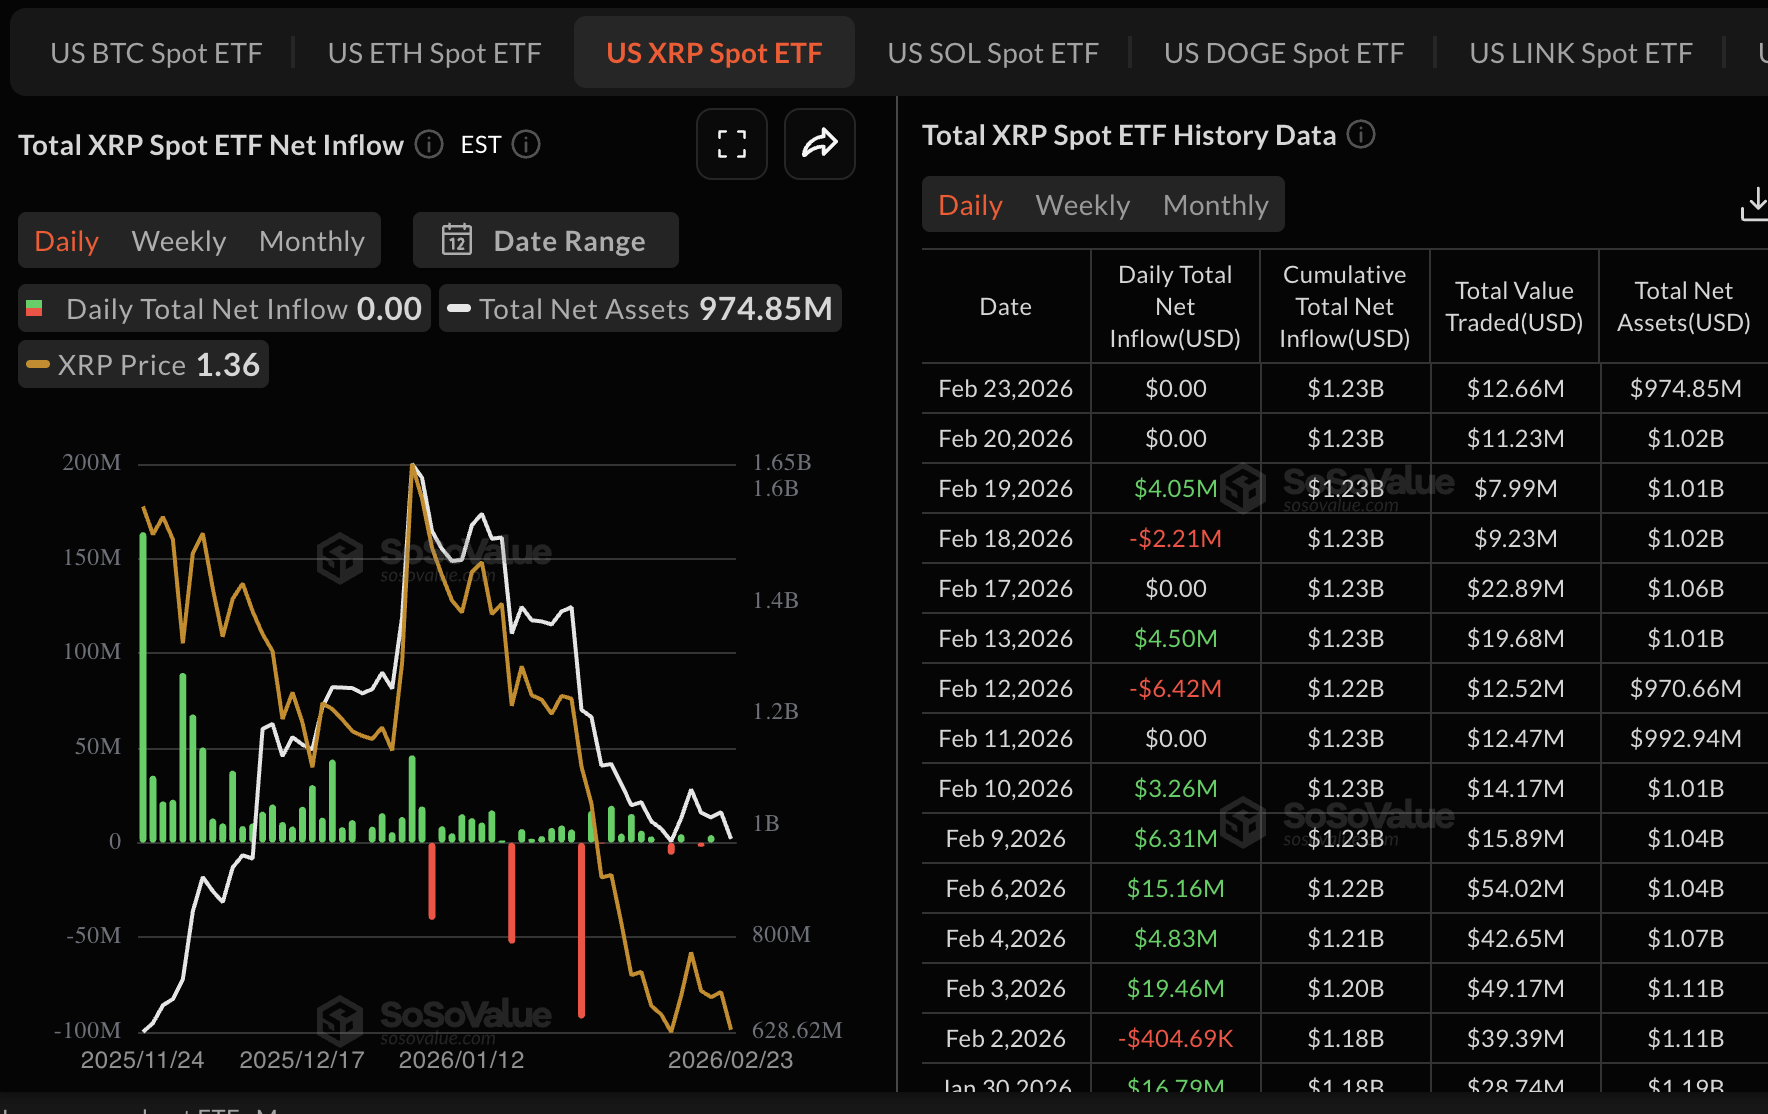
- XRP spot ETFs are facing declining interest, with no activity since Friday, as institutional investors reduce their exposure.
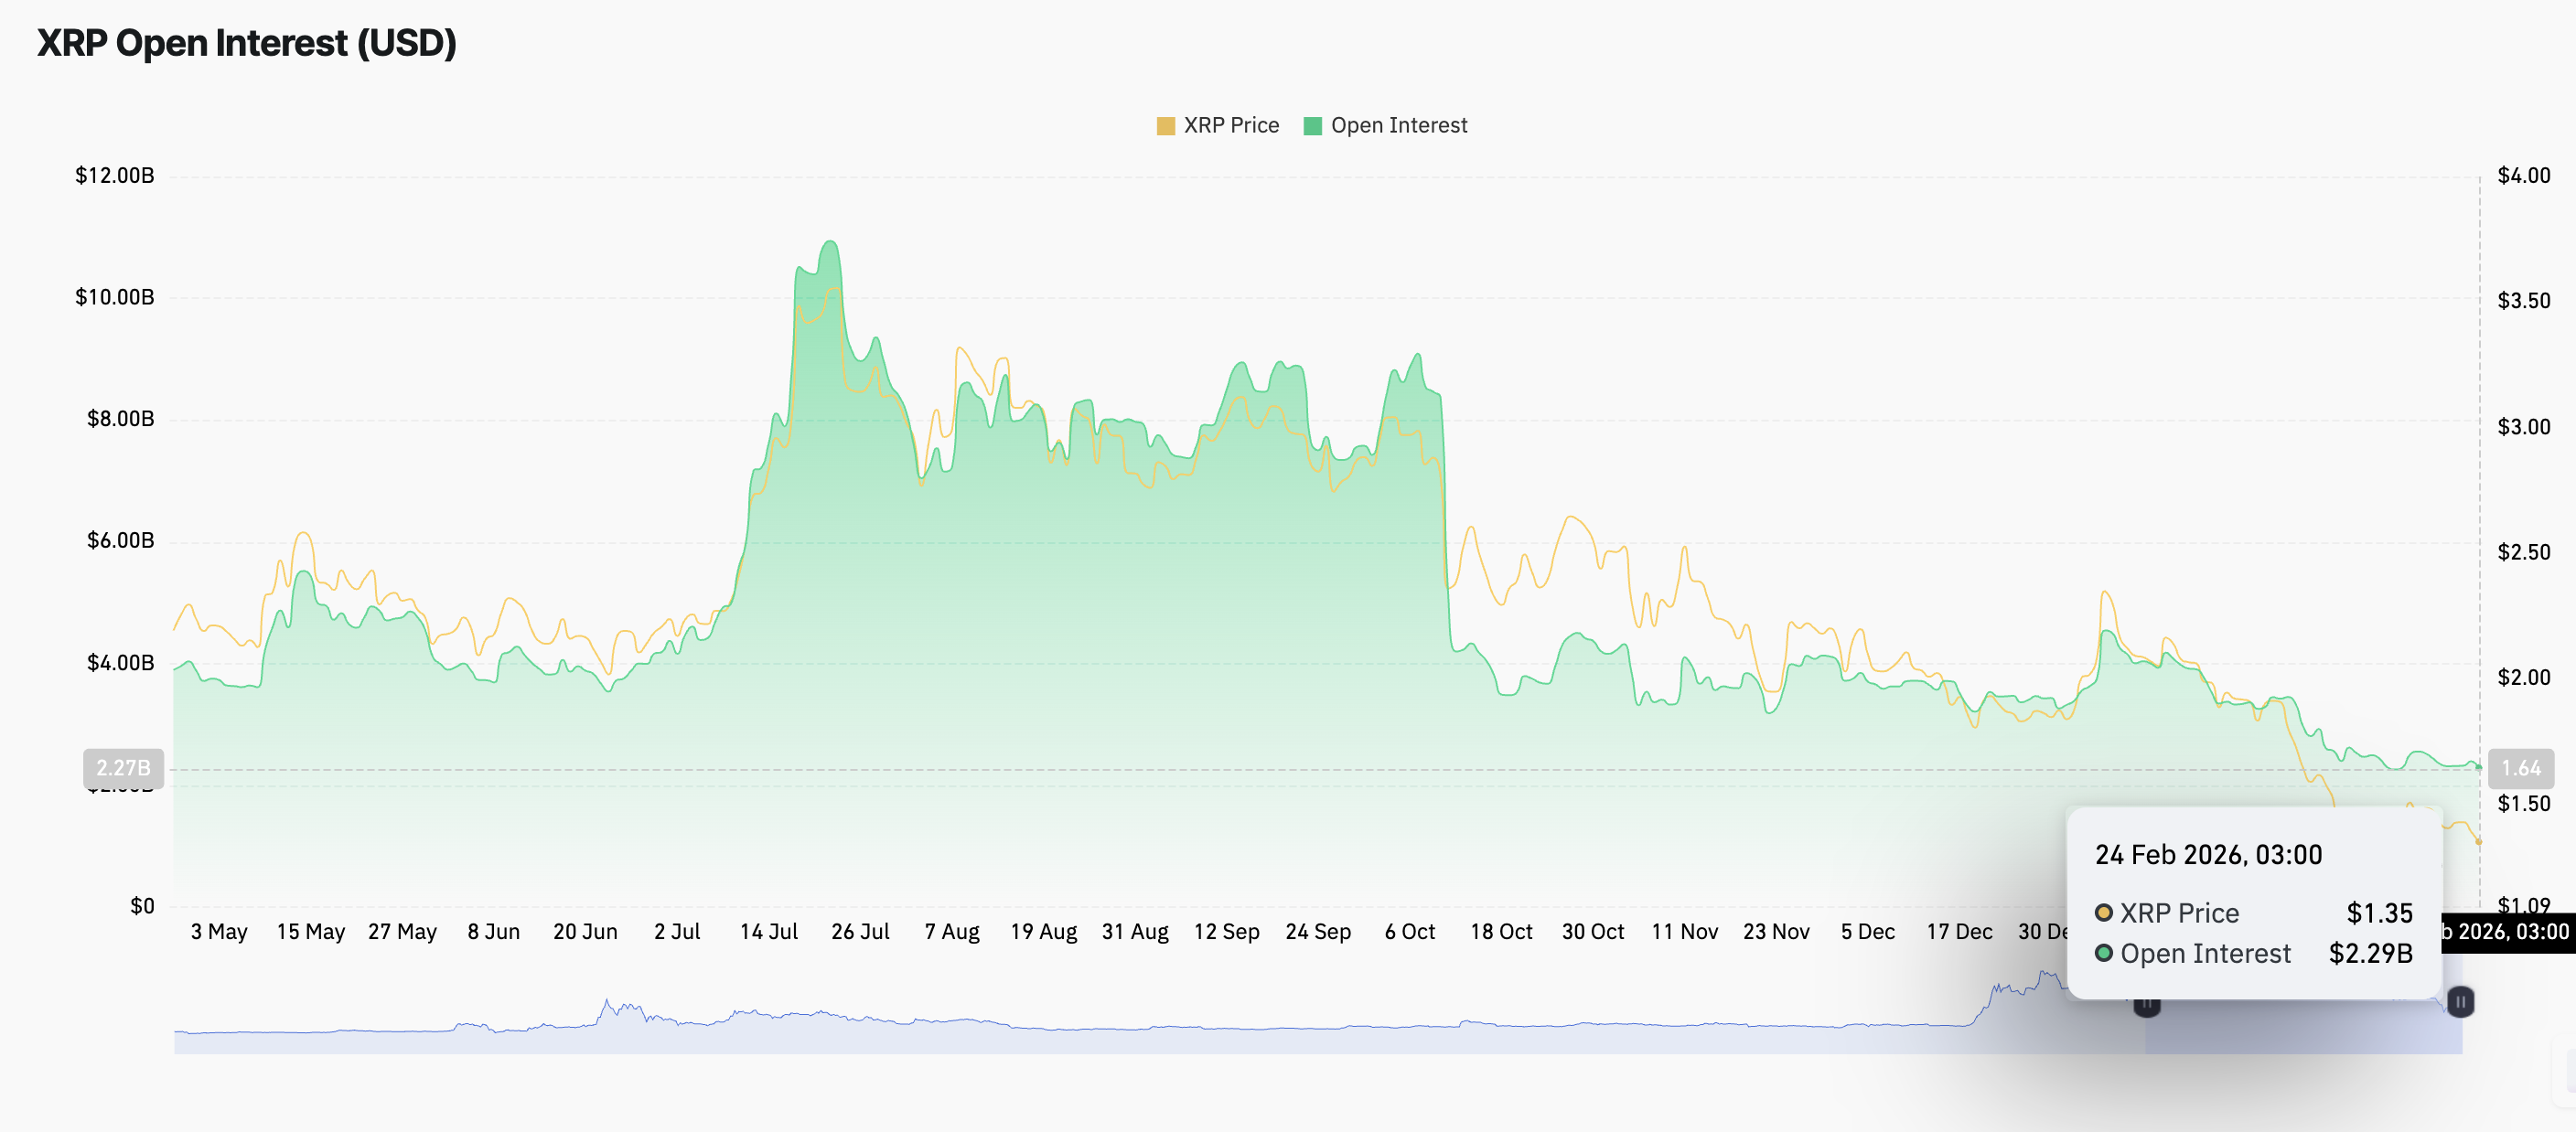
- Retail demand remains on the back foot, with futures Open Interest falling to $2.29 billion on Tuesday.
Ripple (XRP) is edging lower, trading above its intraday low of $1.32 at the time of writing on Tuesday. The decline from its weekly opening of $1.39 reflects heightened volatility in the broader cryptocurrency market, accentuated by tariff-triggered uncertainty.
Investors in risk assets remain on edge as the United States (US) trade partners brace for a fresh 10% 150-day temporary tariff on Tuesday, which could also be raised to 15%. The change in tariff policy comes after the Supreme Court struck down earlier duties imposed by President Donald Trump aimed at reducing the trade deficit.
Meanwhile, XRP continues to trade under heavy pressure, weighed down by weak technical, risk-off sentiment in the broader institutional space and low retail demand.
XRP slides amid cooling ETF demand
The prevailing risk-off sentiment has seen investors remain on the sidelines, resulting in muted activity in the XRP spot Exchange-Traded Funds (ETF) market. According to SoSoValue, XRP ETFs have continued to face subdued activity, with no flows since Friday. Cumulative inflows average $1.23 billion, with net assets under management at $875 million.
At the same time, the derivatives market is extending its weakness, as futures Open Interest (OI) falls to $2.29 billion on Tuesday, from $2.40 billion the previous day. The OI has persistently declined from the record $10.94 billion in July, which also coincided with the all-time high of $3.66, undermining retail interest in the remittance token.
Technical outlook: XRP risks a 5% decline amid weak technicals
XRP hovers at $1.33 on the daily chart, held down by a prevailing bearish bias. The remittance sits well below the 50-day Exponential Moving Average (EMA), 100- and 200-day EMAs, clustered between $1.64 and $2.08, underscoring a dominant downward trend.
Meanwhile, the Moving Average Convergence Divergence (MACD) line remains above the signal line, limiting XRP to modest upside corrections within a broader bearish context. The Relative Strength Index (RSI) near 34 signals weak momentum, but it is not oversold yet.
-1771940820859-1771940820860.png)
On the other hand, immediate resistance emerges at the recent reaction high near $1.51, where prior rebounds stalled, followed by the 50-day EMA around $1.64. Still, initial support is seen around $1.30, the latest closing low, with a break exposing the psychological $1.25 region as the next bearish objective. Sustained trading below these levels would keep sellers in control and maintain pressure toward lower daily lows.
Open Interest, funding rate FAQs
Higher Open Interest is associated with higher liquidity and new capital inflow to the market. This is considered the equivalent of increase in efficiency and the ongoing trend continues. When Open Interest decreases, it is considered a sign of liquidation in the market, investors are leaving and the overall demand for an asset is on a decline, fueling a bearish sentiment among investors.
Funding fees bridge the difference between spot prices and prices of futures contracts of an asset by increasing liquidation risks faced by traders. A consistently high and positive funding rate implies there is a bullish sentiment among market participants and there is an expectation of a price hike. A consistently negative funding rate for an asset implies a bearish sentiment, indicating that traders expect the cryptocurrency’s price to fall and a bearish trend reversal is likely to occur.
(The technical analysis of this story was written with the help of an AI tool.)
추천 기사


