

Pi Network Price Forecast: PI maintains stability as technical outlook remains uncertain
- Pi Network holds above $0.1600 on Wednesday, following a 2% boost on Monday.
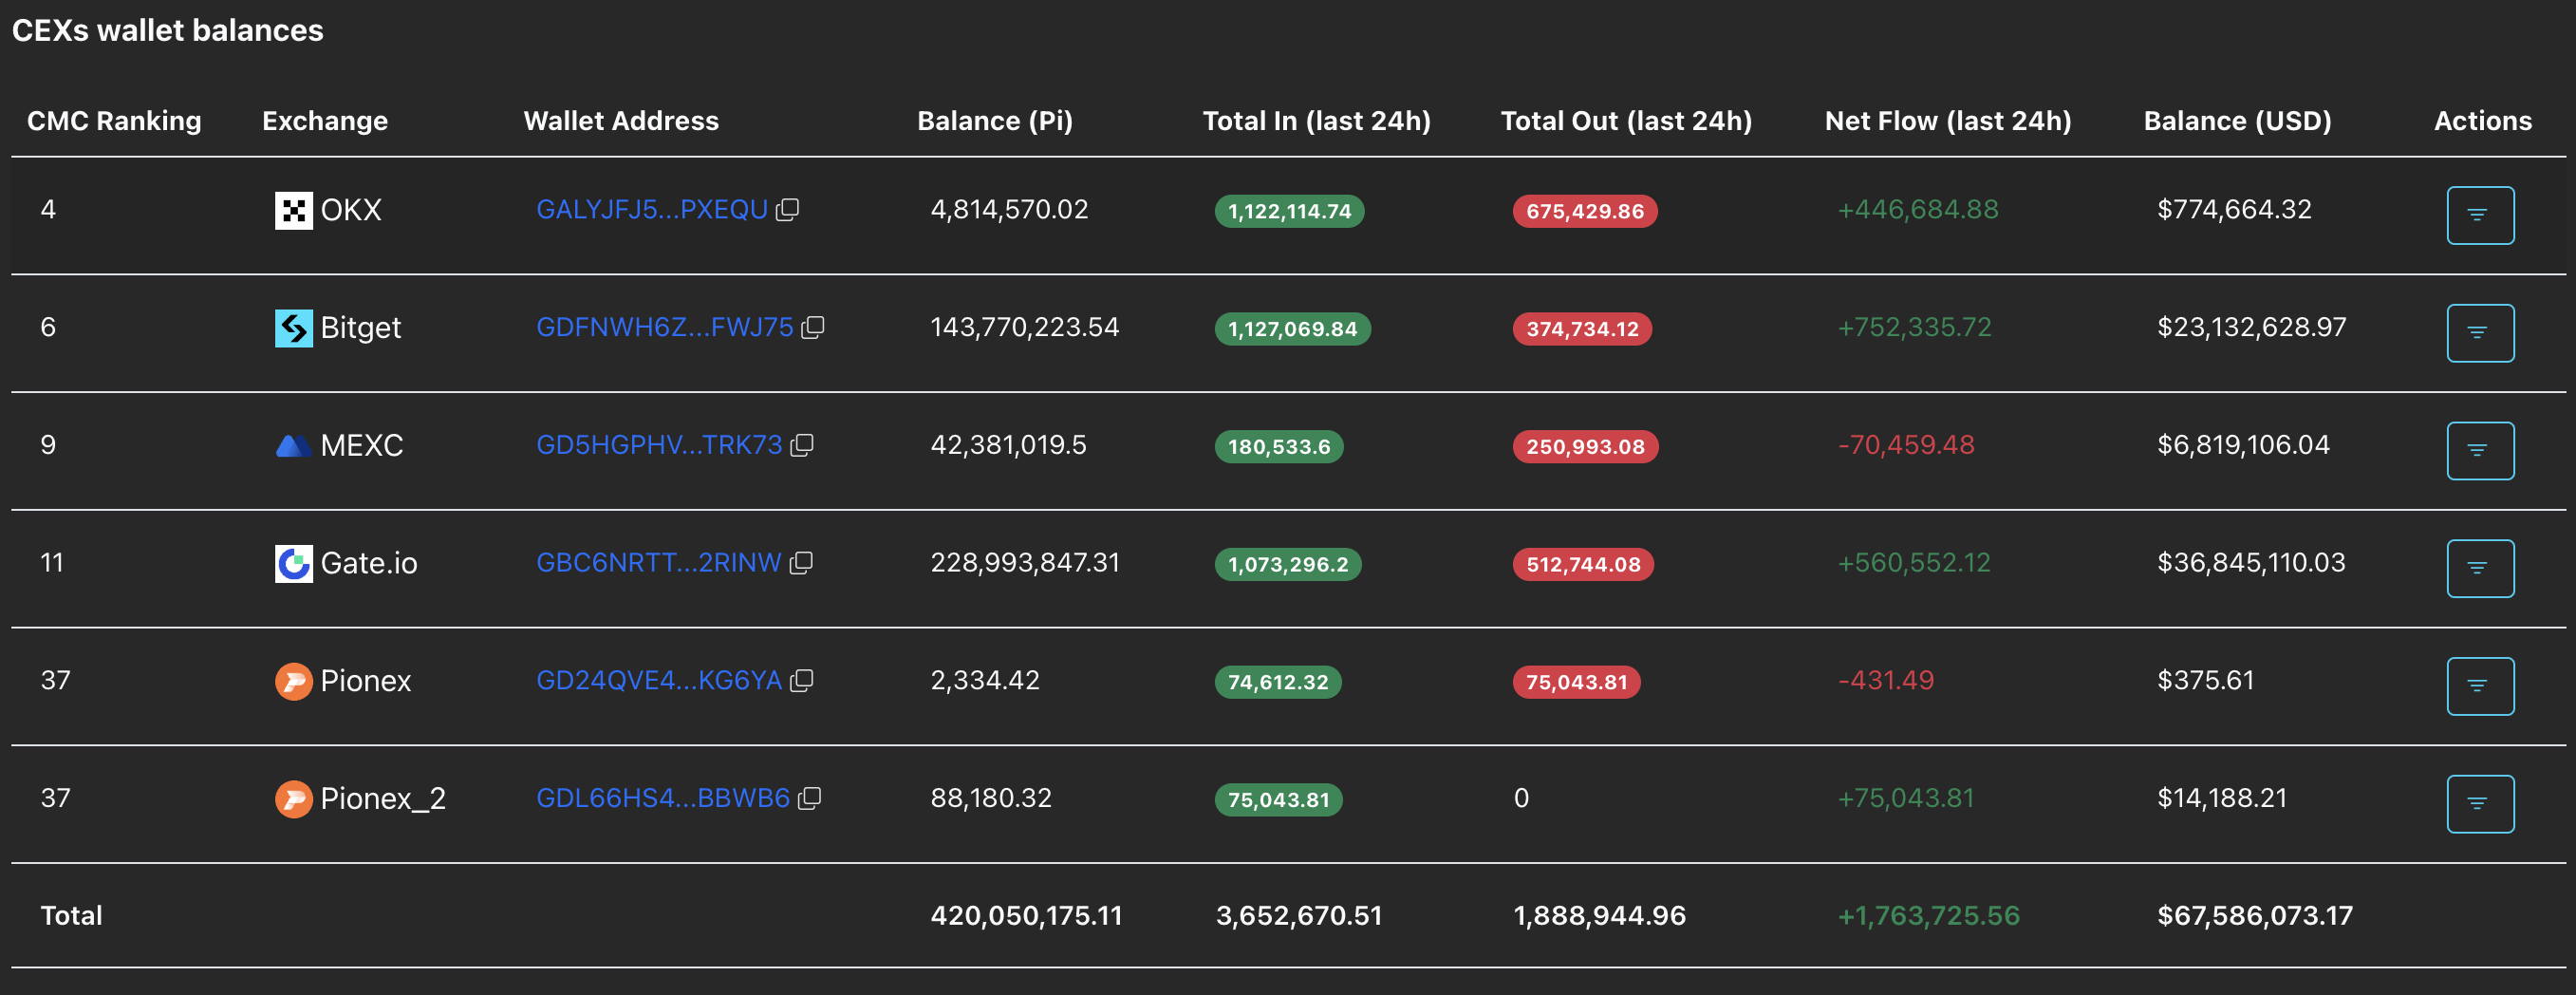
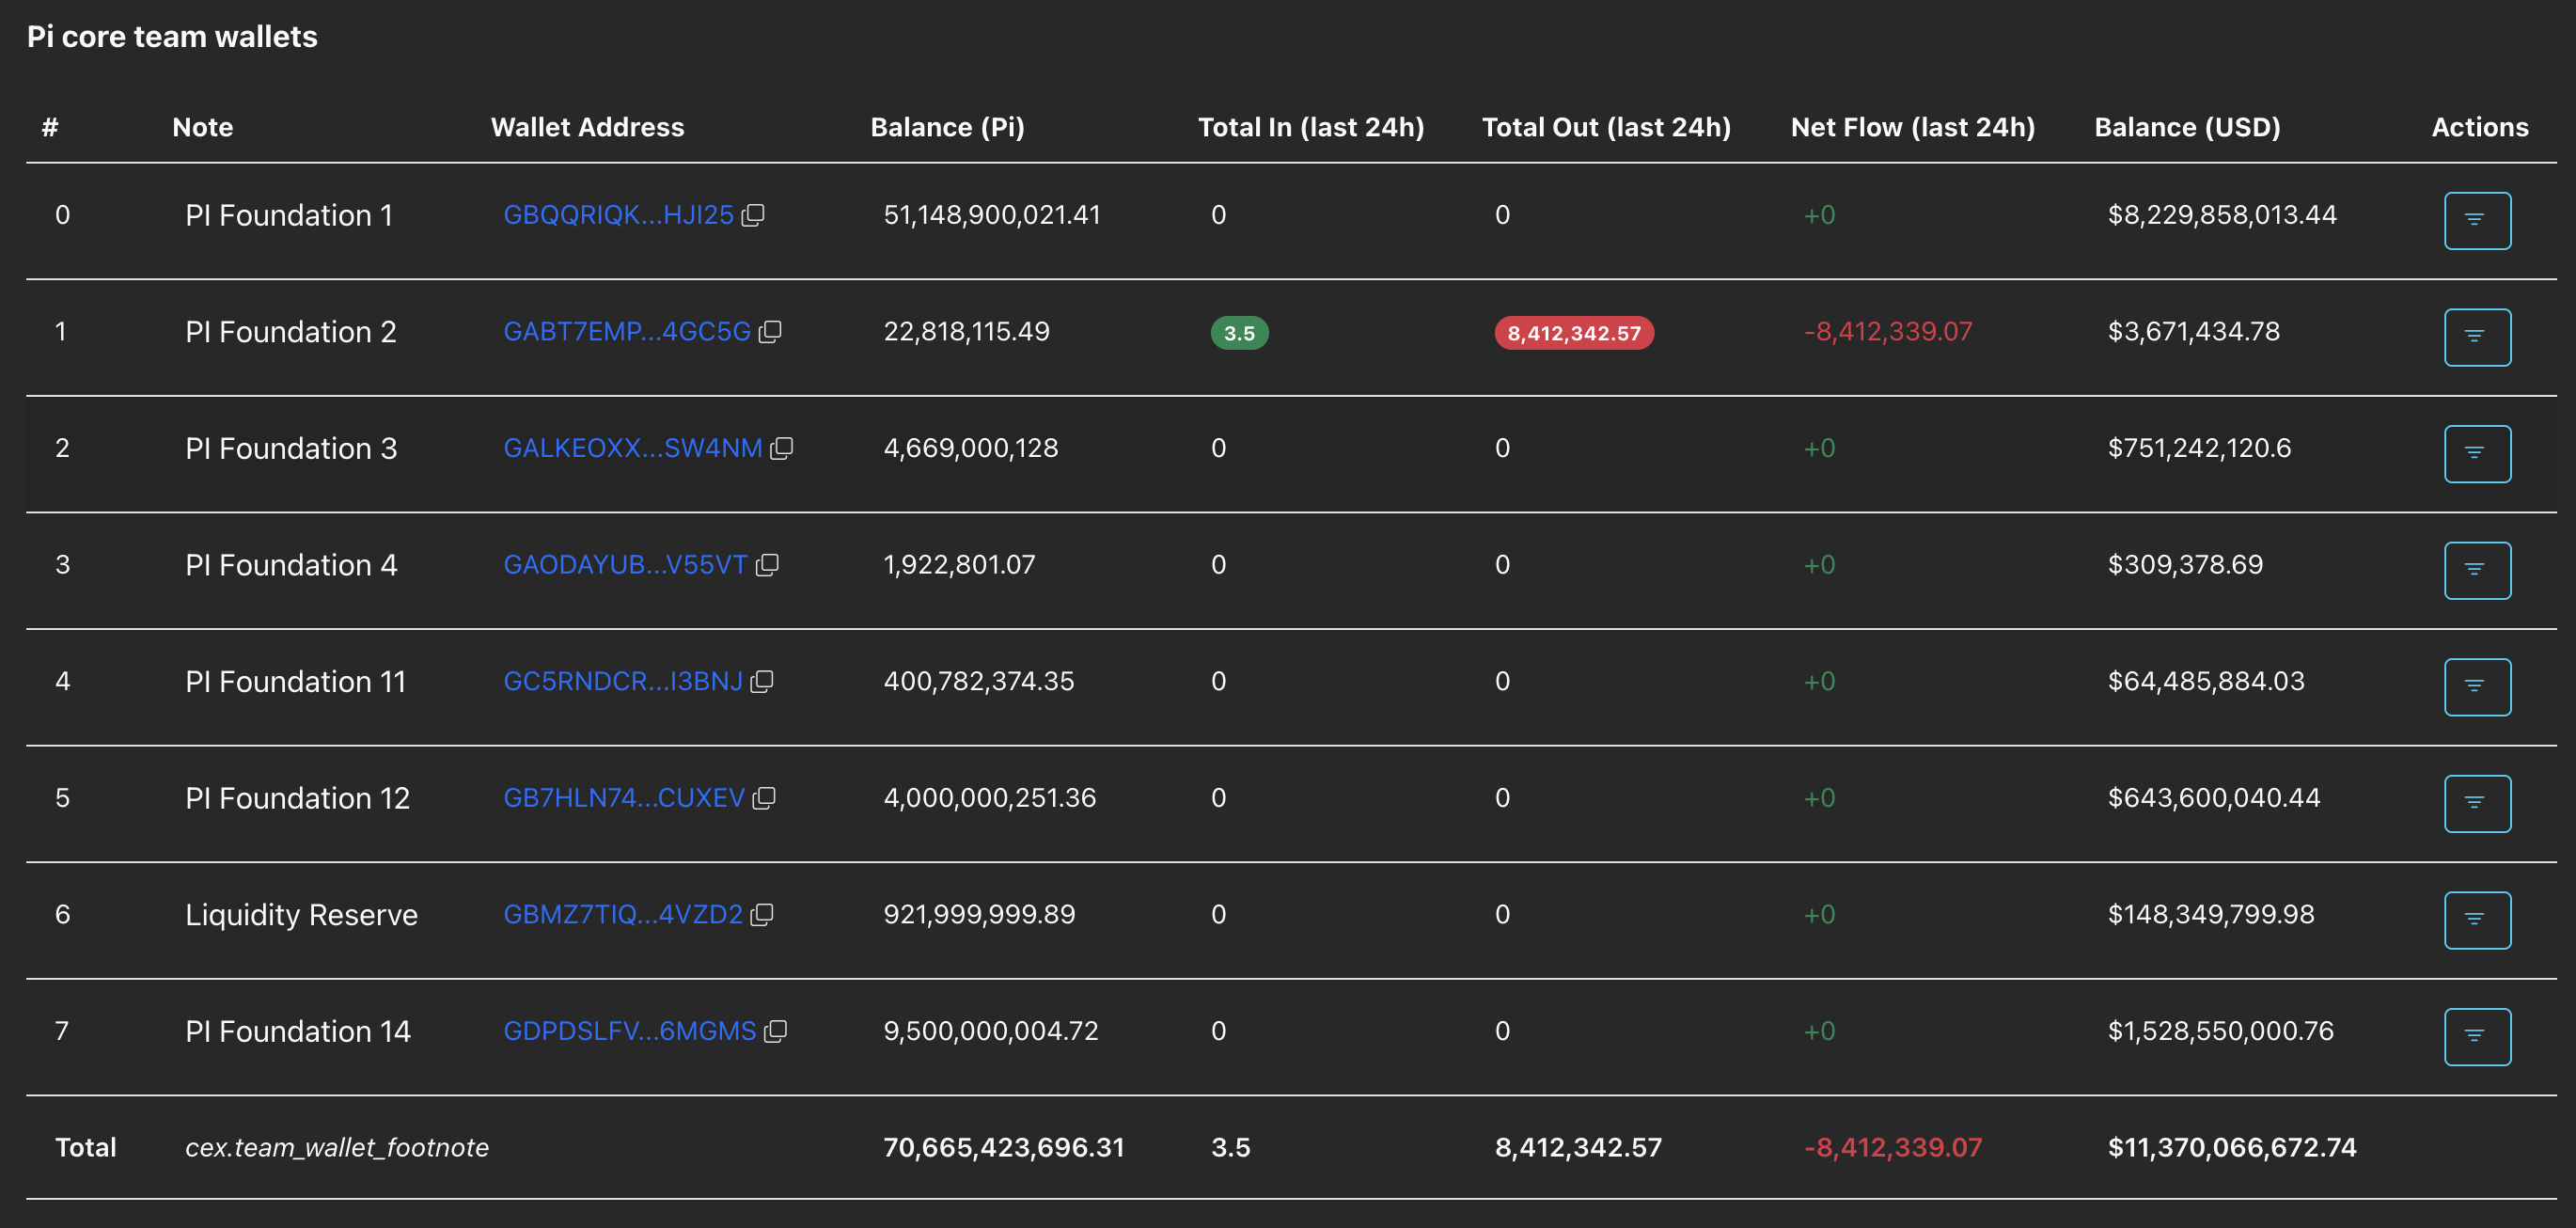
- PiScan data indicates consistent outflows from the Pi core team and increasing deposits on exchanges that support the PI token.
- The technical outlook for Pi Network remains mixed, keeping the crucial support in focus.
Pi Network (PI) trades above $0.1600 at press time on Wednesday, struggling to extend the 2% gains from Monday. A steady increase in deposits at exchanges supporting PI tokens and the trimming of Pi Foundation holdings add to downside pressure. The technical outlook remains mixed, with PI holding above a crucial support level and the RSI indicator still oversold.
Large deposits signal increased bearish pressure
PiScan data indicate a sharp decline in confidence among both holders and the core team amid substantial PI token outflows. On the retail side, Centralized Exchanges (CEXs) recorded a net flow of 1.76 million PI tokens over the last 24 hours, indicating a broader risk-off sentiment among mainnet users.
Meanwhile, the Pi core team wallets recorded an outflow of 8.41 million PI tokens during the same period, further intensifying supply pressure. A steady increase in deposits and outflows after Monday’s recovery suggests a likely race to take profits among holders.
Pi Network struggles to extend recovery
Pi Network held above the December 18 low at $0.1533, avoiding a bearish close. An easing of selling pressure earlier this week led to a more than 2% rise on Monday, pushing PI above $0.1600.
However, the short-term recovery is struggling to gain momentum, risking a reversal to $0.1533. If PI slips a daily close below this level, it would open the door to the S1 Pivot Point at $0.1327.
The technical indicators on the daily chart flash mixed signals. The Relative Strength Index (RSI) at 39 remains oversold, suggesting heightened bearish pressure. However, the Moving Average Convergence Divergence (MACD) is approaching the signal line, suggesting a potential crossover that could signal renewed bullish momentum.
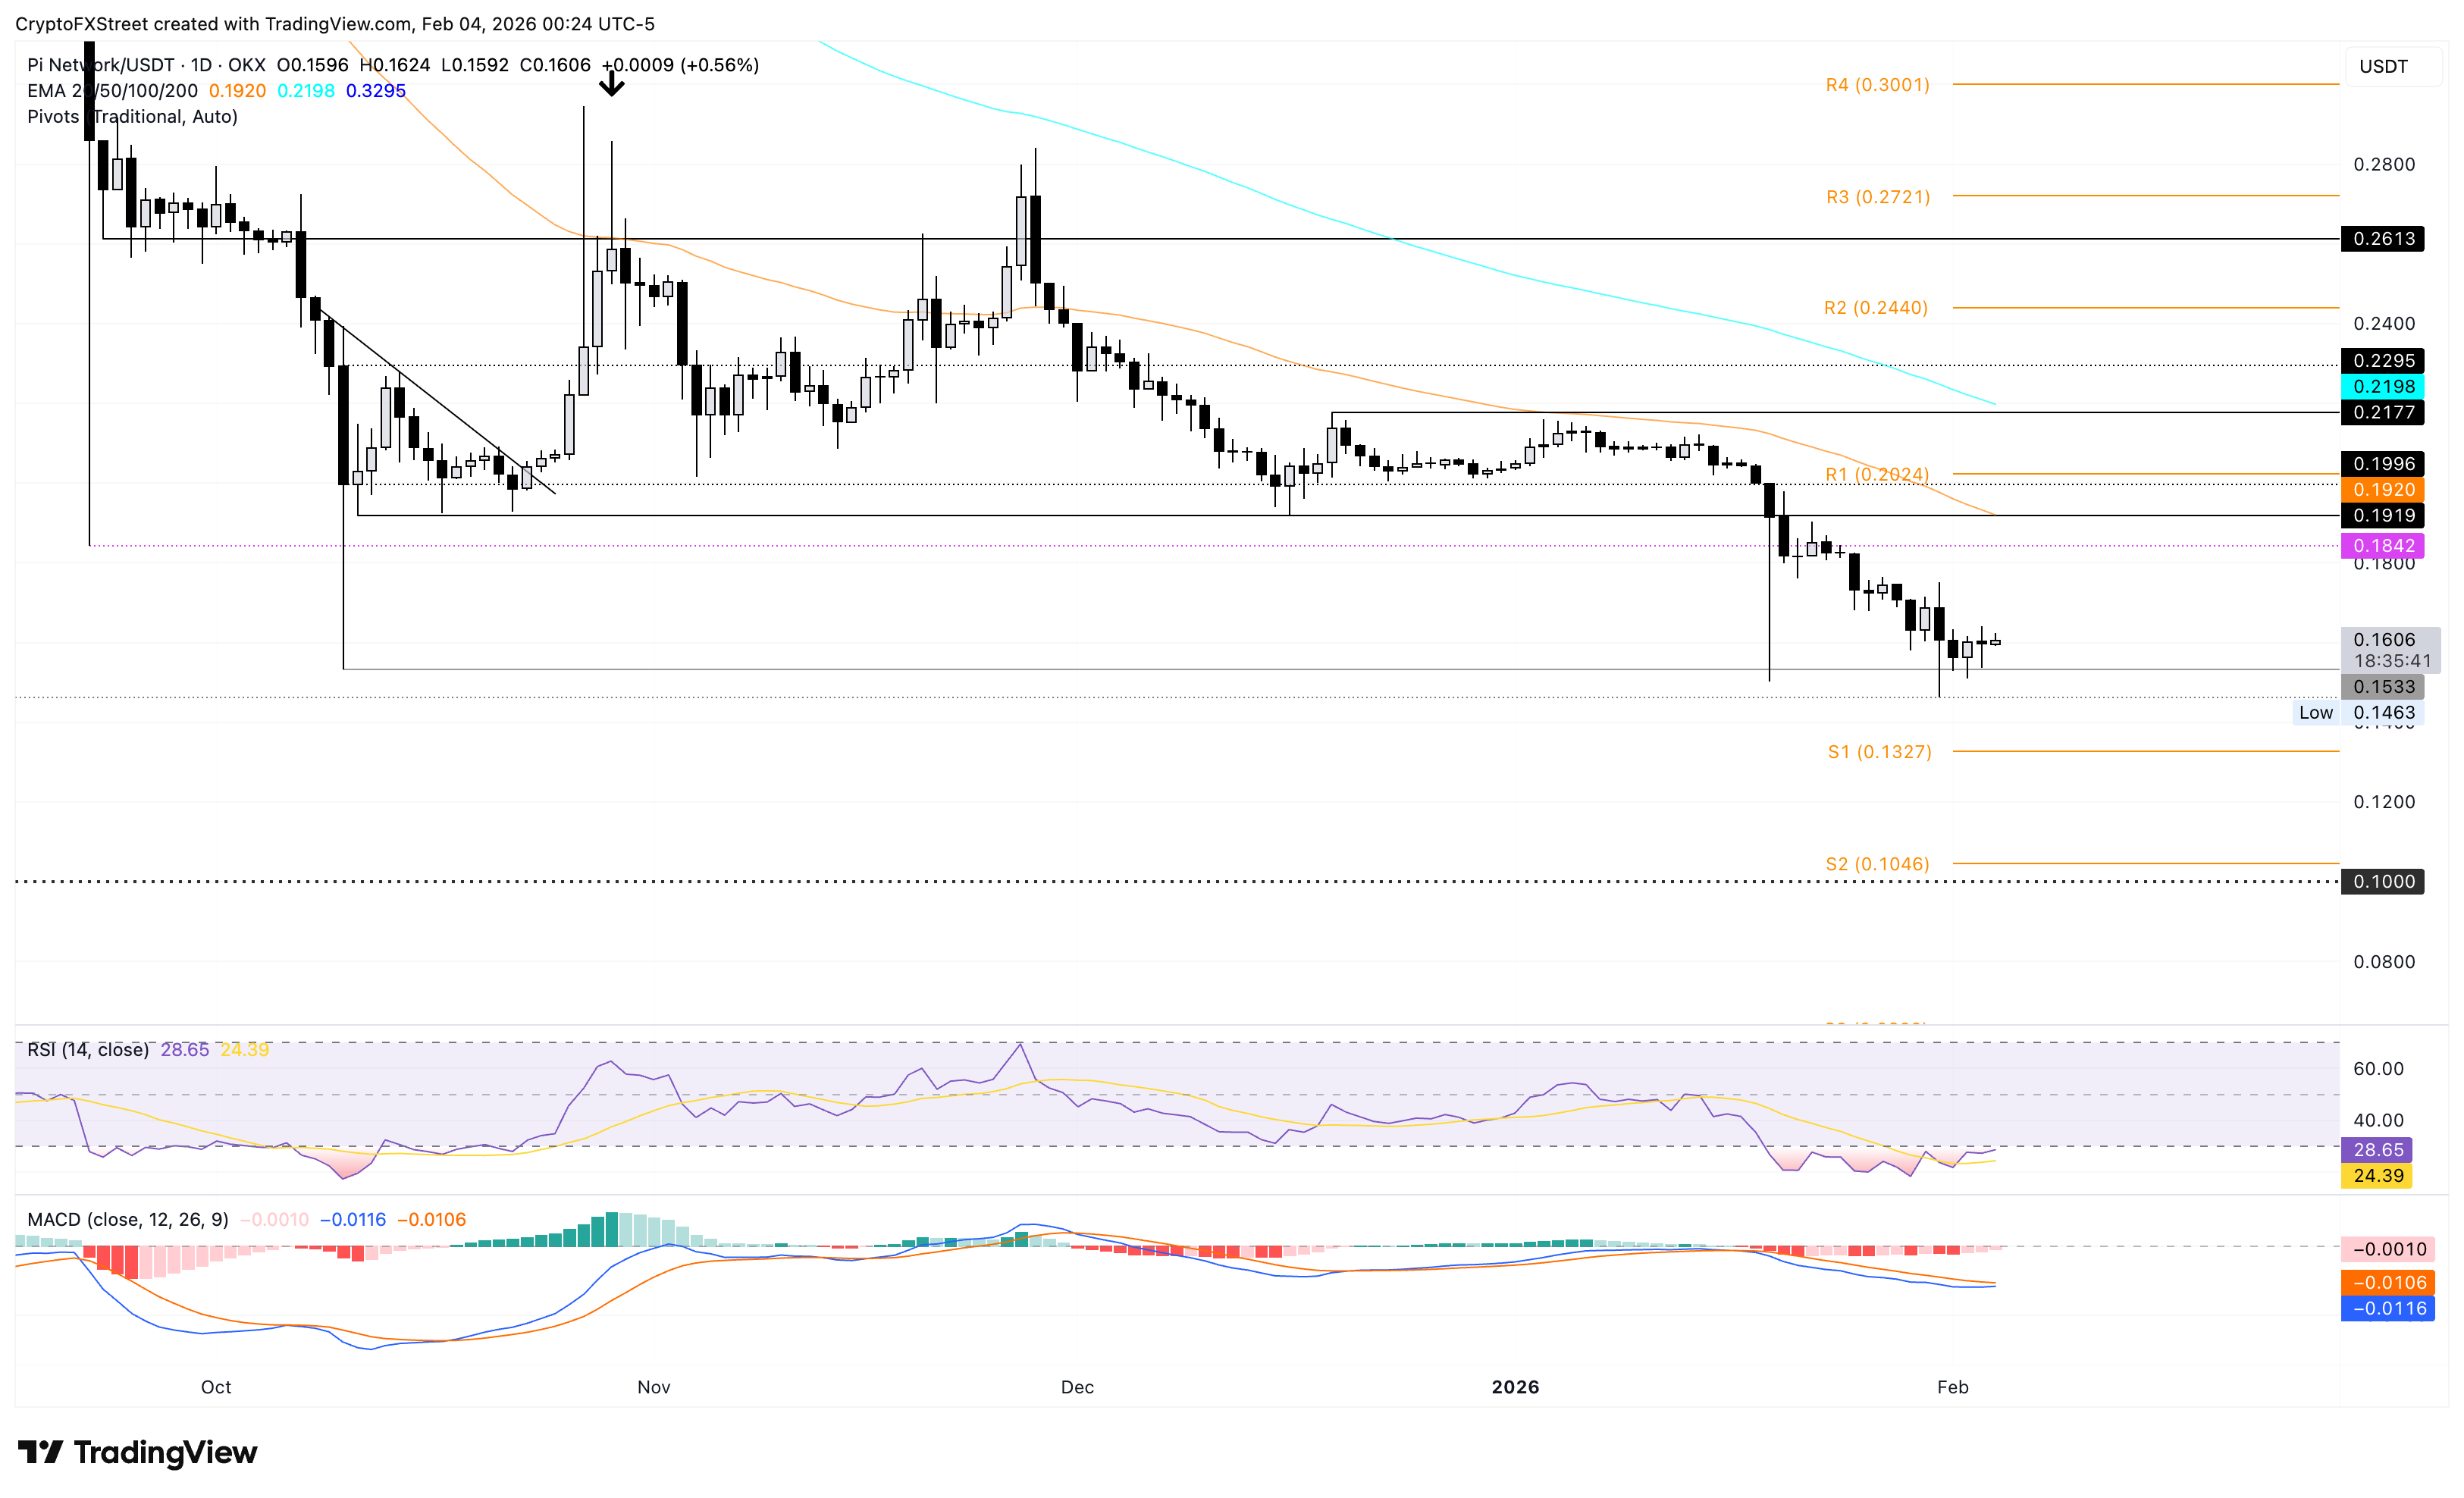
On the upside, a recovery run in PI could target the 50-day Exponential Moving Average (EMA) at $0.1920, close to the October 11 low at $0.1919, which is a support-turned-resistance level.
Bitcoin, altcoins, stablecoins FAQs
Bitcoin is the largest cryptocurrency by market capitalization, a virtual currency designed to serve as money. This form of payment cannot be controlled by any one person, group, or entity, which eliminates the need for third-party participation during financial transactions.
Altcoins are any cryptocurrency apart from Bitcoin, but some also regard Ethereum as a non-altcoin because it is from these two cryptocurrencies that forking happens. If this is true, then Litecoin is the first altcoin, forked from the Bitcoin protocol and, therefore, an “improved” version of it.
Stablecoins are cryptocurrencies designed to have a stable price, with their value backed by a reserve of the asset it represents. To achieve this, the value of any one stablecoin is pegged to a commodity or financial instrument, such as the US Dollar (USD), with its supply regulated by an algorithm or demand. The main goal of stablecoins is to provide an on/off-ramp for investors willing to trade and invest in cryptocurrencies. Stablecoins also allow investors to store value since cryptocurrencies, in general, are subject to volatility.
Bitcoin dominance is the ratio of Bitcoin's market capitalization to the total market capitalization of all cryptocurrencies combined. It provides a clear picture of Bitcoin’s interest among investors. A high BTC dominance typically happens before and during a bull run, in which investors resort to investing in relatively stable and high market capitalization cryptocurrency like Bitcoin. A drop in BTC dominance usually means that investors are moving their capital and/or profits to altcoins in a quest for higher returns, which usually triggers an explosion of altcoin rallies.
추천 기사


