

Dogecoin Price Forecast: Dogecoin Price Forecast: DOGE recovers despite shrinking Open Interest
- Dogecoin gains over 6% on Friday, targeting the 50-day EMA resistance.
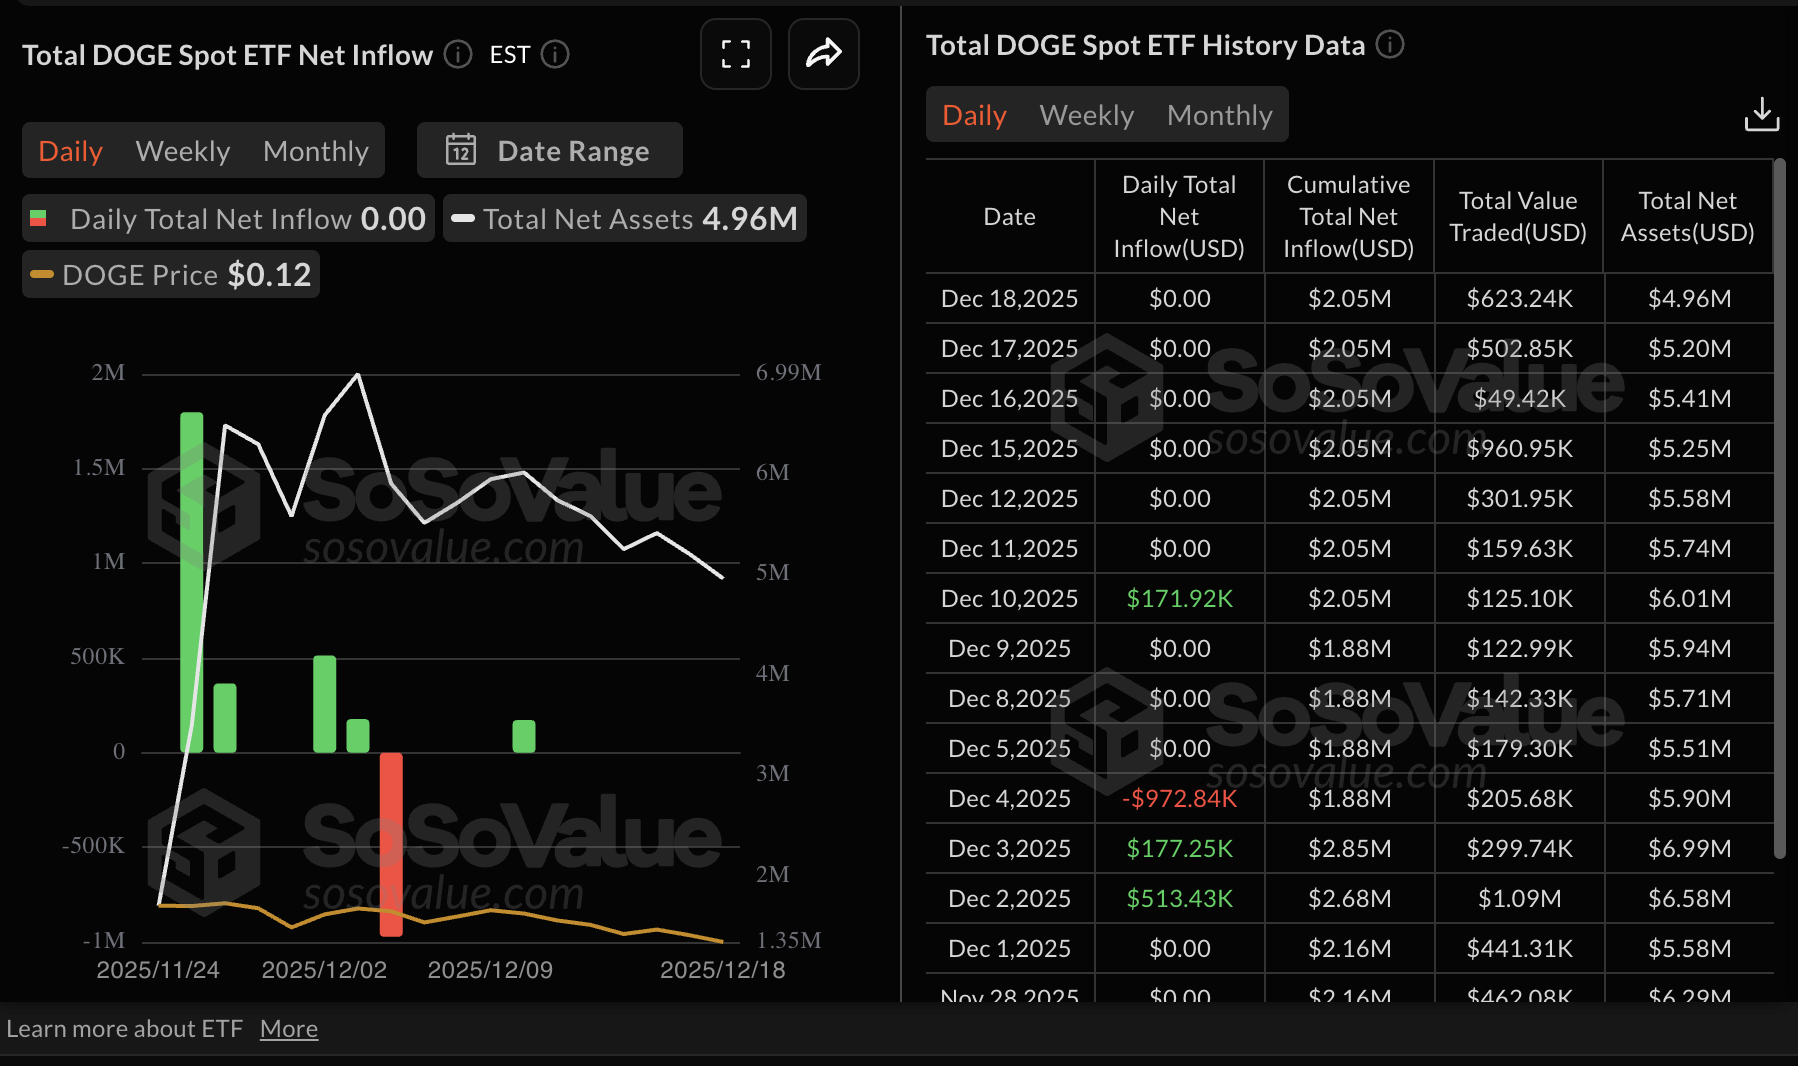
- DOGE spot ETFs take a backseat, with no inflows recorded since December 10.
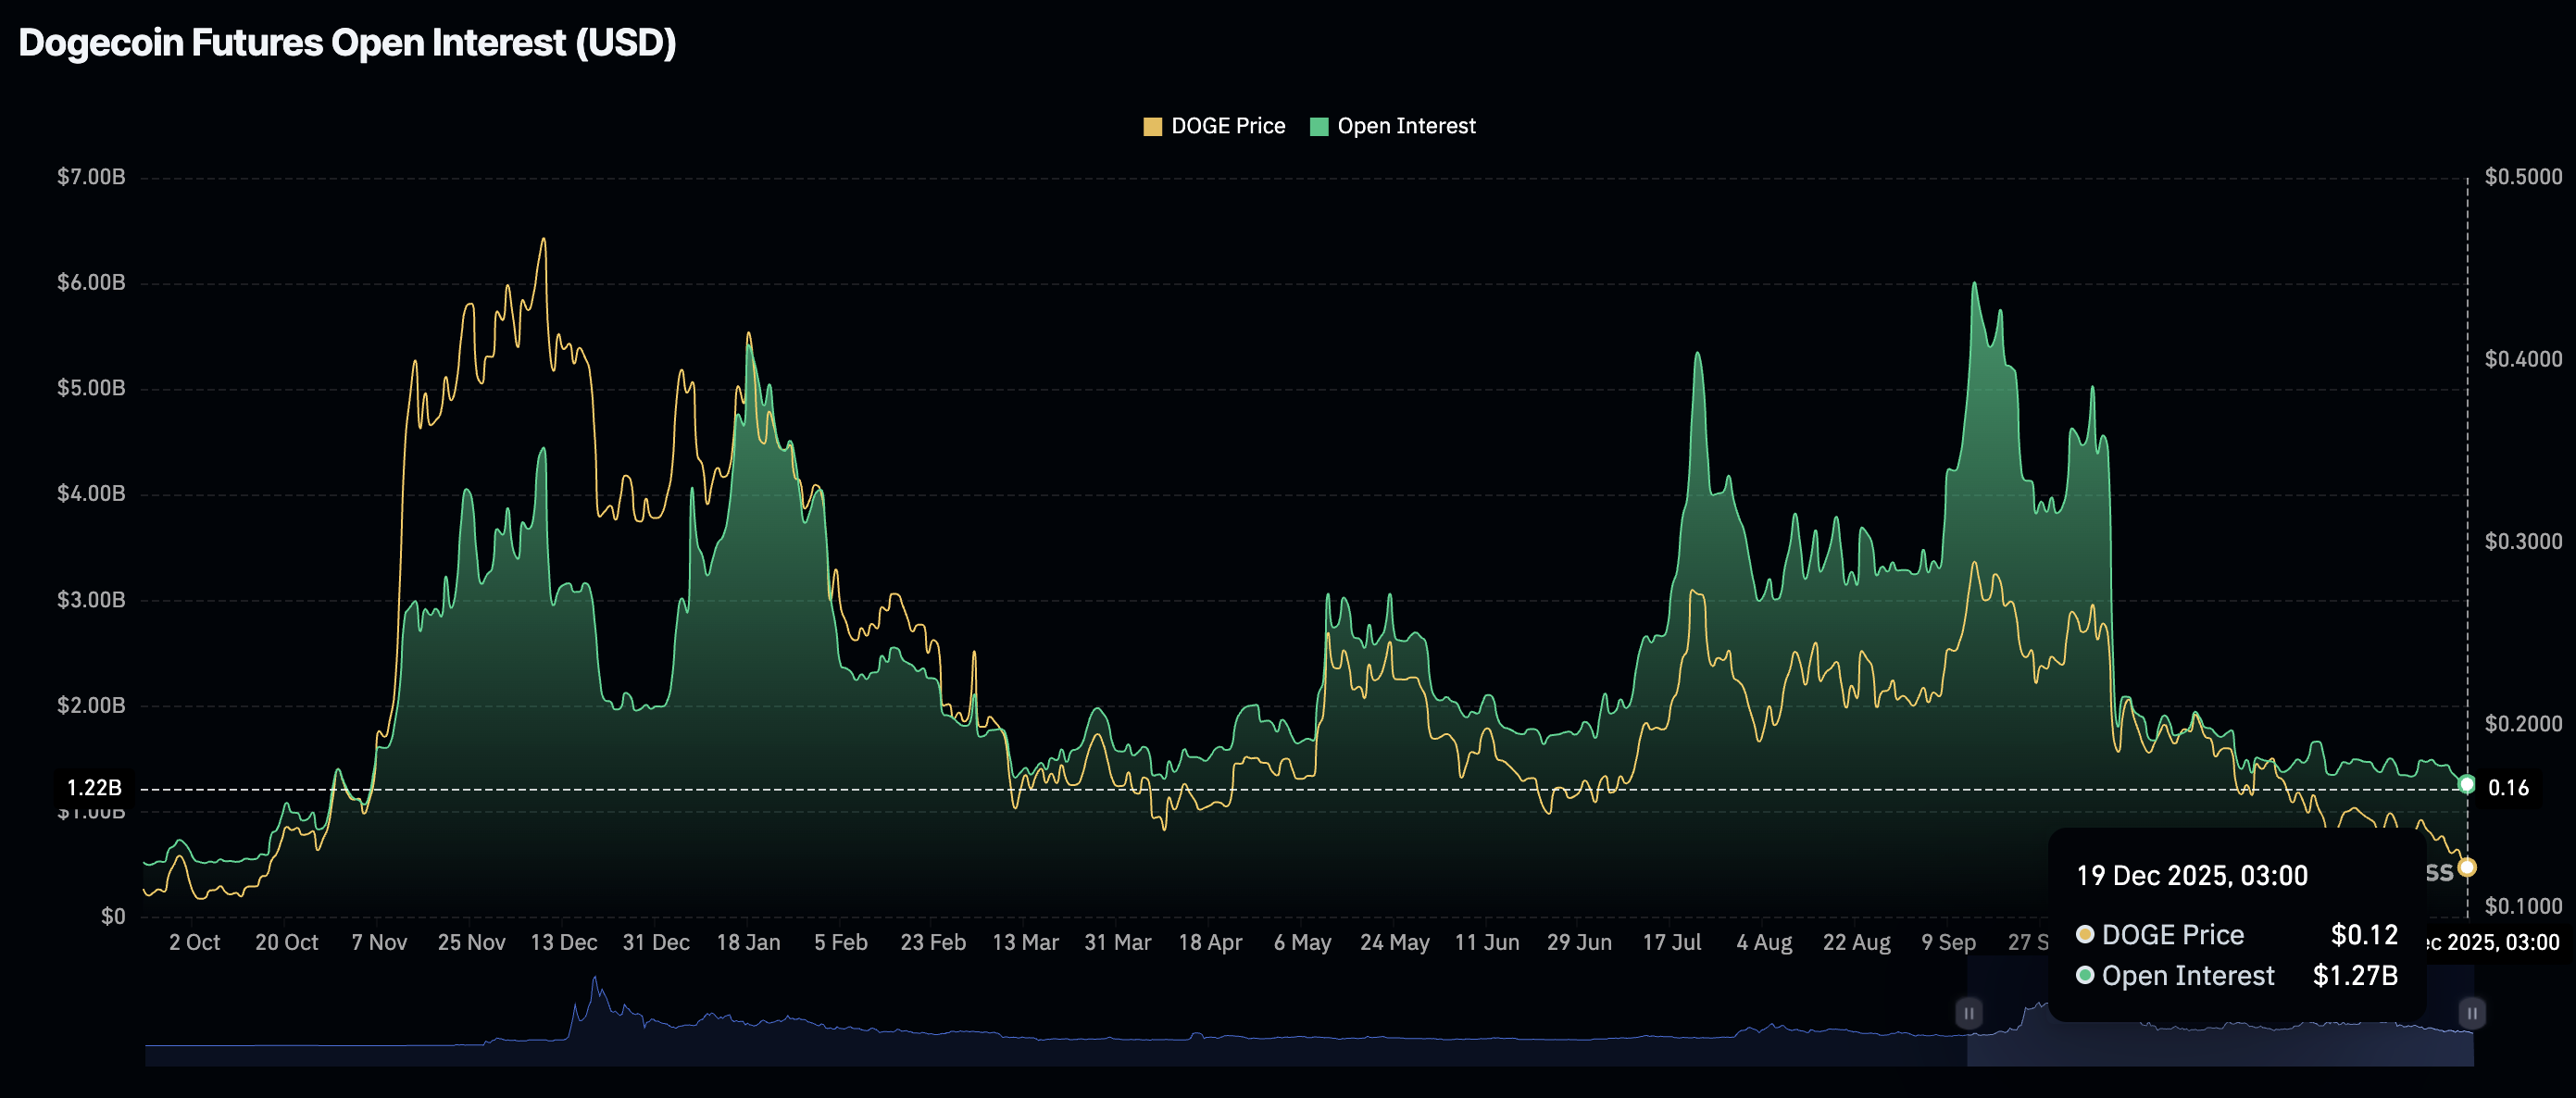
- A weak derivatives market could cap rebounds, with futures Open Interest declining to $1.27 billion.
Dogecoin (DOGE) is edging higher, trading above $0.1300 at the time of writing on Friday, reflecting positive sentiment across the cryptocurrency market.
The largest meme coin regained momentum following the release of the United States (US) Consumer Price Index (CPI) data on Thursday.
According to the Bureau of Labor Statistics (BLS), inflation increased 2.7% annually in November, falling short of analysts’ expectations of 3.1%. The core CPI, which excludes the volatile prices of energy and food, rose 2.6% during the same period. The reading came in below market expectations of 3%.
The 6% increase in Dogecoin’s price shows that investors are regaining appetite for riskier assets such as cryptocurrencies. However, traders should temper their expectations, given a lagging Dogecoin derivatives market that could dampen the recovery ahead of the New Year.
Dogecoin faces declining retail demand and low institutional interest
Interest in Dogecoin has significantly shrunk since the October 10 flash crash, with futures Open Interest (OI) falling by approximately 71% to $1.21 billion on Friday from $4.4 billion.
The meme coin had previously recorded steady OI growth, reaching $6 billion on September 14. A price increase to $0.3068 from April’s $0.1298 accompanied the upswing in OI, emphasising the role that the retail market plays in driving value growth. However, with OI significantly suppressed, it could be an uphill task for DOGE to sustain the ongoing recovery.
Meanwhile, institutional interest in Dogecoin spot Exchange Traded Funds (ETFs) has taken a backseat. According to SoSoValue data, Dogecoin ETFs have not recorded inflows since December 10’s $172,000.
The cumulative net inflow stands at $205 million, and net assets at $4.96 million. Two DOGE spot ETFs are licensed in the United States (US), including Grayscale’s GDOG and Bitwise’s BWOW.
Technical outlook: Can Dogecoin sustain recovery?
Dogecoin is trading at $0.1300 at the time of writing on Friday, with 50-day Exponential Moving Average (EMA), 100-EMA and 200-day EMA, sloping downward and preserving a bearish bias. The Moving Average Convergence Divergence (MACD) indicator on the daily chart is modestly negative, as highlighted by the blue MACD line holding below the signal line.
A break above the 50-day EMA at $1.544 could open the door for further gains above the 100-day EMA at $0.1745 and the 200-day EMA at $0.1909. The Relative Strength Index (RSI) on the same chart has risen to 38, signaling that bearish momentum is easing.
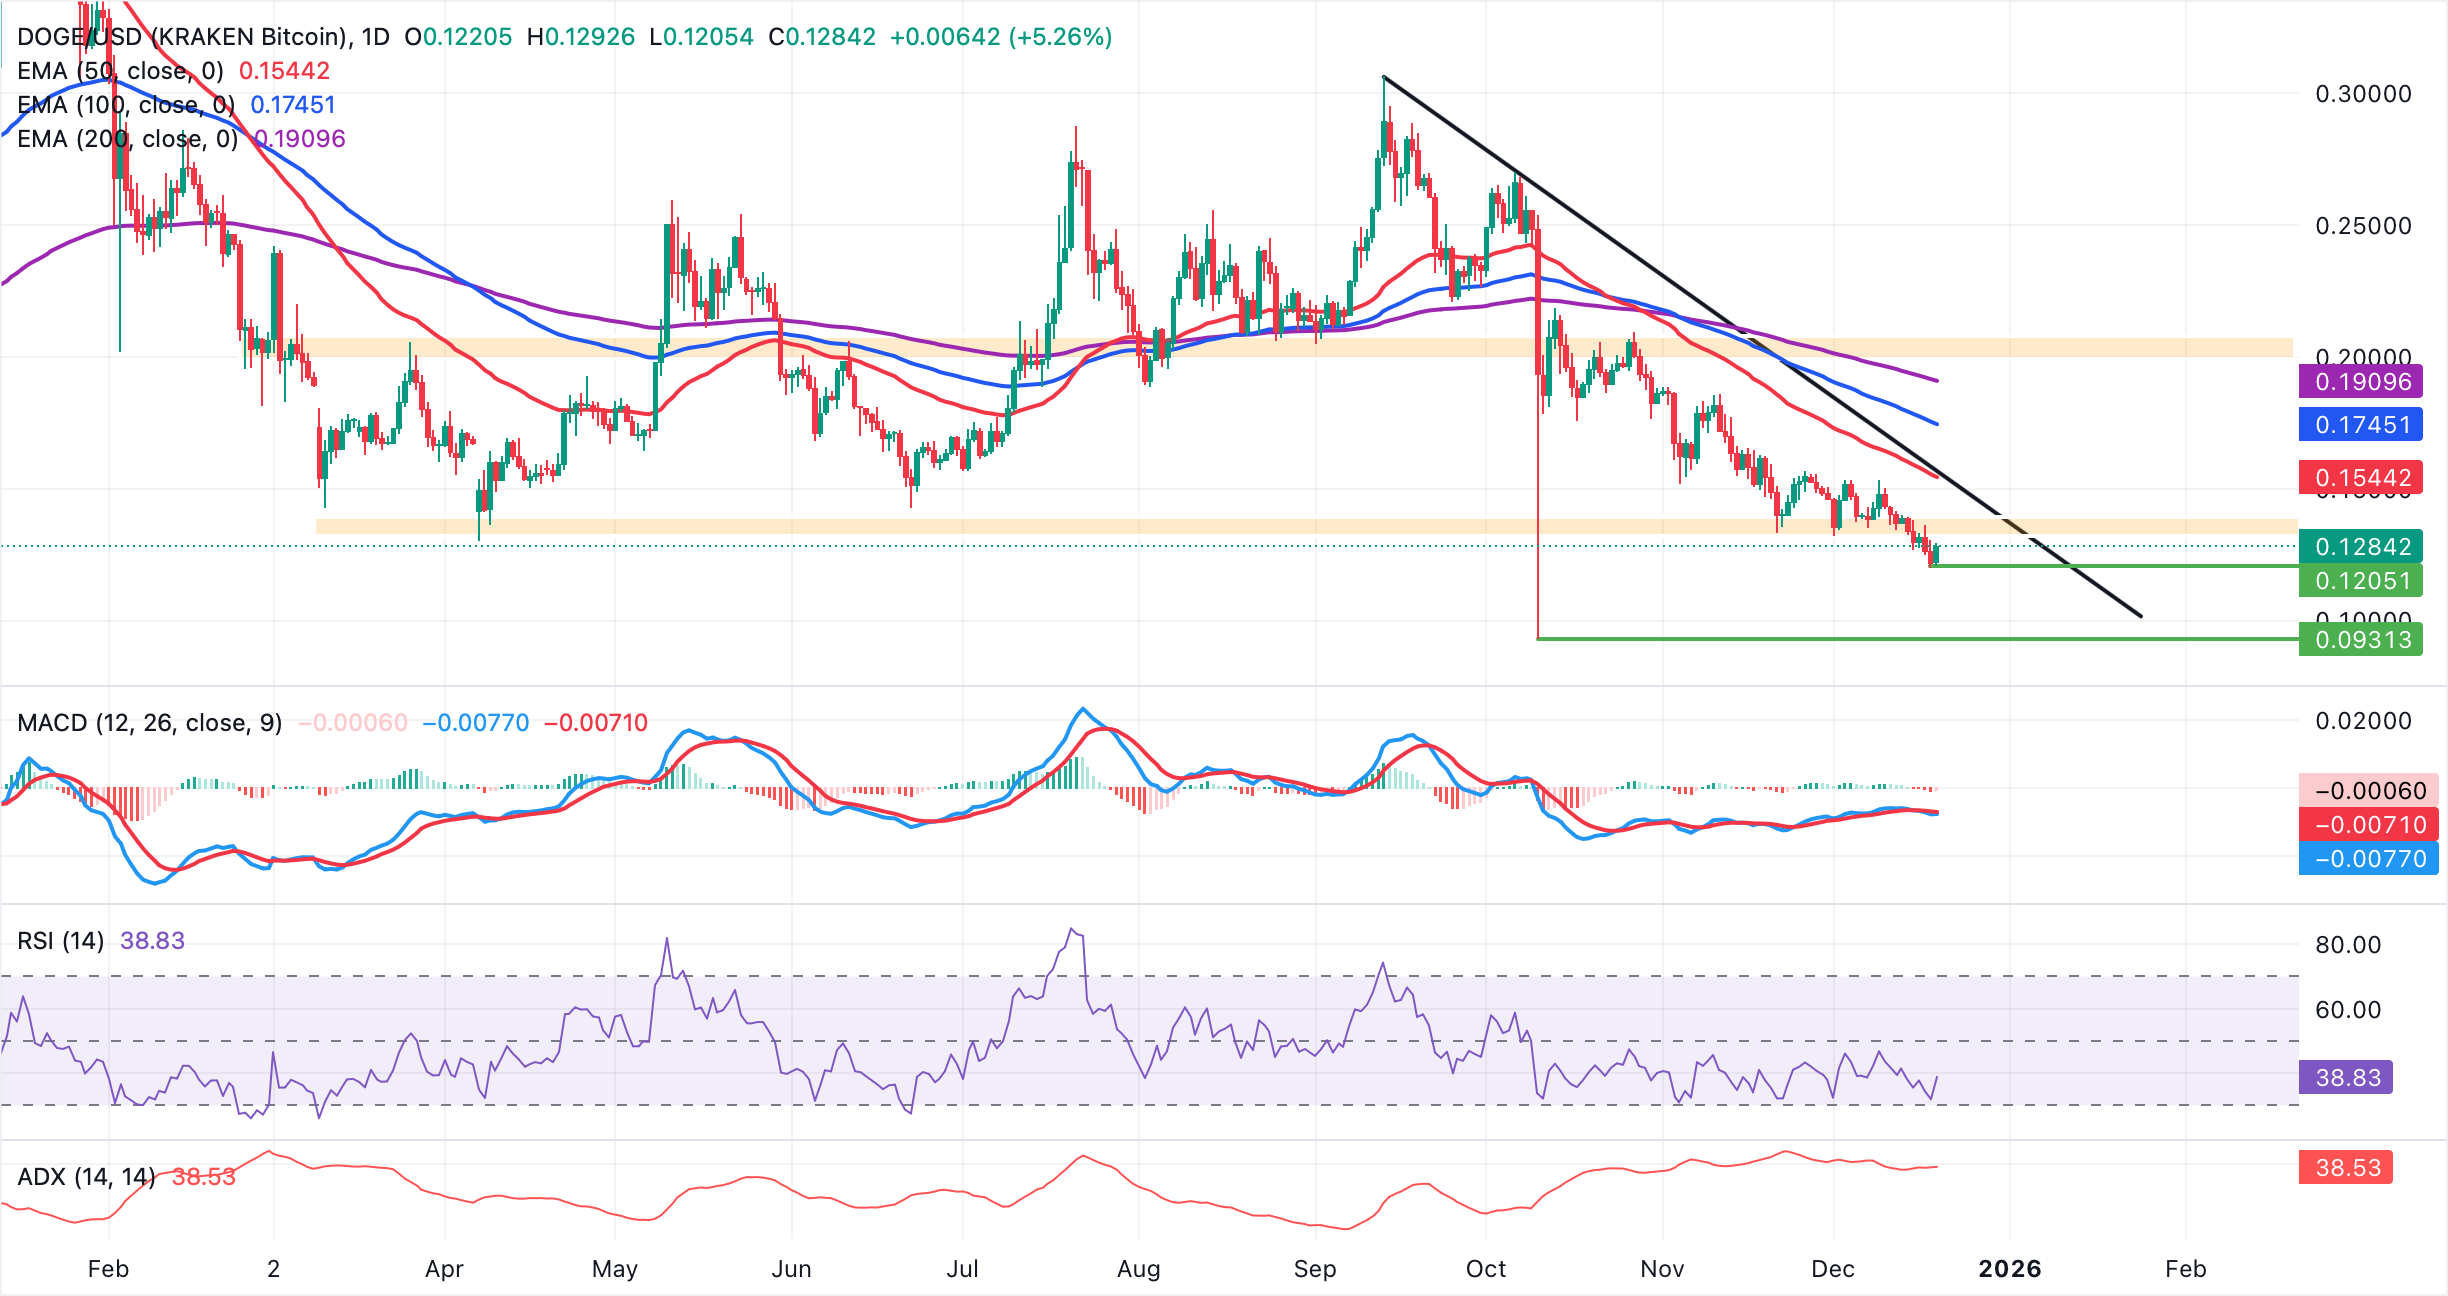
Still, the descending trend line from $0.3063 limits gains, with resistance seen at $0.1561. A daily close below support at $0.1205 could accelerate the downtrend toward the October low of $0.0931.
Cryptocurrency prices FAQs
Token launches influence demand and adoption among market participants. Listings on crypto exchanges deepen the liquidity for an asset and add new participants to an asset’s network. This is typically bullish for a digital asset.
A hack is an event in which an attacker captures a large volume of the asset from a DeFi bridge or hot wallet of an exchange or any other crypto platform via exploits, bugs or other methods. The exploiter then transfers these tokens out of the exchange platforms to ultimately sell or swap the assets for other cryptocurrencies or stablecoins. Such events often involve an en masse panic triggering a sell-off in the affected assets.
Macroeconomic events like the US Federal Reserve’s decision on interest rates influence crypto assets mainly through the direct impact they have on the US Dollar. An increase in interest rate typically negatively influences Bitcoin and altcoin prices, and vice versa. If the US Dollar index declines, risk assets and associated leverage for trading gets cheaper, in turn driving crypto prices higher.
Halvings are typically considered bullish events as they slash the block reward in half for miners, constricting the supply of the asset. At consistent demand if the supply reduces, the asset’s price climbs.
(The technical analysis of this story was written with the help of an AI tool)
추천 기사


