

Crypto Today: Bitcoin, Ethereum, XRP trade under pressure amid mixed technical signals
- Bitcoin holds above $90,000, paring losses as ETF outflows return.
- Ethereum faces headwinds below the 50-day EMA, reflecting risk-off sentiment among institutional investors.
- XRP trades sideways above its $2.00 support, as cumulative ETF inflows near $1 billion milestone.
Bitcoin (BTC) is trading above $90,000 at the time of writing on Tuesday amid sticky risk-off sentiment in the broader crypto market. Since the October 10 flash crash, shaky institutional interest and low retail demand have significantly weighed down the largest cryptocurrency by market capitalization, capping steady recovery toward $100,000.
Altcoins, including Ethereum (ETH) and Ripple (XRP), are paring losses, holding above key support levels. Ethereum is back above $3,100 but holds below a short-term resistance at $3,200, while XRP is trading sideways above its immediate $2.00 support.
Data spotlight: Ethereum, XRP ETFs see inflows as Bitcoin outflows return
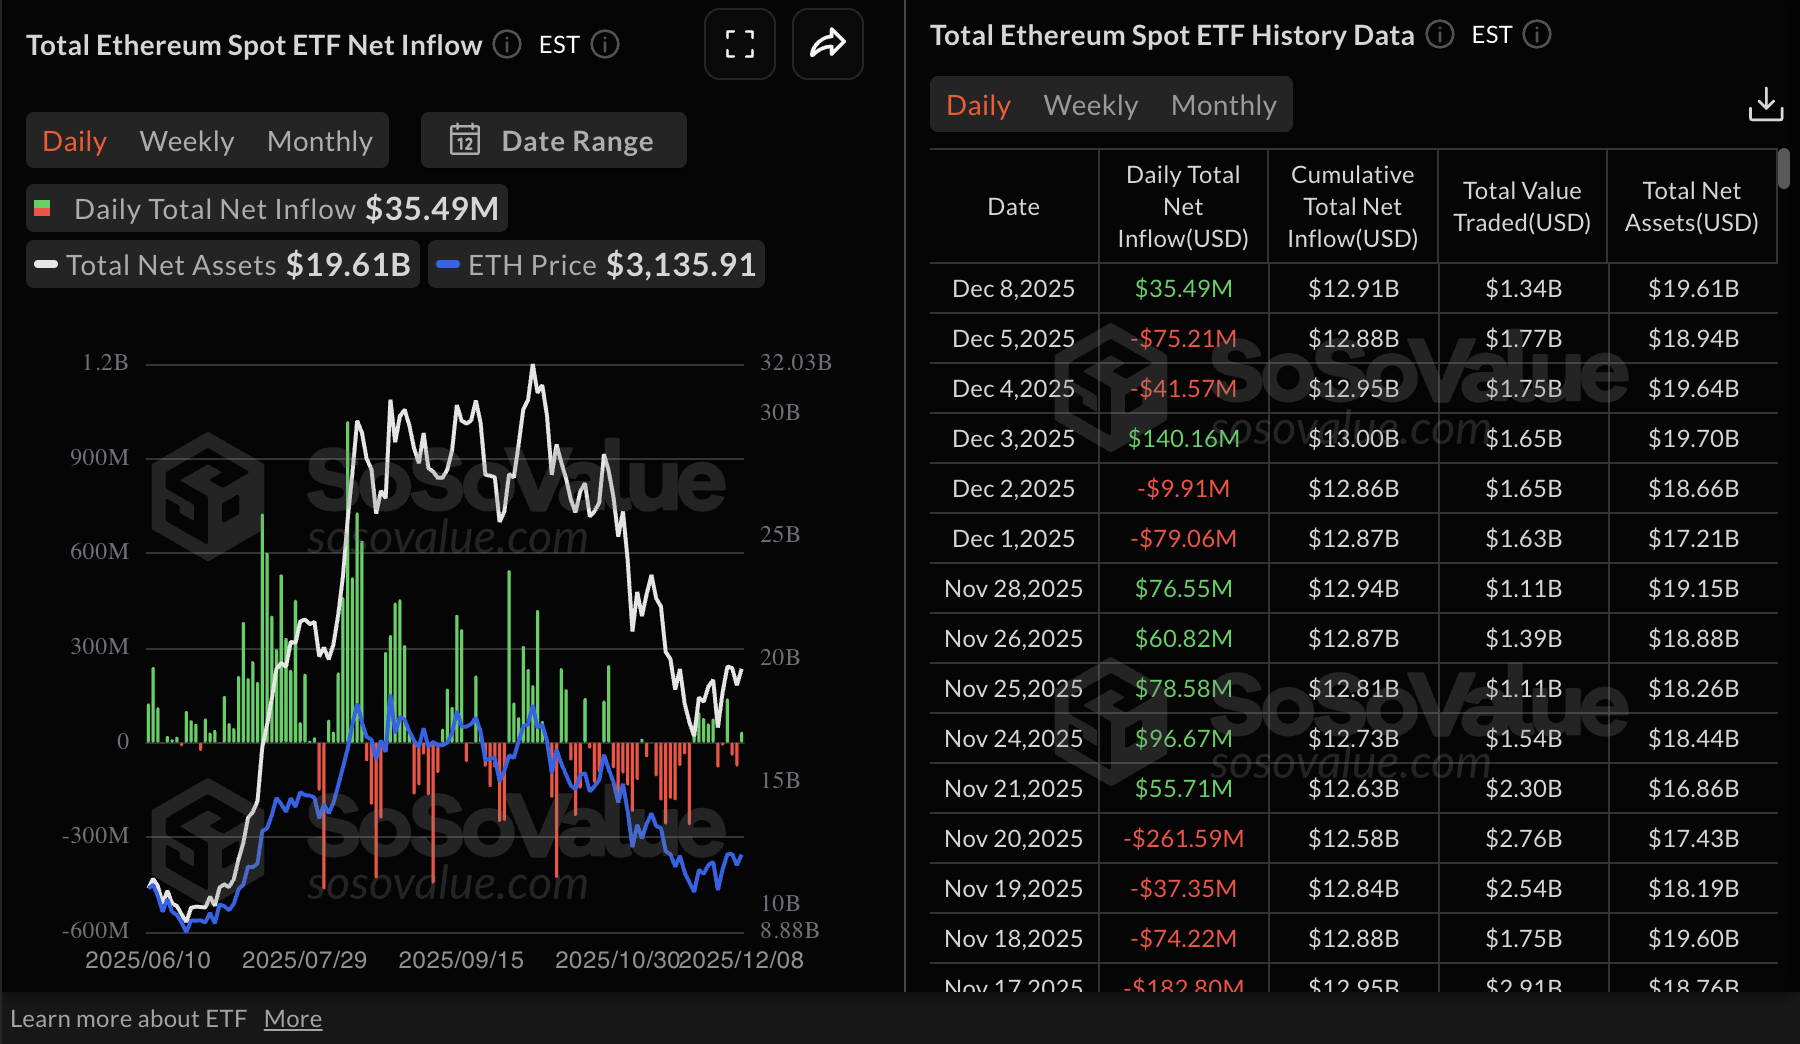
Ethereum spot Exchange Traded Funds (ETFs) recorded inflows of approximately $35 million on Monday, after posting outflows on Friday and Thursday. BlackRock's ETHA led with inflows of nearly $24 million, followed by Grayscale's ETH with almost $12 million. None of the US-listed ETH ETFs recorded outflows, bringing the cumulative inflow to $12.91 billion and net assets to $19.61 million, according to SoSoValue data.
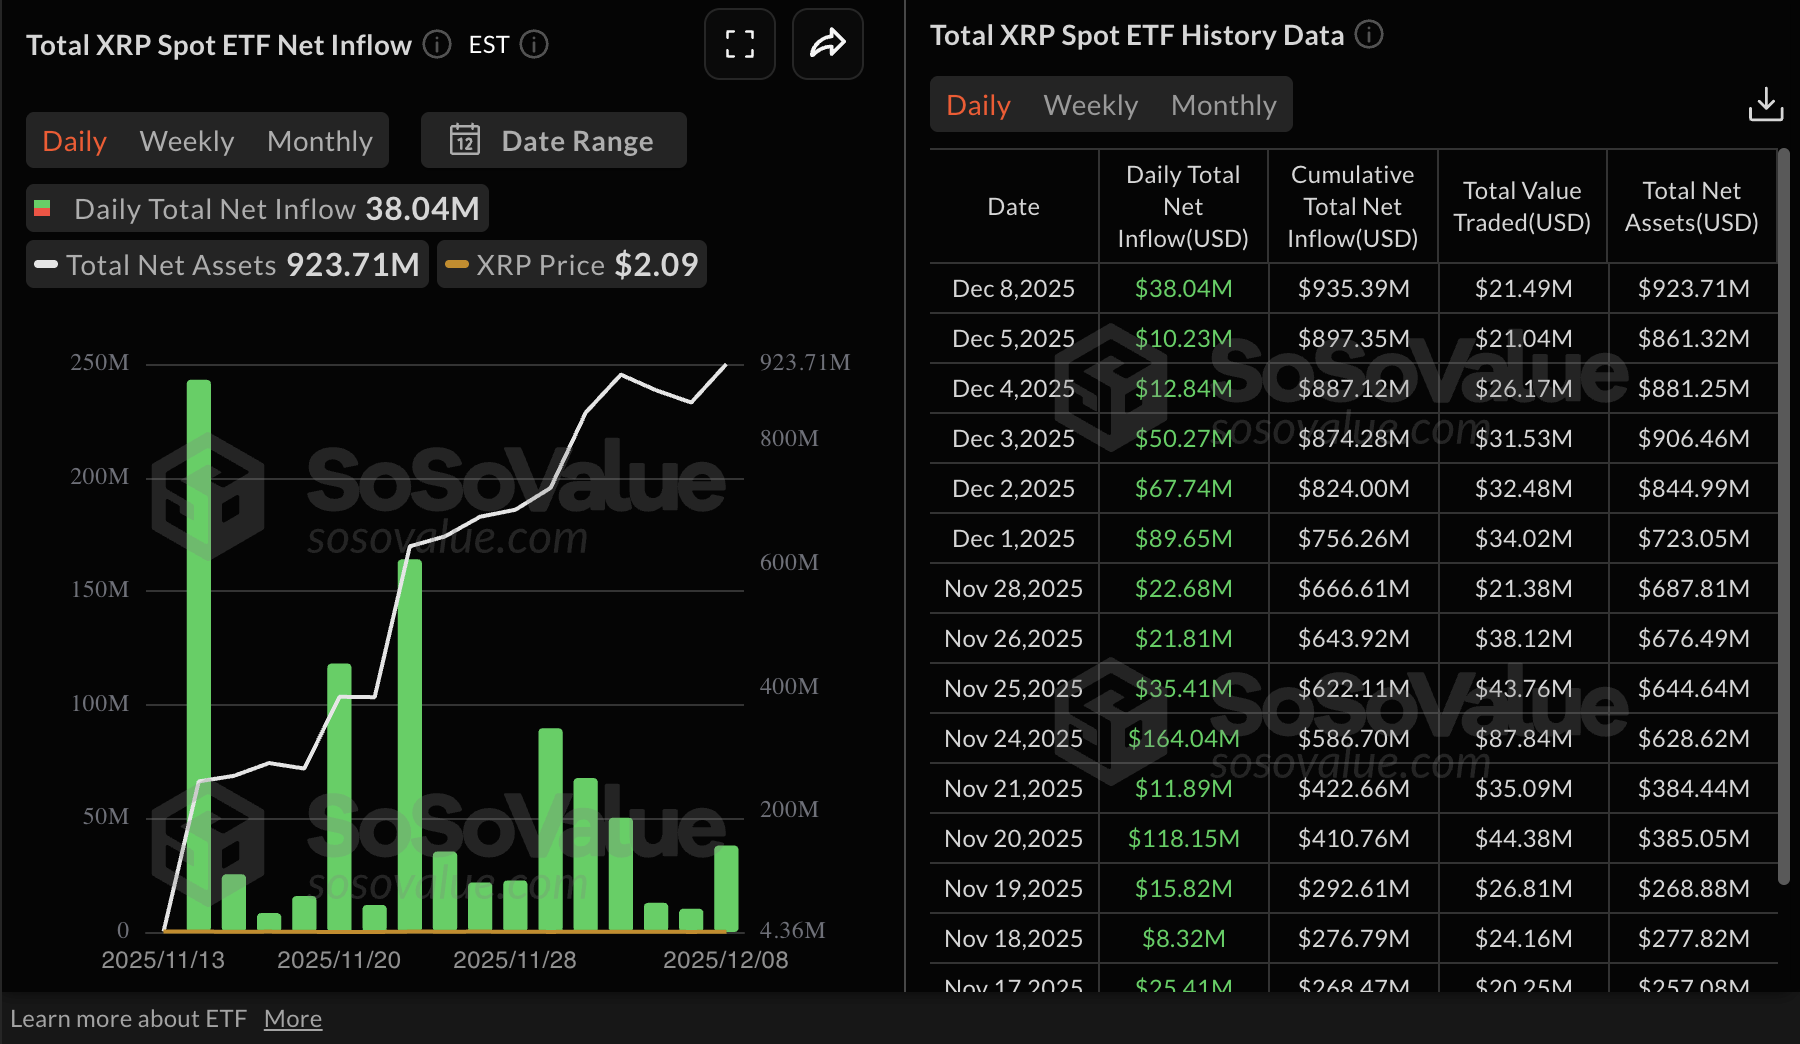
XRP ETFs extended their steady positive streak with inflows totalling $38 million on Monday. Since their debut on November 13, XRP ETFs have not posted outflows, signaling growing institutional interest in altcoin-related crypto investment products. The cumulative inflow averages $935 million with net assets of $924 million.
Bitcoin ETFs, on the other hand, resumed outflows with over $60 million drawn on Monday. The resumption of outflows could imply that institutional investors remain uncertain about Bitcoin's short-term outlook ahead of 2026. Bitcoin ETFs have cumulatively attracted $57.56 billion in inflows, with net assets of $118.5 billion.

Chart of the day: Bitcoin holds $90,000 as risk-off sentiment persists
Bitcoin is trading above $90,000 at the time of writing on Tuesday, as buyers and sellers battle for control. Bitcoin's position below the declining 50-day Exponential Moving Average (EMA) at $96,913, the 100-day EMA at $102,322 and the 200-day EMA at $103,803, undermines its bullish potential.
The Relative Strength Index (RSI) on the daily chart is at 44 and points downward, indicating that bearish momentum could increase in upcoming sessions.
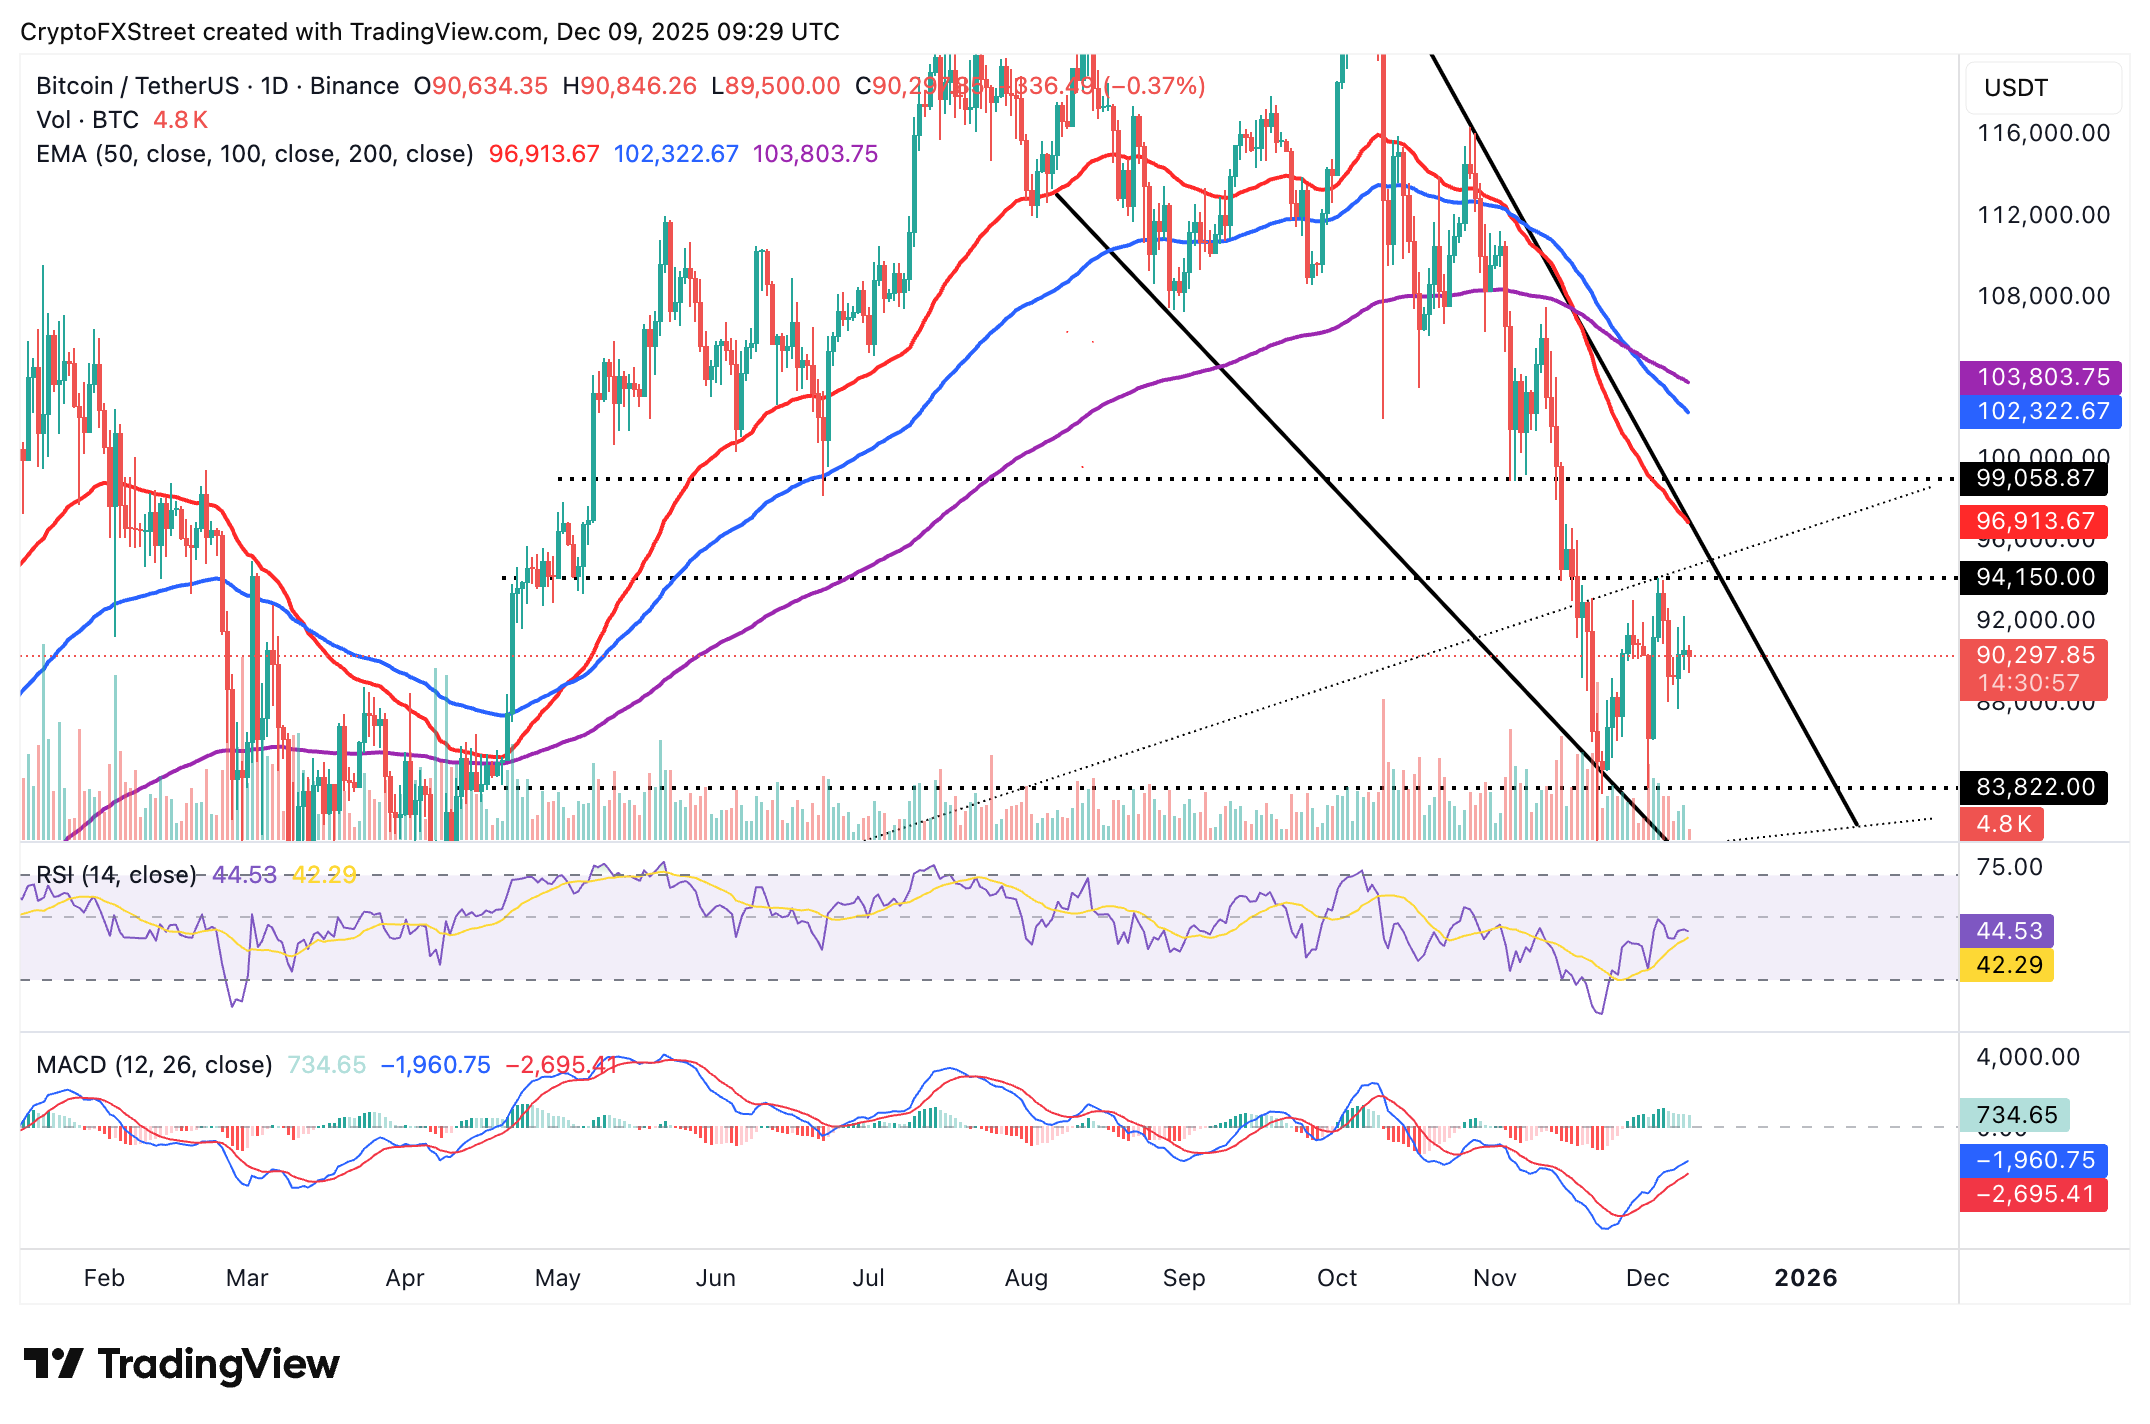
The RSI must flip the 50 midline into support to affirm Bitcoin's bullish case alongside the Moving Average Convergence Divergence (MACD), which has maintained a buy signal on the same chart since November 26.
Still, traders should be cautious, as the green histogram bars above the mean line in the MACD are fading, which could signal bearish momentum and increase the odds of an extended correction below $90,000.
Altcoins update: Ethereum, XRP consolidating above key support
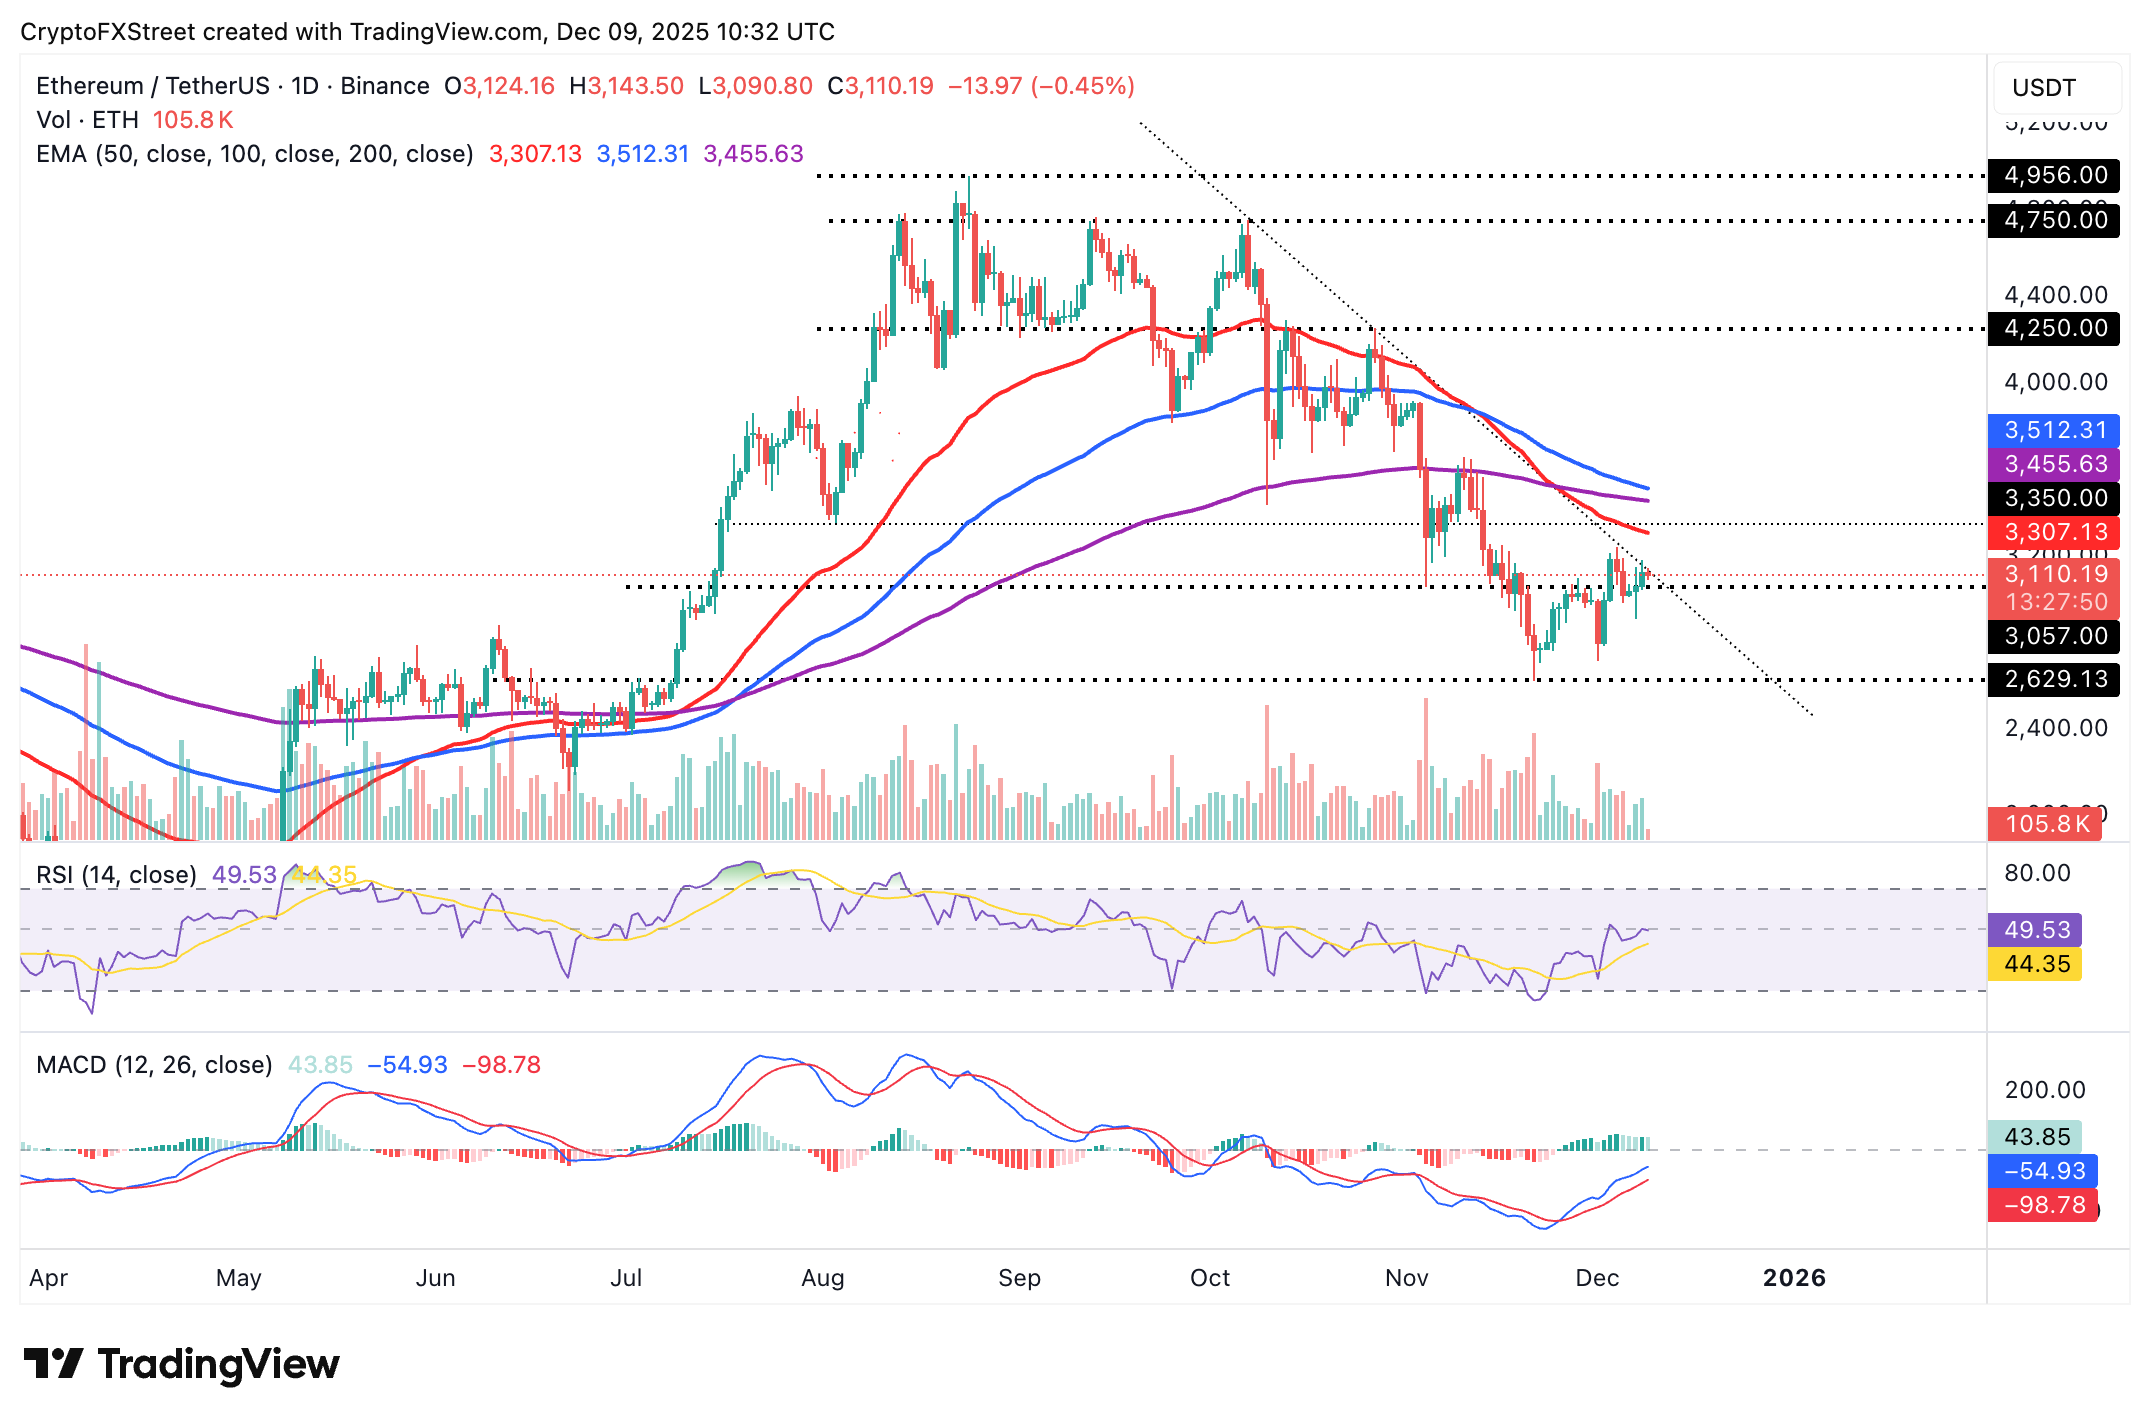
Ethereum is trading above its short-term support at $3,100, while a descending trendline on the daily chart limits upside. The token remains below the 50-day EMA at $3,307, the 200-day EMA at $3,455 and the 100-day EMA at $3,512, emphasizing the bearish bias.
If bulls fail to take control and push above the descending trendline, a reversal toward $3,000 may take shape. The RSI on the same chart is neutral at 49 but leans slightly bearish, indicating that sellers could have the upper hand.
Conversely, the MACD indicator supports Ethereum's bullish outlook with a buy signal since November 26. As the indicator approaches the mean line, bullish momentum is likely to increase, boosting the chances of a recovery. Flipping through the 50-day EMA at $3,307 into support would affirm ETH's upside potential.
As for XRP, the price remains below the 50-day EMA at $2.26, the 100-day EMA at $2.42, and the 200-day EMA at $2.47, reinforcing a bearish outlook.
The descending trend line from XRP's record high of $3.66 also limits gains, with resistance at $2.60. A downward-facing RSI holds at 42 on the daily chart, signaling that bearish momentum is increasing.
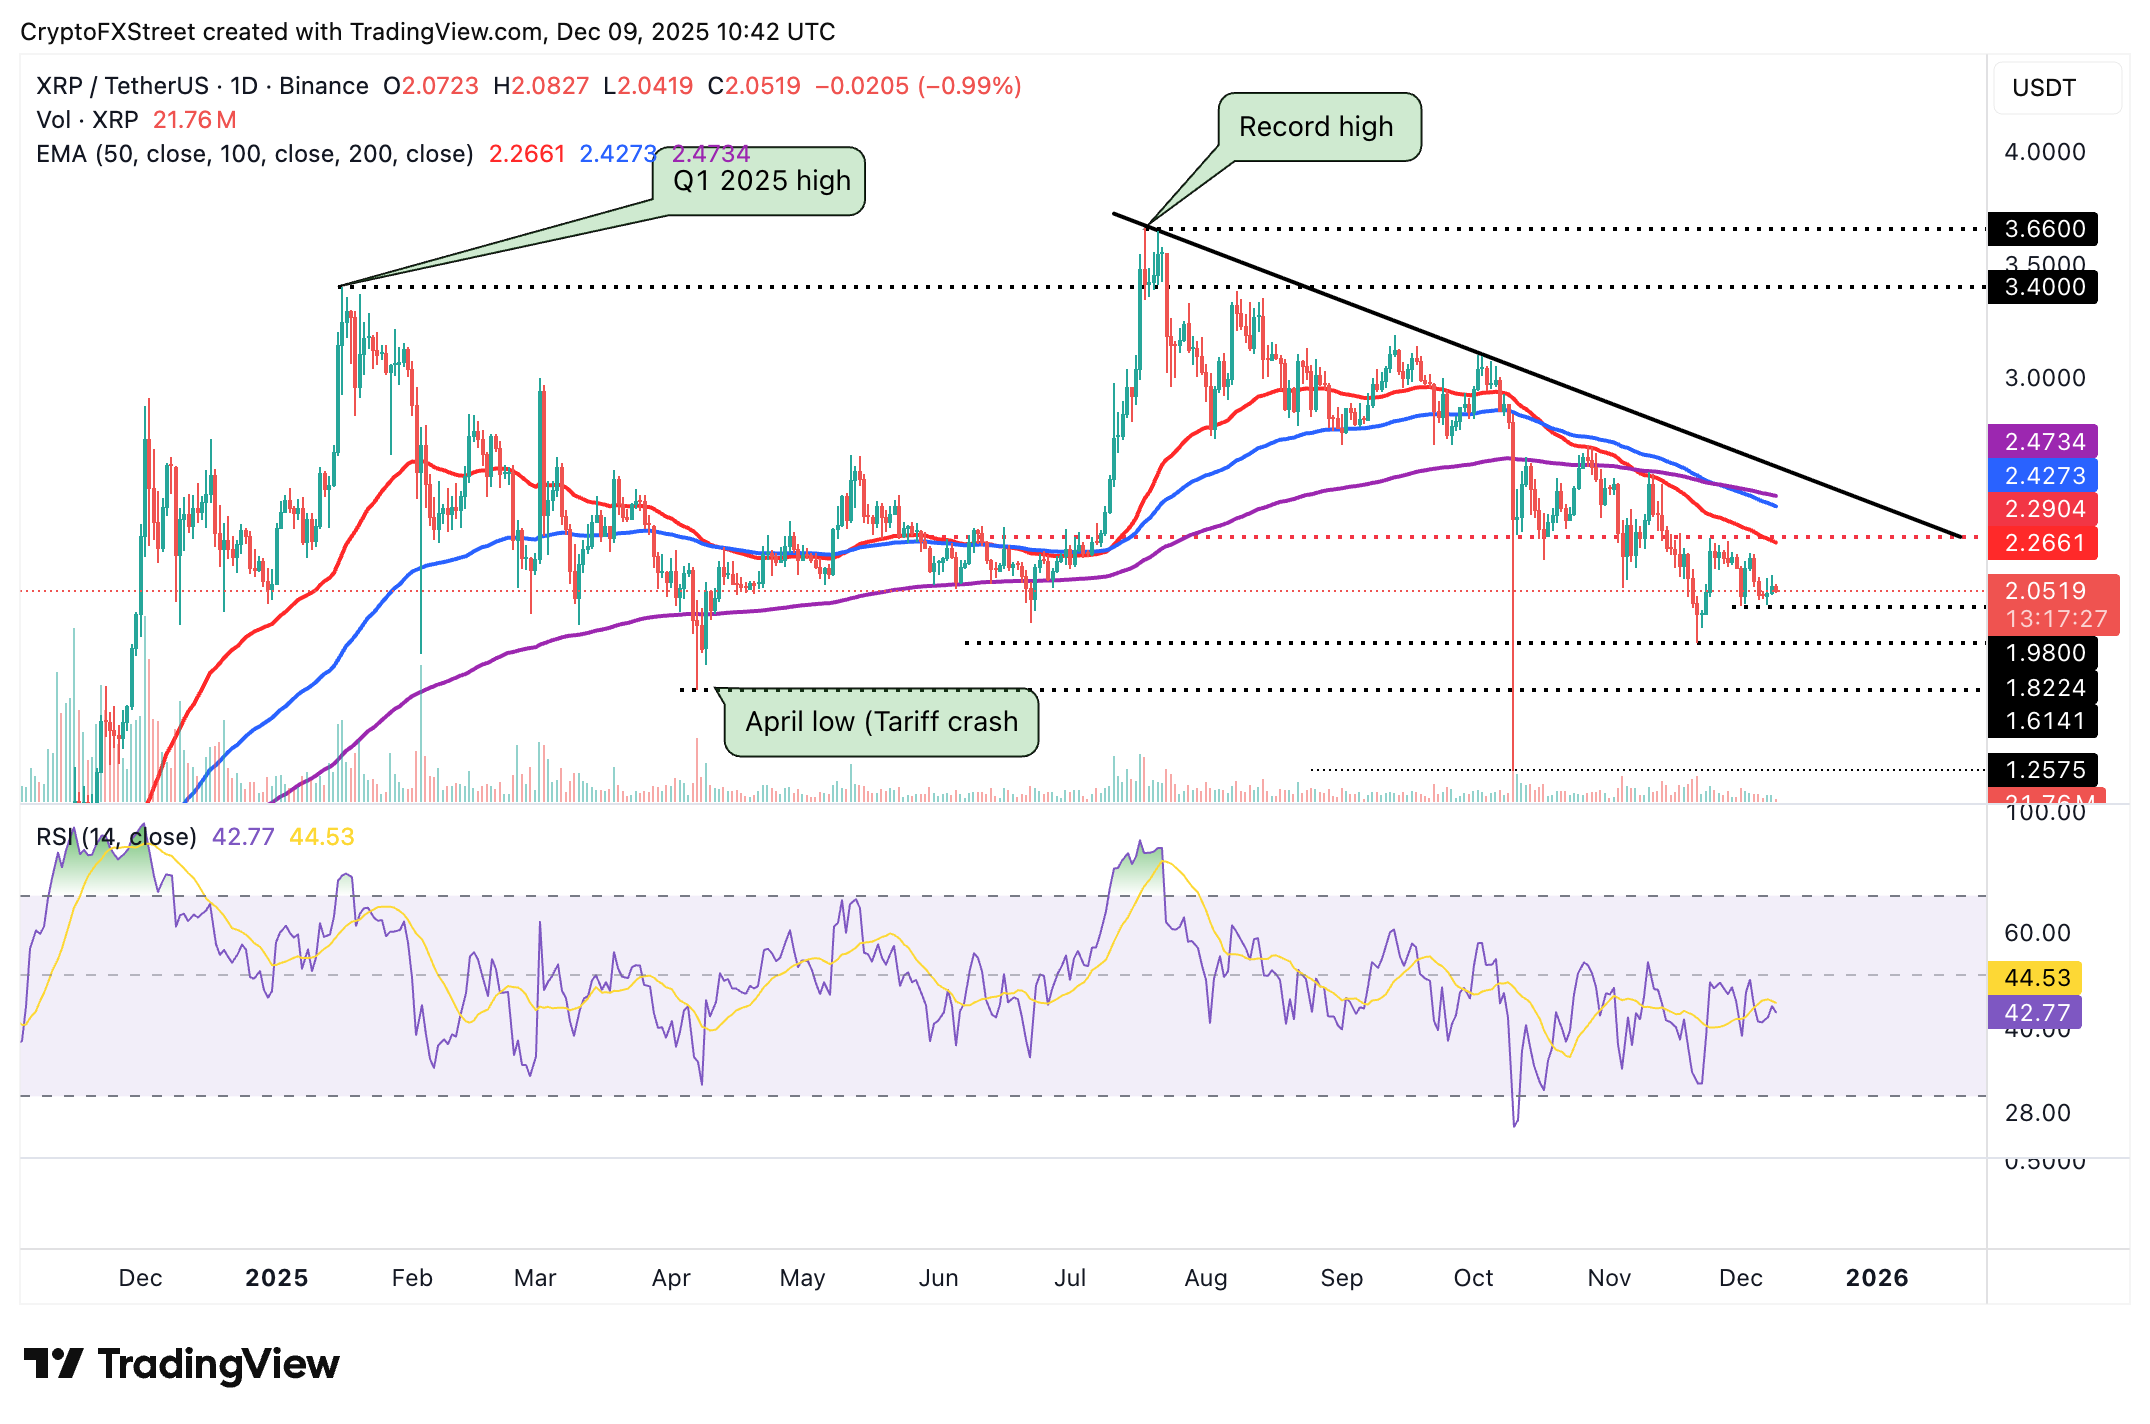
A close above the 50-EMA at $2.26 could open the path toward the descending trendline barrier at $2.60. Holding the $1.98–$1.82 support band would allow a base to form a recovery, while a break below it would sustain the broader downtrend toward April's low of $1.61.
Crypto ETF FAQs
An Exchange-Traded Fund (ETF) is an investment vehicle or an index that tracks the price of an underlying asset. ETFs can not only track a single asset, but a group of assets and sectors. For example, a Bitcoin ETF tracks Bitcoin’s price. ETF is a tool used by investors to gain exposure to a certain asset.
Yes. The first Bitcoin futures ETF in the US was approved by the US Securities & Exchange Commission in October 2021. A total of seven Bitcoin futures ETFs have been approved, with more than 20 still waiting for the regulator’s permission. The SEC says that the cryptocurrency industry is new and subject to manipulation, which is why it has been delaying crypto-related futures ETFs for the last few years.
Yes. The SEC approved in January 2024 the listing and trading of several Bitcoin spot Exchange-Traded Funds, opening the door to institutional capital and mainstream investors to trade the main crypto currency. The decision was hailed by the industry as a game changer.
The main advantage of crypto ETFs is the possibility of gaining exposure to a cryptocurrency without ownership, reducing the risk and cost of holding the asset. Other pros are a lower learning curve and higher security for investors since ETFs take charge of securing the underlying asset holdings. As for the main drawbacks, the main one is that as an investor you can’t have direct ownership of the asset, or, as they say in crypto, “not your keys, not your coins.” Other disadvantages are higher costs associated with holding crypto since ETFs charge fees for active management. Finally, even though investing in ETFs reduces the risk of holding an asset, price swings in the underlying cryptocurrency are likely to be reflected in the investment vehicle too.
추천 기사


