

Bitcoin Weekly Forecast: $100K on the knife-edge
- Bitcoin price falls over 8% so far this week, dipping below $100K for the first time since late June.
- Downside pressure mounts as long-term Bitcoin holders continue to sell.
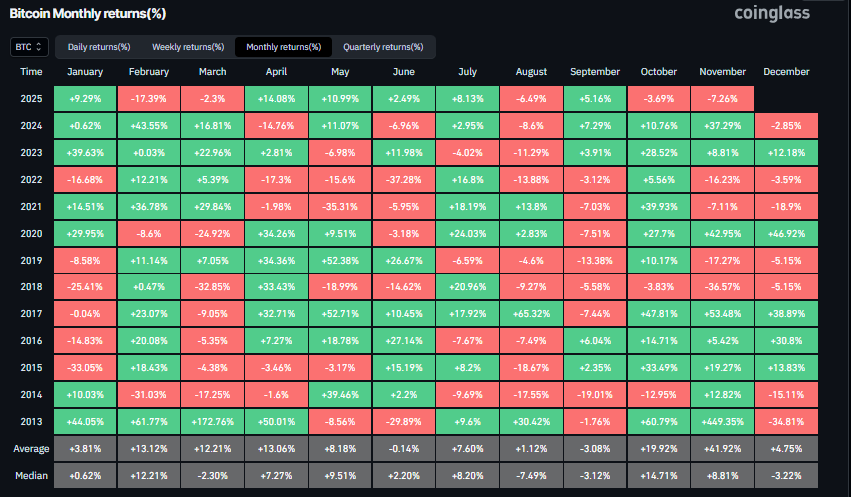
- Historical data shows November has been Bitcoin’s strongest month of the year, averaging gains of 42%.
Bitcoin (BTC) price continues to trade in red, below $101,000 at the time of writing on Friday, having dropped more than 8% so far this week. The decline comes amid mounting selling pressure from long-term holders, who continue to offload their positions. However, historical data offers a glimmer of hope for the bulls, as November is traditionally Bitcoin’s strongest month, delivering an average return of 42%.
Bitcoin hits a low of $98,944 as OG holders continue offloading their BTC holdings
Bitcoin price began the week on a bearish note, dropping to $98,944 on Tuesday — its lowest level since June 23. The decline has been exacerbated by increased selling by long-term holders, as shown in the graph below. The BTC supply last active within the past 180 days has surged by 319,626 BTC over the past month, indicating accelerated distribution by Bitcoin OGs.
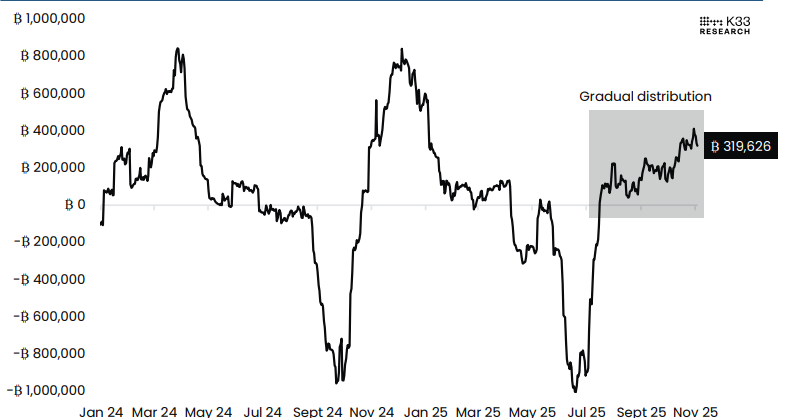
The sell-offs are primarily coming from coins aged 180 to 365 days, indicating notable profit-taking and distribution since mid-July. At the same time, some of the reactivated supply may be due to internal transfers, a substantial portion points to genuine selling activity.
Adding to this, a QCP Capital analyst reported on Monday that the view that OG holders are driving crypto’s idiosyncratic consolidation appears reasonable. Recent sell-offs, including Monday’s one, came with no clear macro catalyst, even as equities and other risk assets outperform under supportive policy conditions.
“Still, as BTC continues to consolidate in a multi-month band reminiscent of pre-breakout 2024, speculation has emerged on whether this cycle is nearing its end. Whether this marks the onset of another crypto winter is unclear. For now, long-term holders are realizing profits, while institutional inflows and adoption continue to strengthen the market’s foundation,” concludes QCP’s analyst.
Bitcoin spot ETFs record highest single-day outflow since August
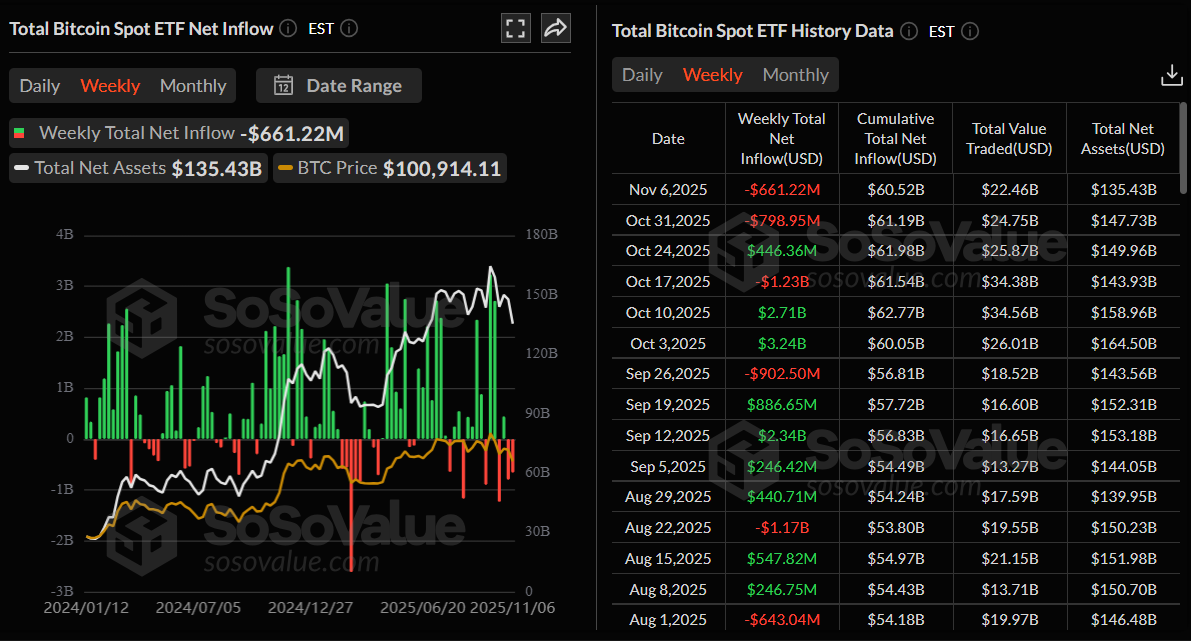
Institutional demand for Bitcoin has continued to weaken so far this week. SoSoValue data shows that spot Bitcoin ETFs have recorded a total outflow of $661.22 million as of Thursday, marking the second consecutive week of outflows. Moreover, Tuesday’s outflow of $577.74 million marked the largest single-day withdrawal since early August. If this trend persists and intensifies, Bitcoin could face a deeper price correction, reflecting waning institutional confidence.
Despite the decline in institutional demand, Michael Saylor, head of Strategy, posted on X on Monday that his firm had acquired 397 BTC, bringing the total to 641,205 BTC, highlighting the company’s continued long-term conviction in Bitcoin amid short-term market weakness.

Longest US government shutdown ever
The longest US government shutdown in history entered its 38th day on Friday, deepening economic concerns as Congress remains deadlocked. The nonpartisan Congressional Budget Office (CBO) warned that the prolonged shutdown could shave between 1.0% and 2.0% off US GDP in the fourth quarter, adding further pressure on policymakers to resolve it. Despite several attempts to solve the situation, progress appears stalled as Democrats signaled plans to block GOP efforts to force a vote after the Senate failed 14 times to pass a funding bill.
Meanwhile, easing US–China trade tensions offered a glimmer of optimism to markets. The Chinese Finance Ministry announced on Wednesday that the Asian country would lift some tariffs on US agricultural goods starting November 10, while suspending 24% of tariffs on some products for one year but retaining a 10% on other items. Following a meeting with a US agriculture delegation, China’s top trade negotiator, Li Chenggang, urged the United States to create favorable conditions for deeper cooperation.
These developments follow Tuesday’s announcement by US President Donald Trump to cut fentanyl-related tariffs on imports from China, lowering the rate from 20% to 10%, and the continued freeze of some of his reciprocal levies on Chinese goods. The moves, set to take effect on November 10, stem from agreements reached during the October summit in South Korea aimed at de-escalating trade tensions between the world’s two largest economies.
However, the positive outcome failed to lift market sentiment, as traders remain cautious amid broader economic uncertainty.
On-chain data warns of a deeper correction in BTC if $100,000 support breaks
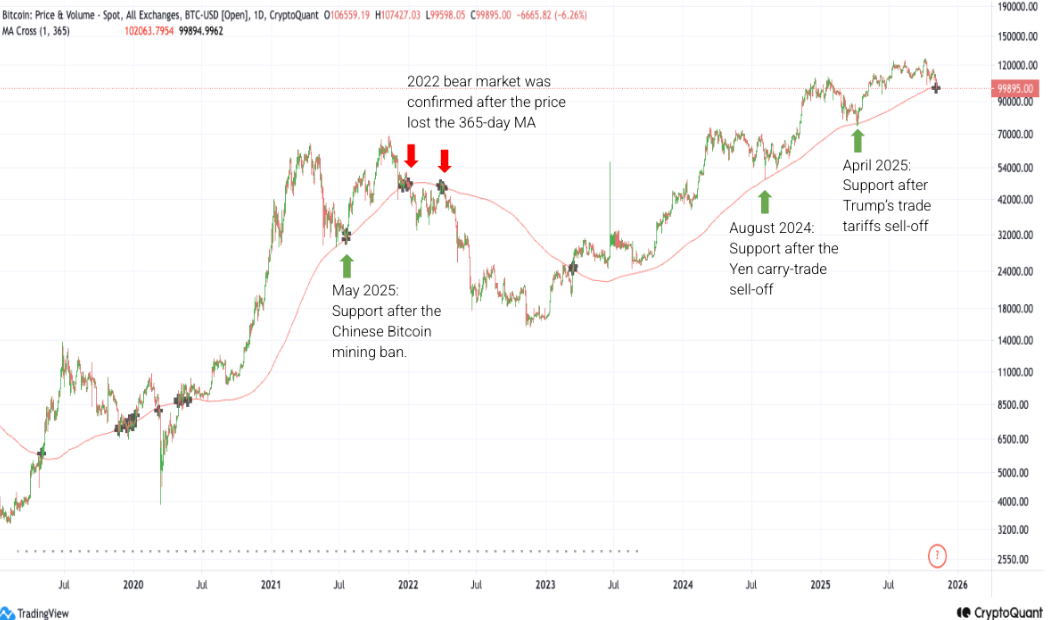
CryptoQuant’s weekly report, released on Wednesday, highlighted that BTC’s fundamentals remain weak, with the price falling below $100,000 for the first time in months. The report added that the King of Cryptos is now hovering near critical support levels, a breakdown of which could trigger a sharper market correction.
The graph below shows that Bitcoin’s price has declined below $100,000 for the first time since June 23 and is now below its 365-day Moving Average (MA) of $102,000, a key technical and psychological support level. The 365-day MA has served as the ultimate support level so far this bull cycle (green arrows) and was one of the last signals to trigger as the bear market began in December 2021 – January 2022. Failure to reclaim the 365-day MA soon could accelerate a deeper correction.
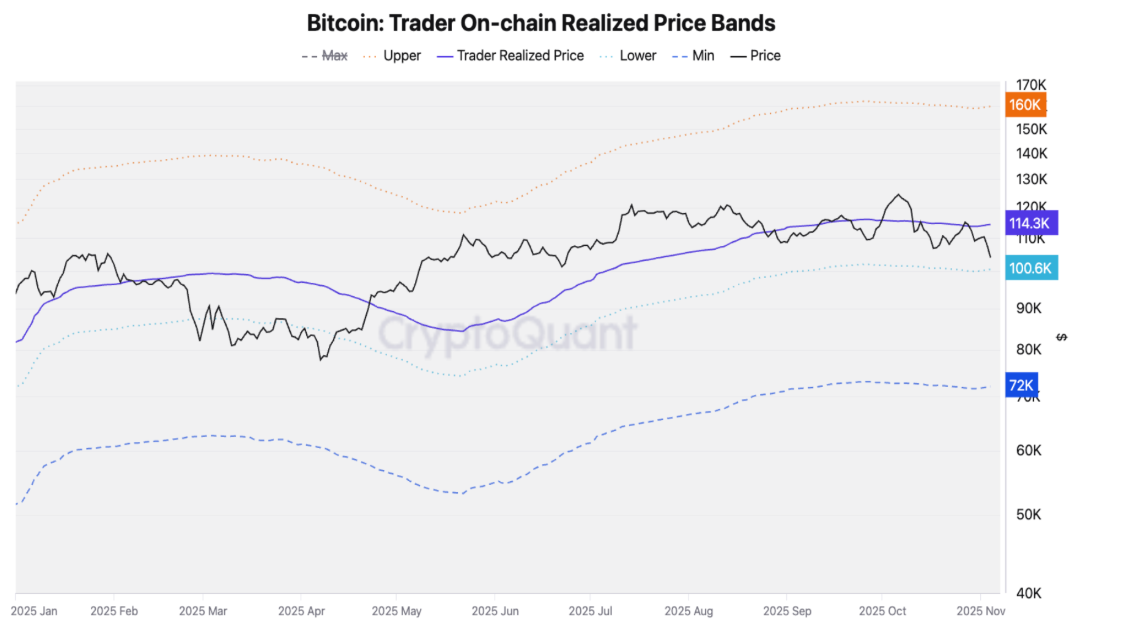
Throughout this bull cycle, the lower band ($100,000) has acted as support, as traders tend to sell and realize losses near this level, according to the Traders’ On-chain Realized Price Bands metric. However, if enough selling pressure builds, the next price support would be the Traders’ minimum price band, currently at $72,000.
What’s there for BTC in November?
CoinGlass’s historical data shows that despite Bitcoin recording a 3.69% loss in October — disappointing traders who had anticipated an ‘Uptober’ rally — November has historically been the strongest month for BTC, delivering an average return of 41.92%.
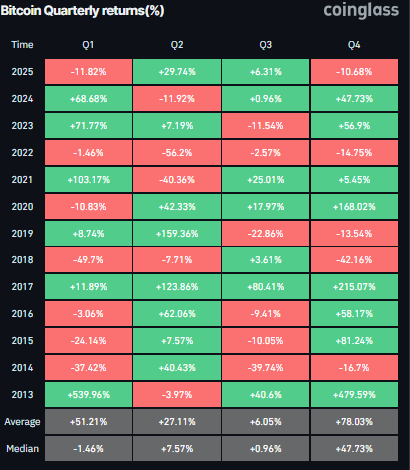
Adding to this optimism, the fourth quarter (Q4) has been the best quarter for BTC in general, with an average of 78.03%, which could push BTC to new highs by the end of the year.
Technical outlook suggests caution as Bitcoin retests key support
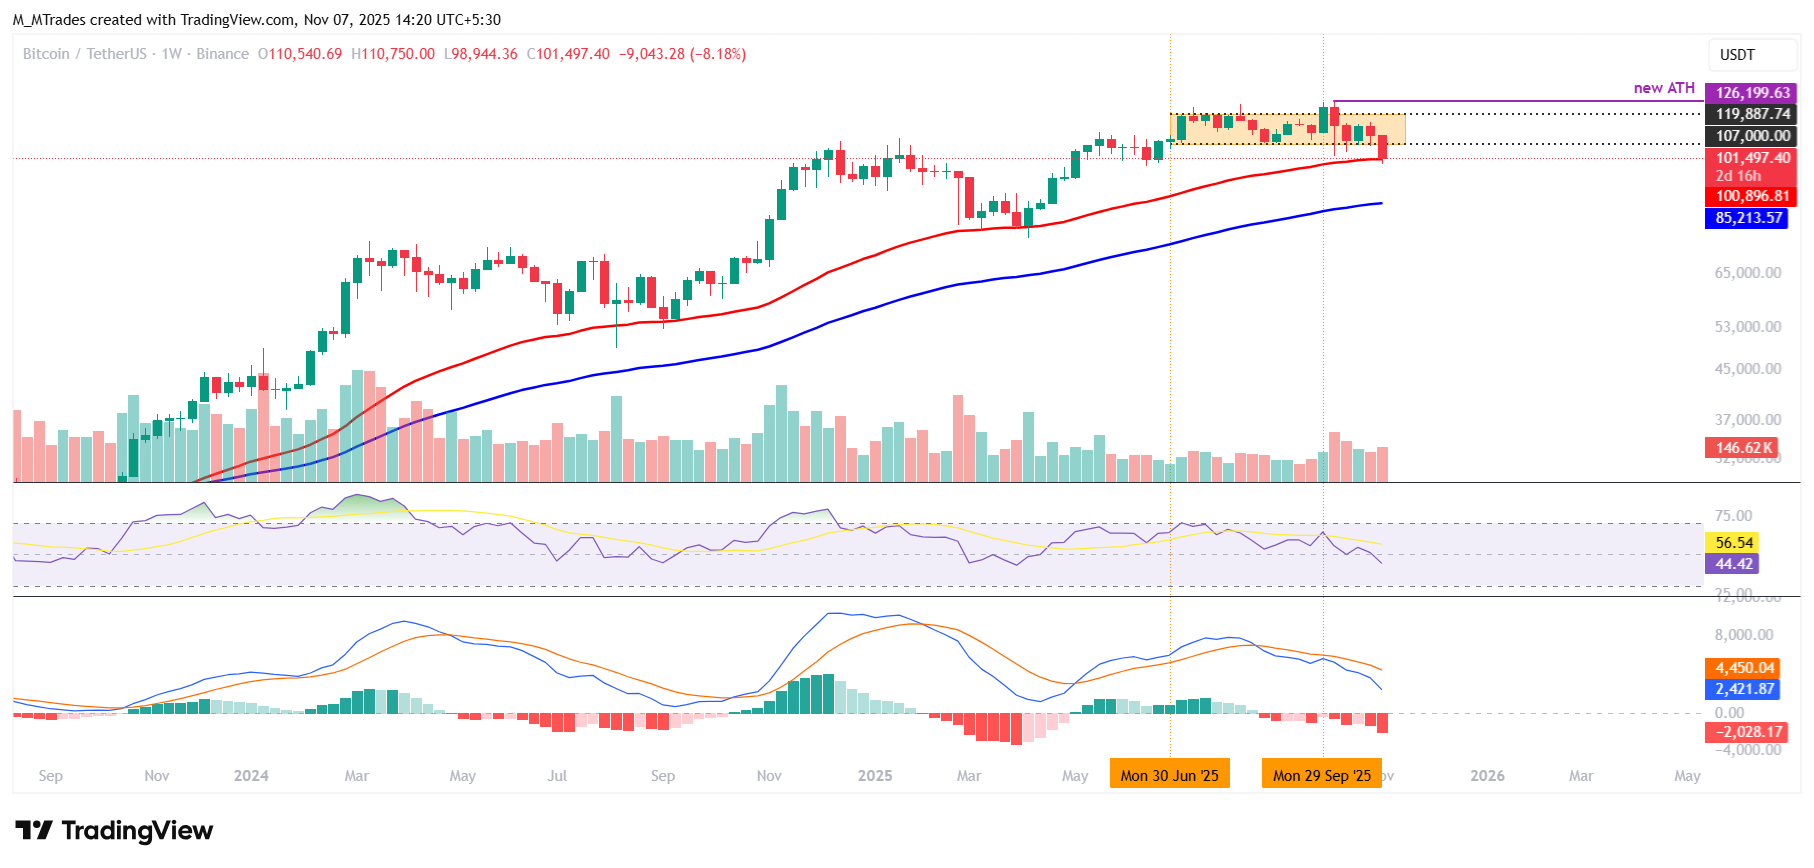
Bitcoin’s weekly chart shows a correction of more than 20% from its all-time high of $126,199 over the past five weeks, with the price hitting a low of $98,944 this week and retesting the 50-week Exponential Moving Average (EMA) around $100,896.
Historically, the 50-week EMA has acted as a key support for BTC. If the level is breached, BTC could extend the correction toward the 100-week EMA at $85,213.
The Relative Strength Index (RSI) on the weekly chart reads 44, below its neutral level of 50, indicating that bearish momentum is gaining traction. Additionally, the Moving Average Convergence Divergence (MACD) indicator showed a bearish crossover that remains intact, with rising red histogram bars below the zero level signaling continuation of the bearish trend.
On the daily chart, Bitcoin price faced rejection around its previously broken trendline on Monday and declined 8.18% until the next day, retesting the 50% Fibonacci retracement level at $100,353 (drawn from the April low of $74,508 to the all-time high of $126,199). However, on Wednesday, BTC rebounded 2.35% after finding support near the $100,353 level, though much of those gains were erased the following day. At the time of writing on Friday, BTC hovers at around $102,200.
If the 50% Fibonacci retracement level at $100,353 continues to hold as support, BTC could extend its recovery toward the next key resistance level at $106,435.
The Relative Strength Index (RSI) is at 34, hovering slightly above the oversold territory, suggesting that selling momentum may be easing and that a potential short-term rebound could be on the horizon.
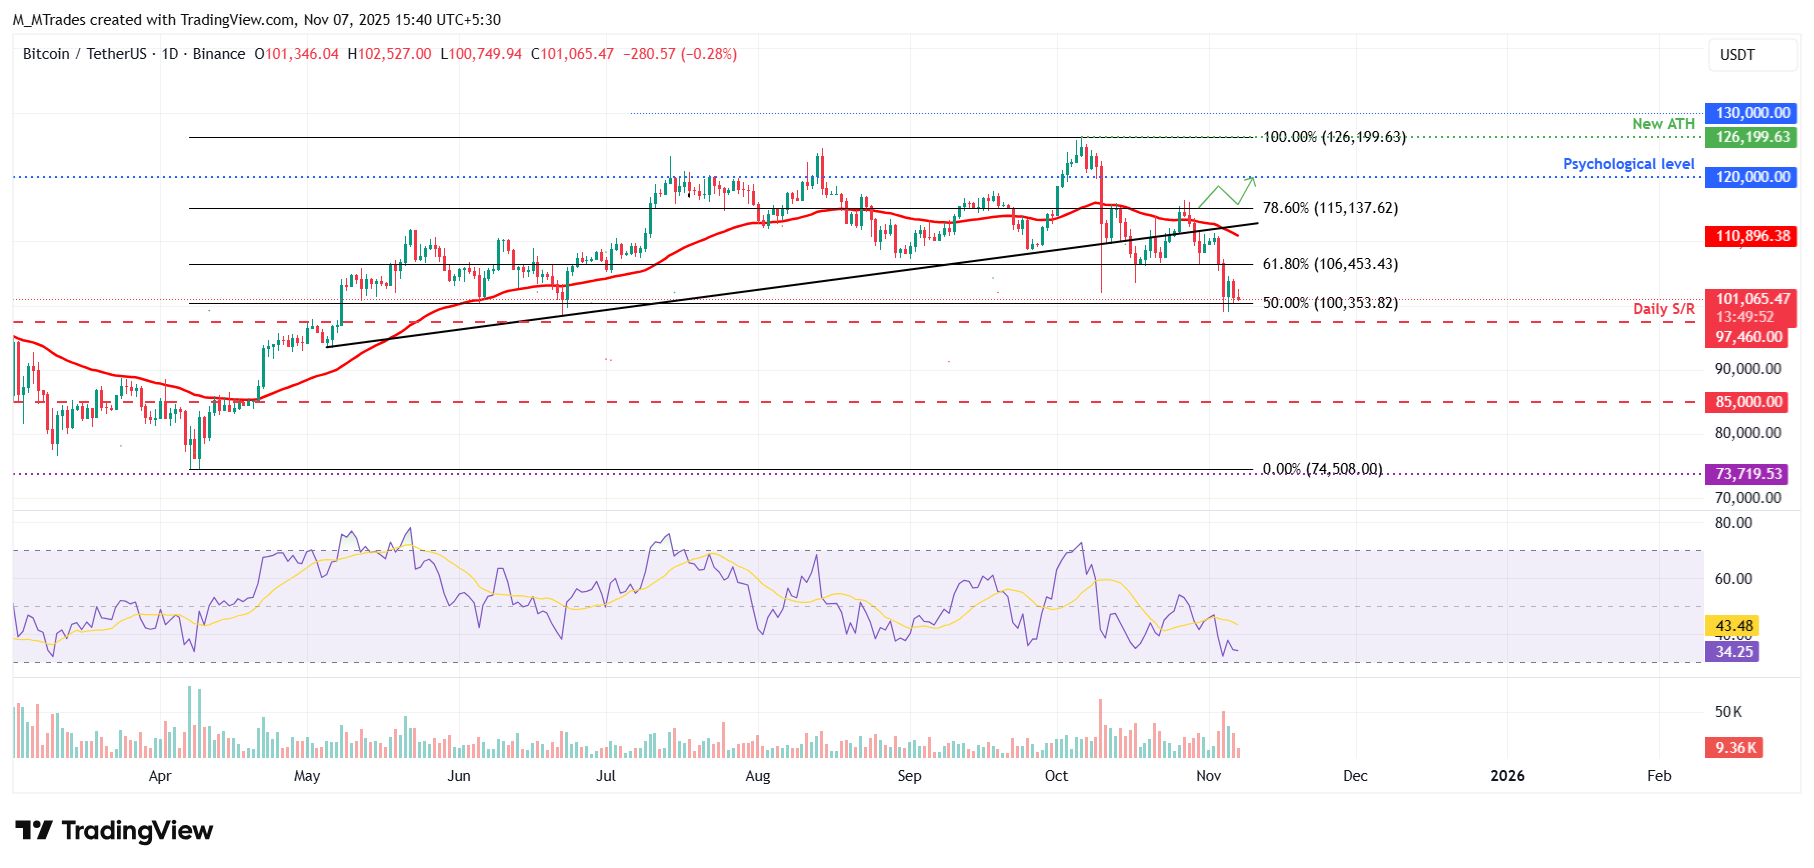
On the other hand, if BTC closes below the $100,353 support level, it could extend the decline toward the next daily support at $97,460.
Bitcoin, altcoins, stablecoins FAQs
Bitcoin is the largest cryptocurrency by market capitalization, a virtual currency designed to serve as money. This form of payment cannot be controlled by any one person, group, or entity, which eliminates the need for third-party participation during financial transactions.
Altcoins are any cryptocurrency apart from Bitcoin, but some also regard Ethereum as a non-altcoin because it is from these two cryptocurrencies that forking happens. If this is true, then Litecoin is the first altcoin, forked from the Bitcoin protocol and, therefore, an “improved” version of it.
Stablecoins are cryptocurrencies designed to have a stable price, with their value backed by a reserve of the asset it represents. To achieve this, the value of any one stablecoin is pegged to a commodity or financial instrument, such as the US Dollar (USD), with its supply regulated by an algorithm or demand. The main goal of stablecoins is to provide an on/off-ramp for investors willing to trade and invest in cryptocurrencies. Stablecoins also allow investors to store value since cryptocurrencies, in general, are subject to volatility.
Bitcoin dominance is the ratio of Bitcoin's market capitalization to the total market capitalization of all cryptocurrencies combined. It provides a clear picture of Bitcoin’s interest among investors. A high BTC dominance typically happens before and during a bull run, in which investors resort to investing in relatively stable and high market capitalization cryptocurrency like Bitcoin. A drop in BTC dominance usually means that investors are moving their capital and/or profits to altcoins in a quest for higher returns, which usually triggers an explosion of altcoin rallies.
추천 기사


