
Ethereum Price Forecast: ETH ETF outflows signal more pain ahead
- Ethereum struggles to hold $3,500 as risk-off sentiment and fear grip the broader crypto market.
- ETF outflows and shrinking retail demand drag Ethereum down, as the sell-off continues.
- Ethereum's recovery could be an uphill task considering the downtrending RSI and the MACD sell signal.
Ethereum (ETH) remains largely in bearish hands, trading marginally above $3,500 on Tuesday. The leading smart contracts token has extended its decline for the second consecutive day, reflecting the negative sentiment in the wider crypto market.
A weak derivatives market aligns with the risk-off sentiment, as traders increasingly retreat to the sidelines amid extreme volatility.
Ethereum recovery elusive as institutional and retail demand dwindles
Institutional investors have taken a step back from seeking exposure to Ethereum spot Exchange Traded Funds (ETFs). According to SoSoValue, US-listed ETFs experienced outflows of $136 million on Monday, bringing the cumulative net inflows to $14.23 billion and net assets to approximately $24 billion.
None of the nine ETH ETFs recorded net inflows. BlackRock's ETHA led the outflows at $82 million, followed by Fidelity's FETH with $25 million.
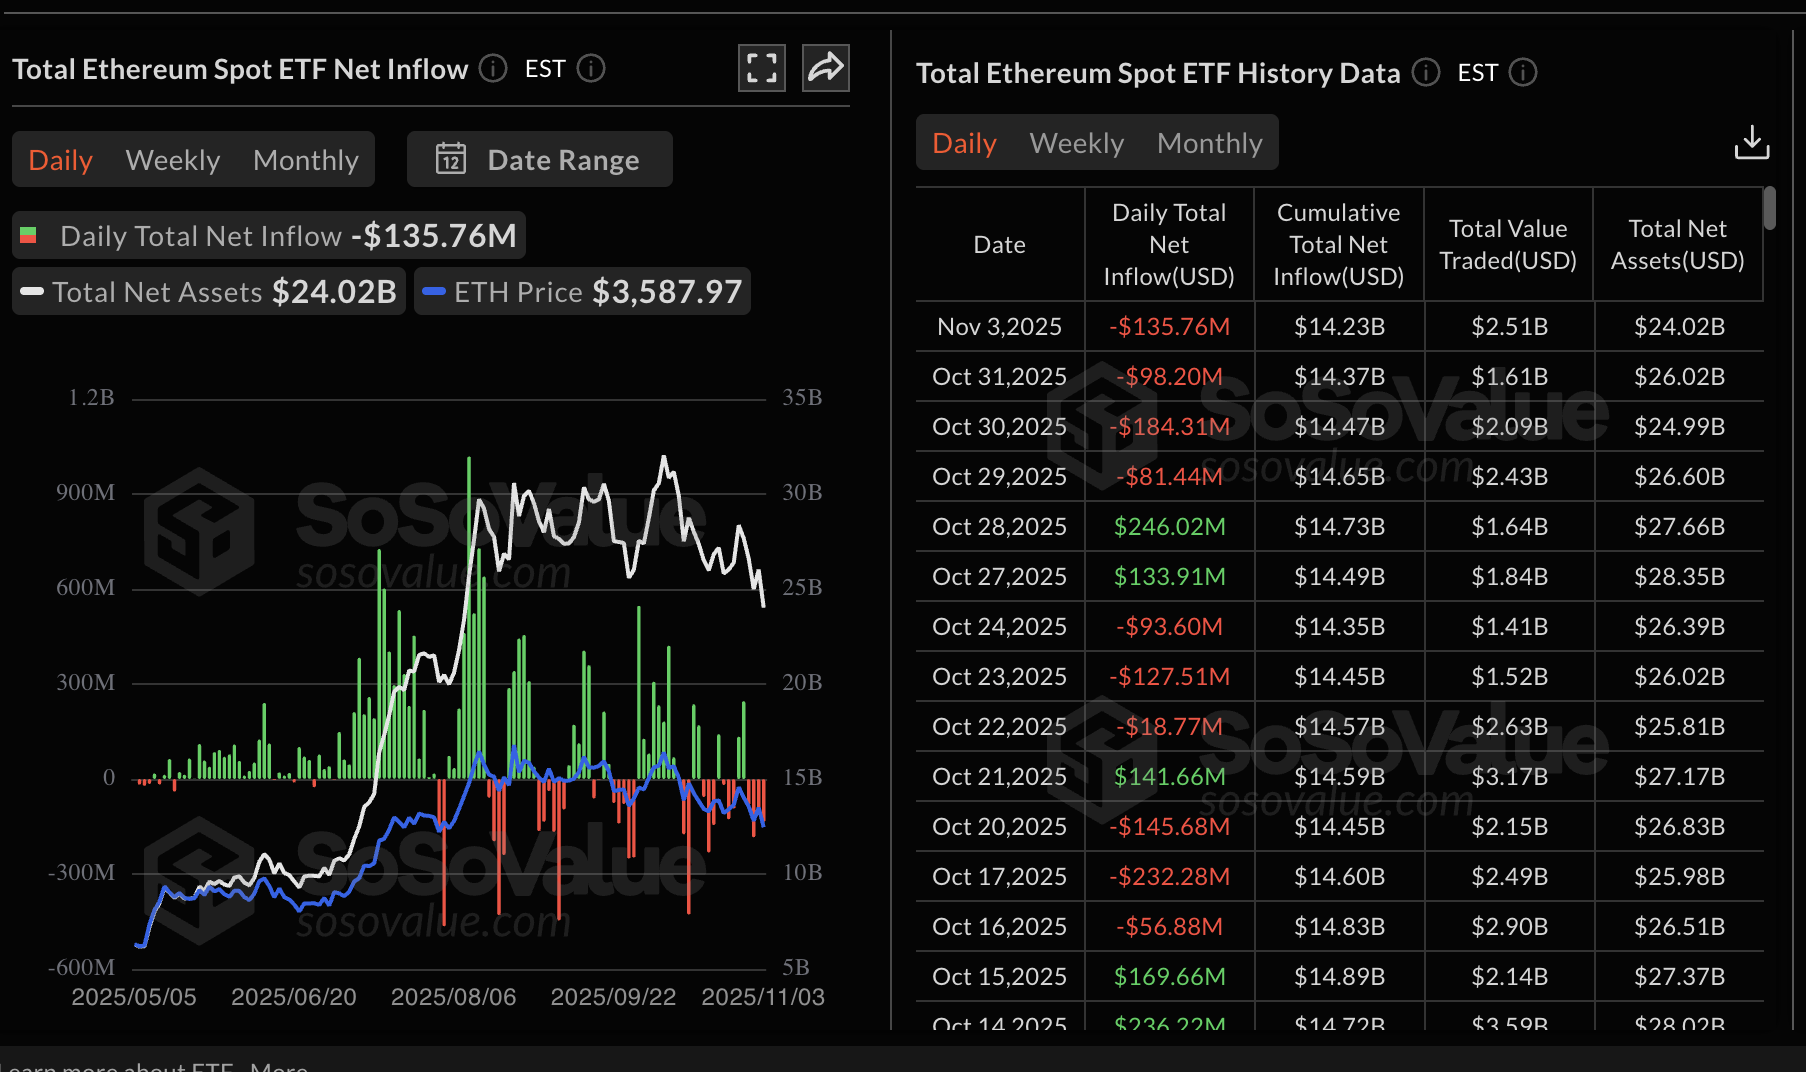
Ethereum ETF stats | Source: SoSoValue
Retail demand for Ethereum has also taken a significant back foot, with the futures Open Interest (OI) falling to $44.72 billion from the October peak of approximately $63 billion.
OI refers to the notional value of outstanding futures contracts, which helps gauge interest and investor confidence in the asset. A persistent decline indicates that traders are closing their long positions in favor of short positions, contributing to selling pressure.
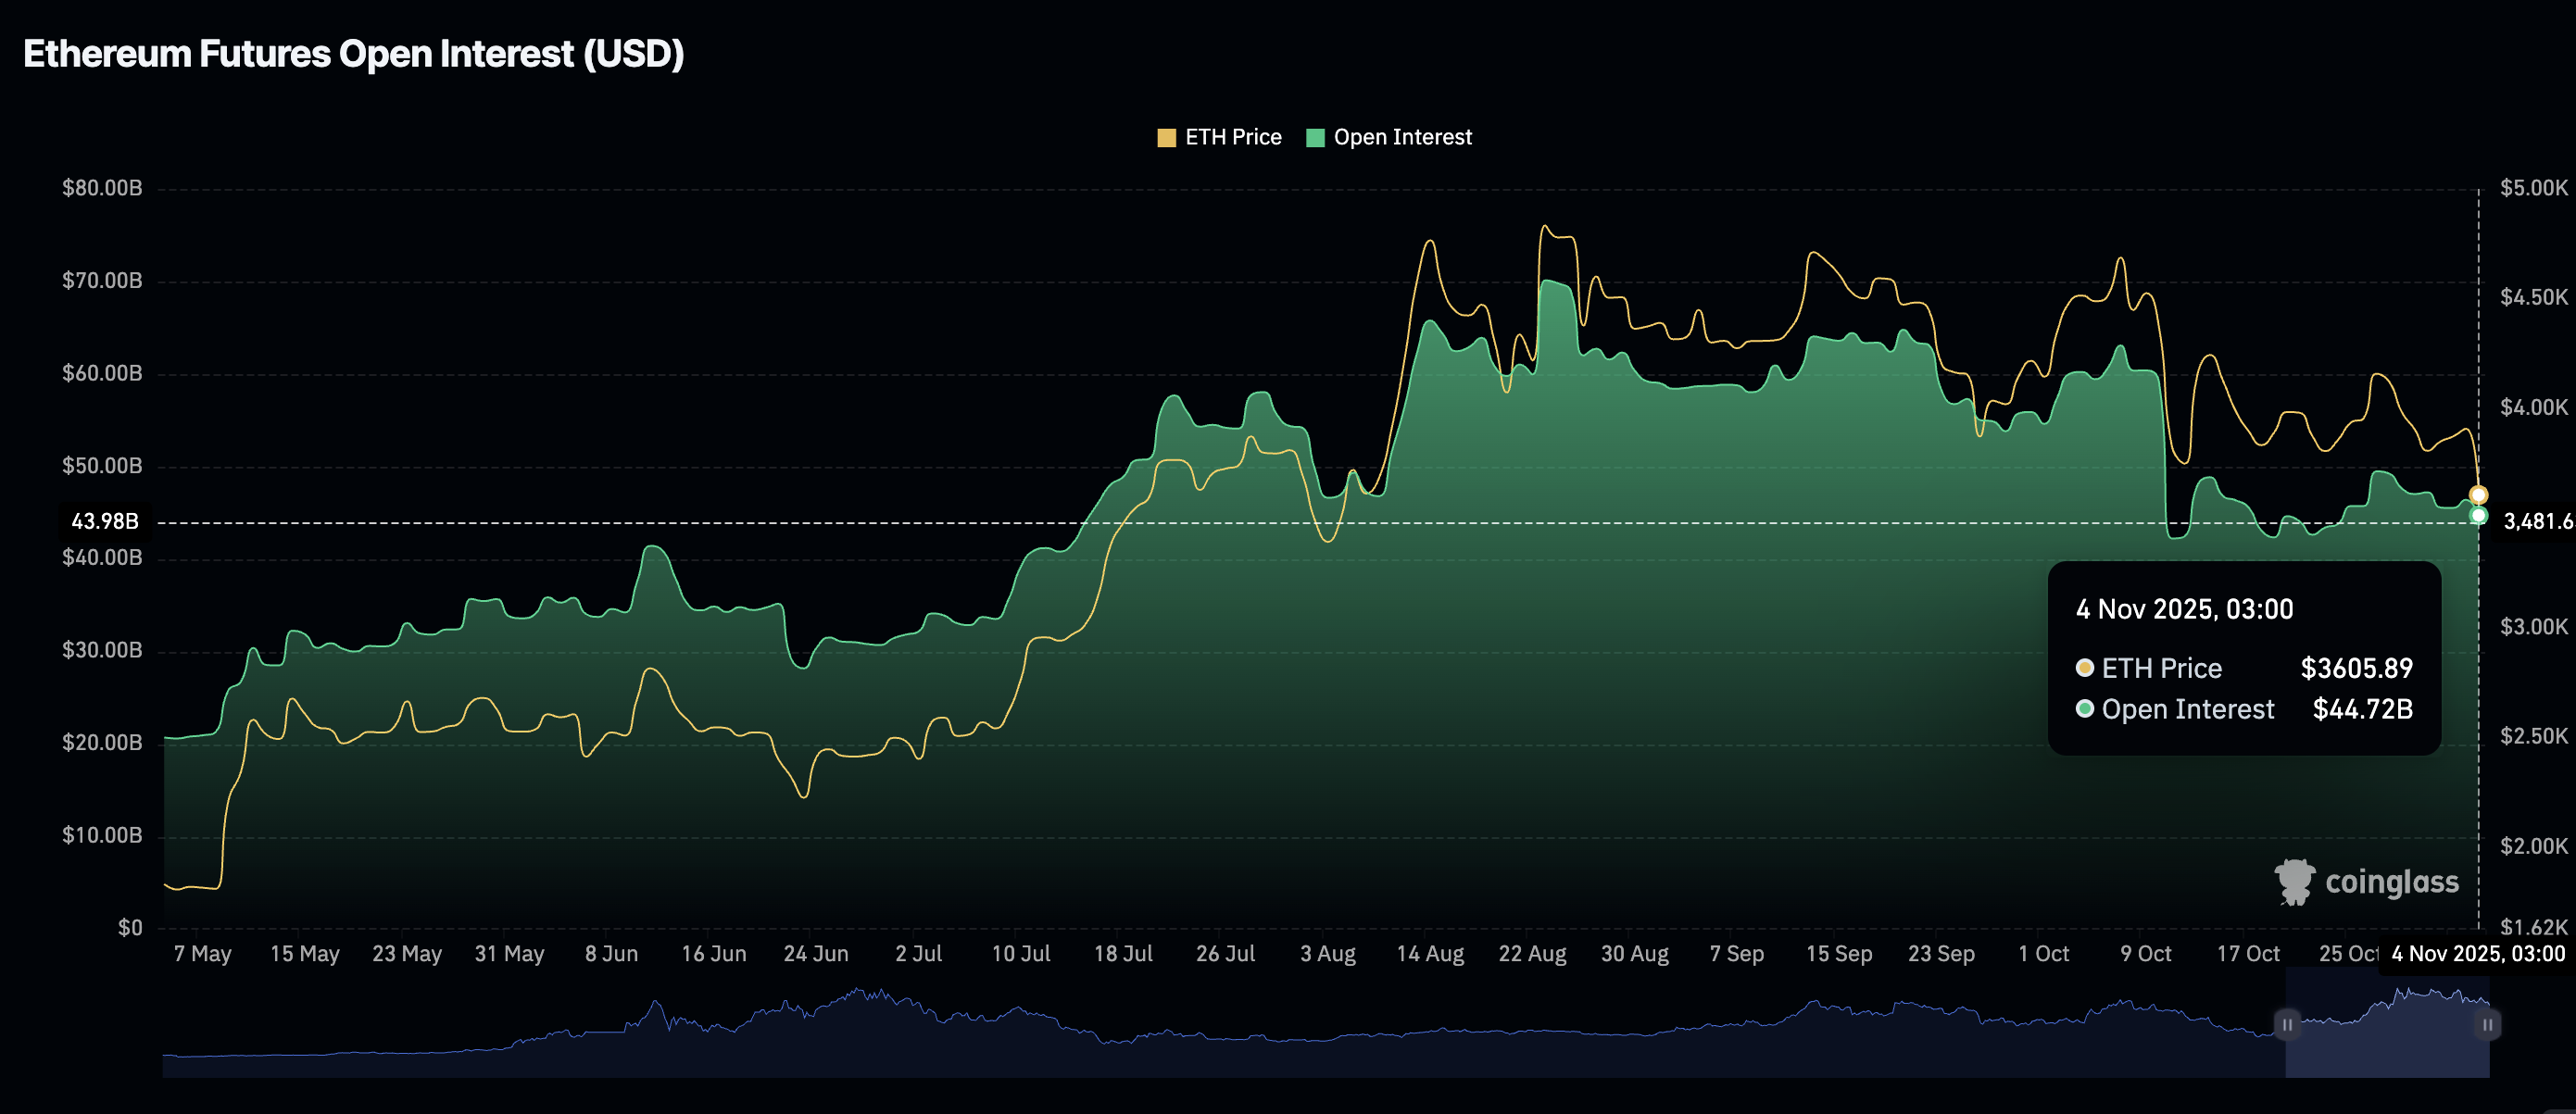
Ethereum futures Open Interest | Source: CoinGlass
The OI-weighted funding rate, which averages 0.0038% on Tuesday, supports the risk-off sentiment surrounding Ethereum. As traders increasingly pile into short positions, it becomes difficult to sustain recovery. The significantly suppressed OI-weighted funding rate could explain the steady price drop since the October 10 sell-off.
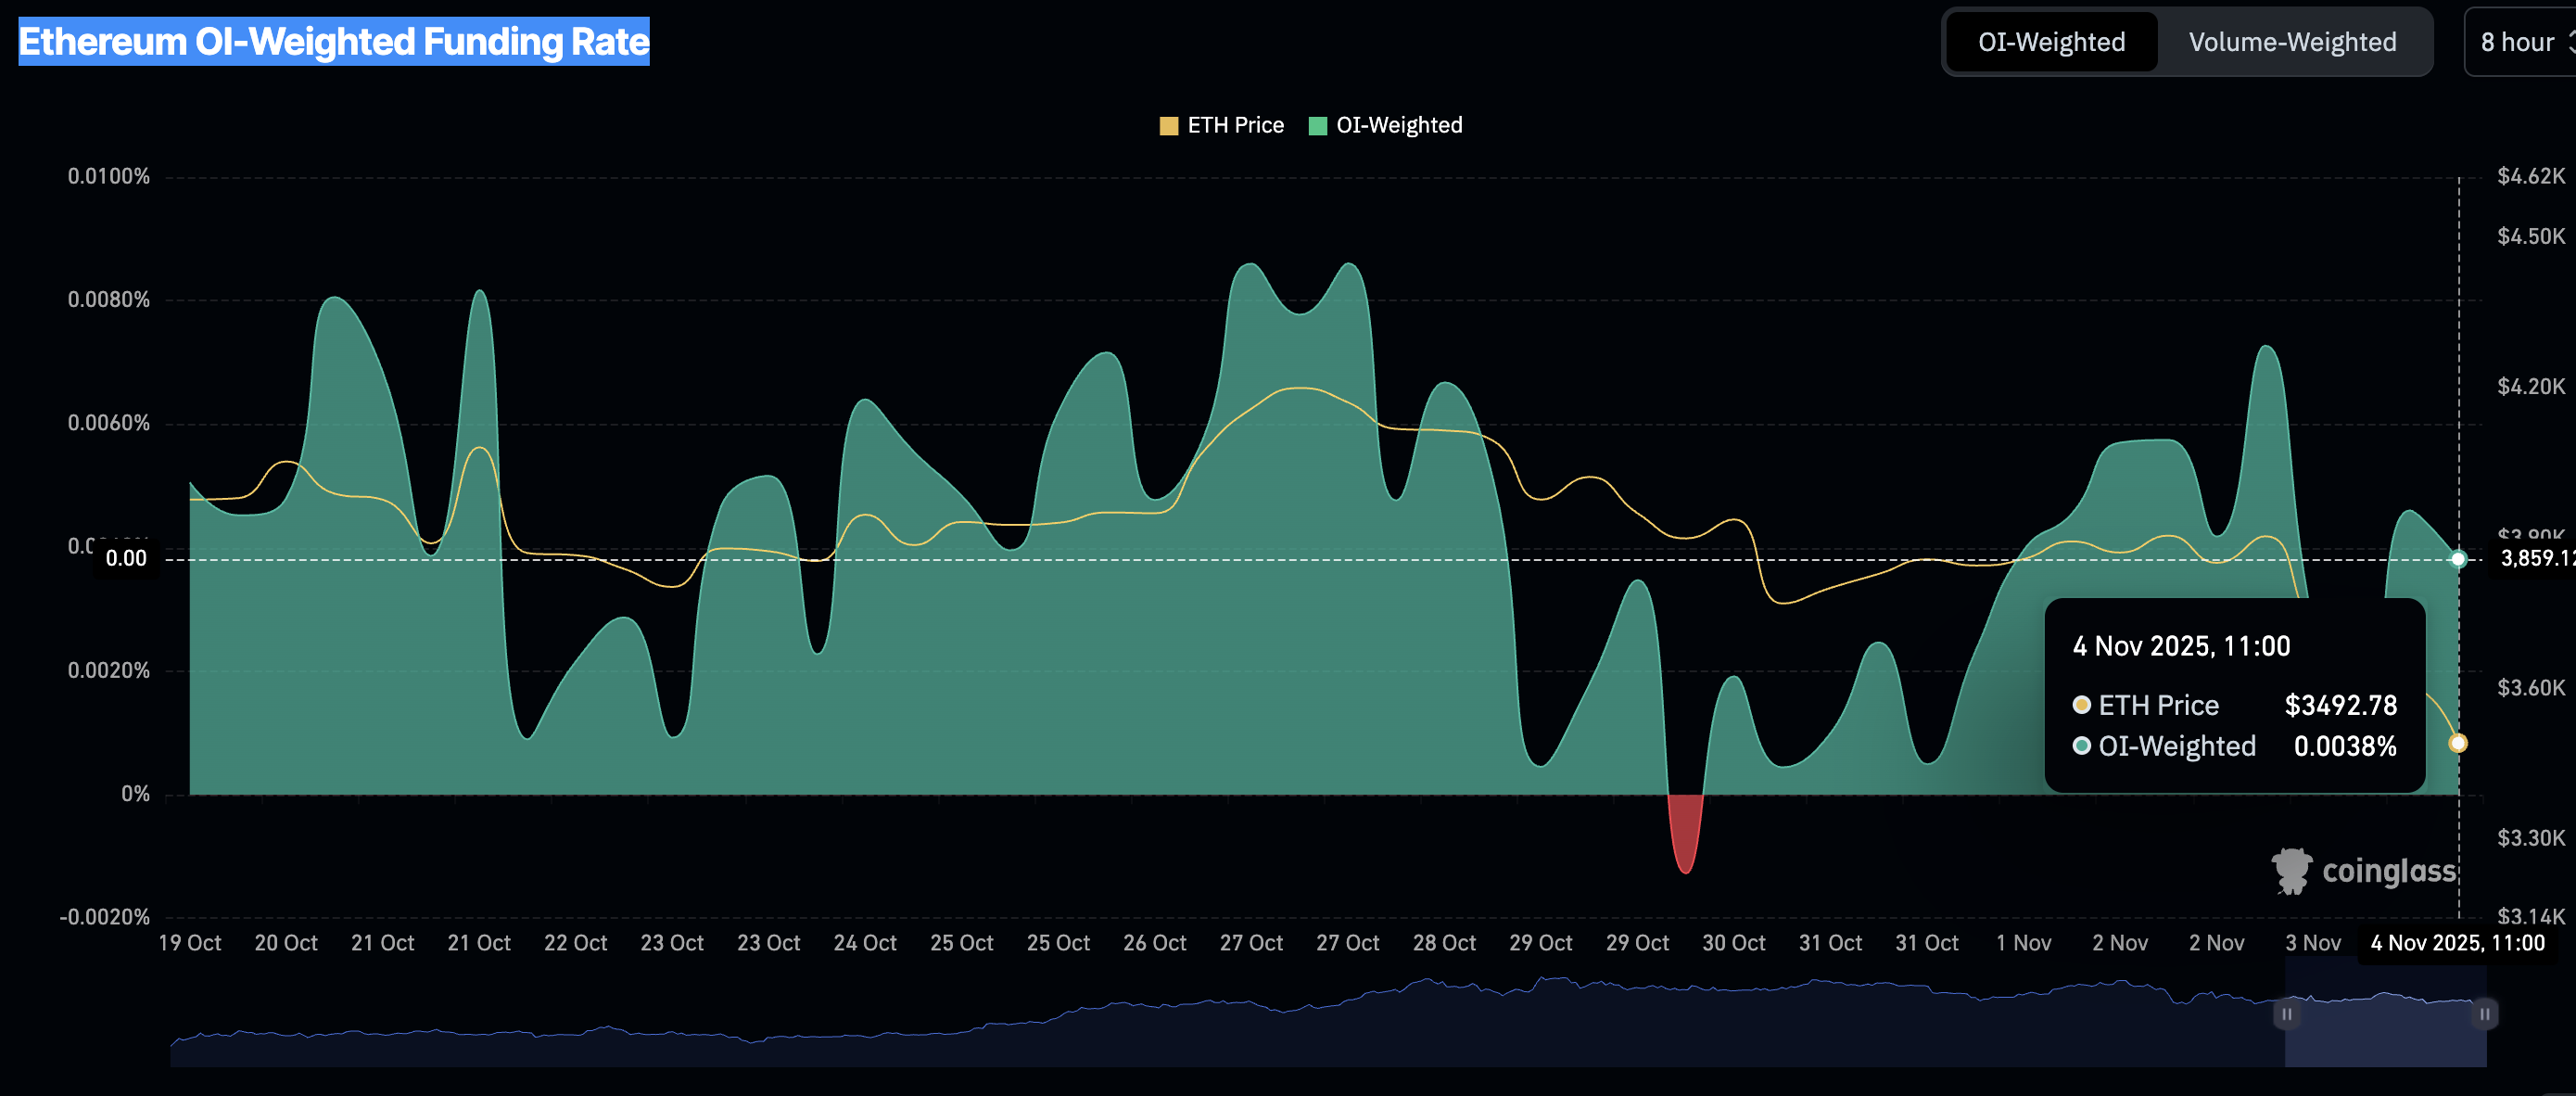
Ethereum OI-Weighted Funding Rate | Source: CoinGlass
Technical outlook: Ethereum sell-off lingers amid bearish signals
Ethereum is trading around $3,500 at the time of writing on Tuesday, largely weighed down by a weak retail market, low institutional demand, and a lack of price catalysts to sustain the recovery.
Technical indicators, including the Moving Average Convergence Divergence (MACD), signal a bearish trend on the daily chart. The MACD has maintained a sell signal since Monday, with the blue line remaining below the red line, suggesting investors reduce their exposure in favor of short positions.
The Relative Strength Index (RSI) is at 33 and falling toward oversold territory within the same daily time frame, suggesting that bearish momentum could persist in the short term.
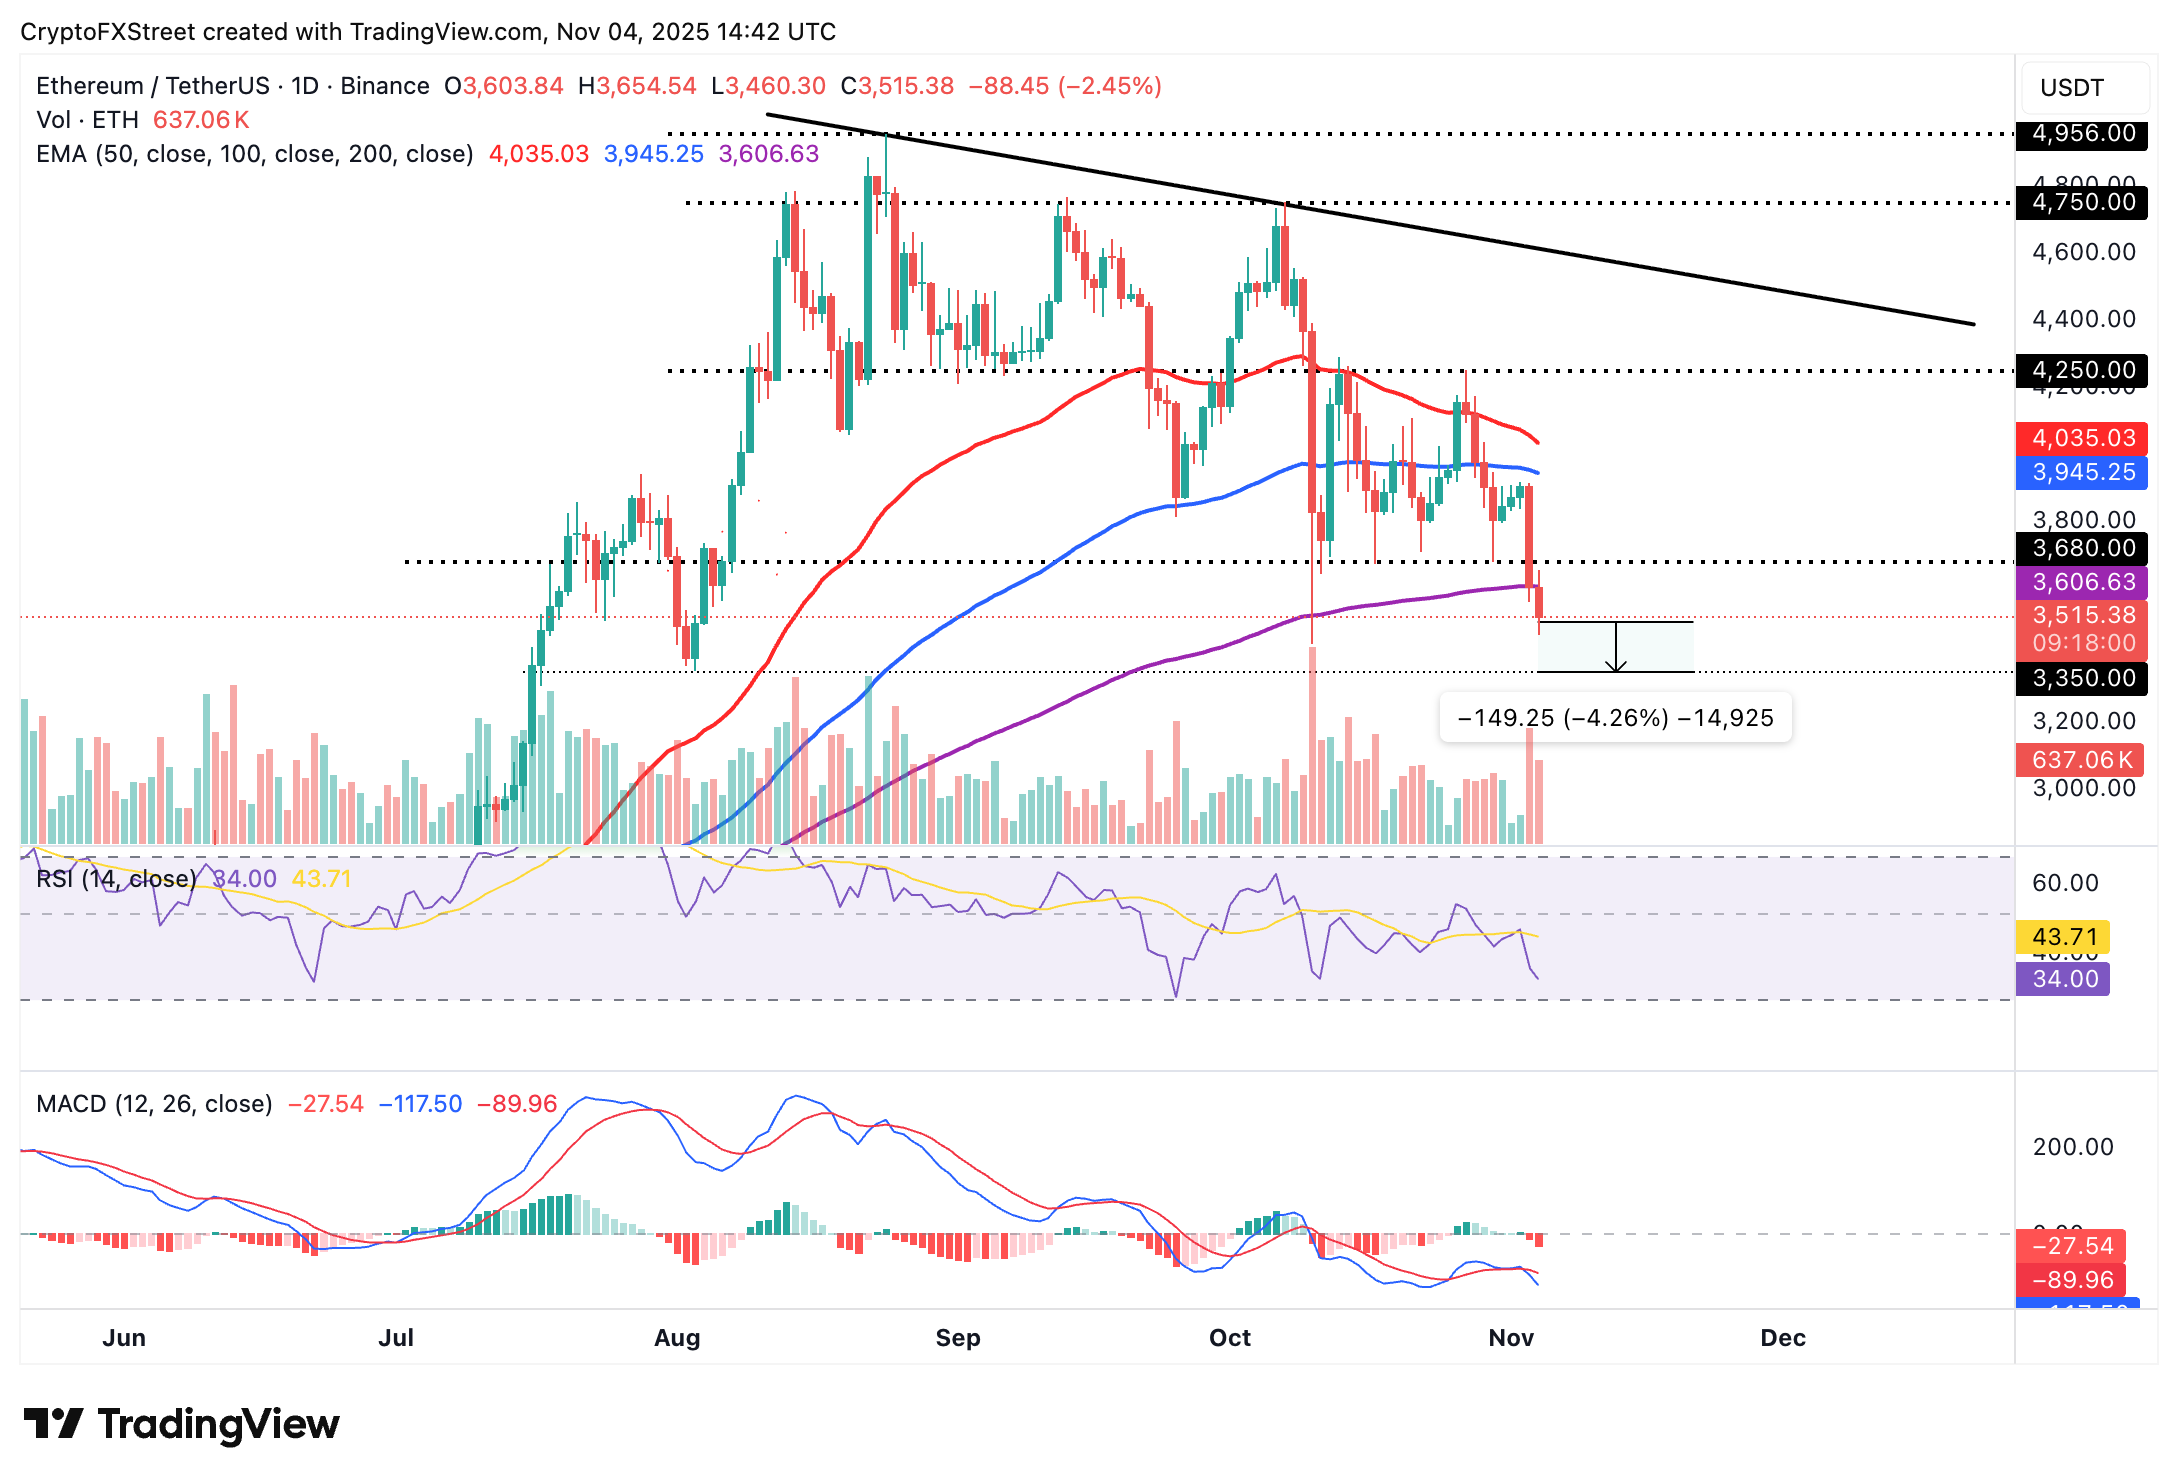
ETH/USDT daily chart
If Ethereum closes the day below the round-number support at $3,500, a 4% drop to $3,350 may follow. This is a support area previously tested in early August. Still, a knee-jerk reversal could occur if bulls buy the dip, further strengthening the tailwind to push ETH above the 200-day Exponential Moving Average (EMA) at $3,606.
Open Interest, funding rate FAQs
Higher Open Interest is associated with higher liquidity and new capital inflow to the market. This is considered the equivalent of increase in efficiency and the ongoing trend continues. When Open Interest decreases, it is considered a sign of liquidation in the market, investors are leaving and the overall demand for an asset is on a decline, fueling a bearish sentiment among investors.
Funding fees bridge the difference between spot prices and prices of futures contracts of an asset by increasing liquidation risks faced by traders. A consistently high and positive funding rate implies there is a bullish sentiment among market participants and there is an expectation of a price hike. A consistently negative funding rate for an asset implies a bearish sentiment, indicating that traders expect the cryptocurrency’s price to fall and a bearish trend reversal is likely to occur.
추천 기사


