
Crypto Today: Bitcoin, Ethereum, XRP bulls hold steady amid ETF inflows resurgence
- Bitcoin remains above $114,000 as institutions and retail investors increase exposure.
- Ethereum reclaims its position above the 50-day EMA, supported by ETF inflows and bullish sentiment.
- XRP rebounds above $2.61 short-term support as the derivatives market strengthens.
Bitcoin (BTC) shows signs of resuming its uptrend above $114,000 on Tuesday, after being rejected slightly below $116,500 the previous day. Altcoins, including Ethereum (ETH) and Ripple (XRP), are holding steady, as investors look forward to a potentially bullish end of the month.
Data spotlight: Bitcoin, Ethereum stable amid rising institutional demand
Bitcoin has stabilized above $114,000, backed by steady inflows into Exchange Traded Funds (ETFs). US-listed BTC spot ETFs saw approximately $149 million in net inflows on Monday. The demand for BTC ETFs builds on last week’s momentum, which saw a total of $446 million in inflow volume.
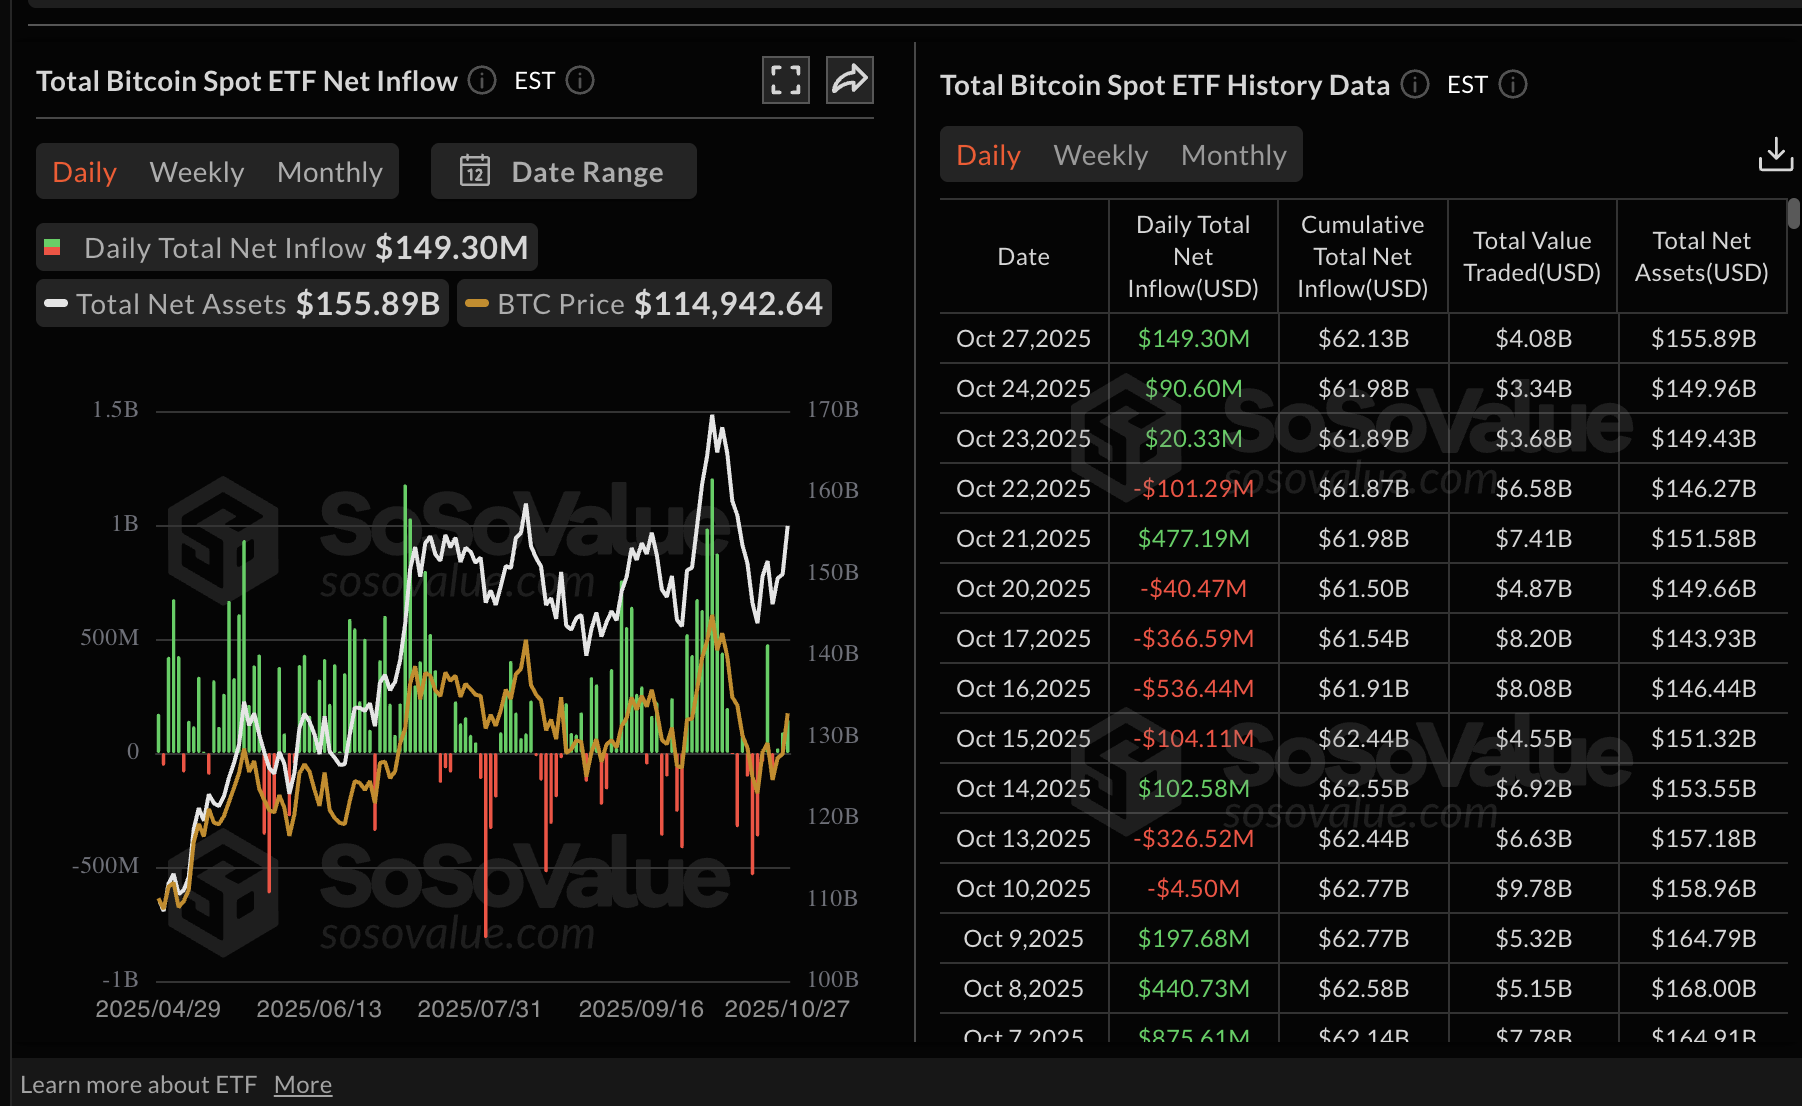
Bitcoin spot ETF stats | Source: SoSoValue
After three consecutive days of outflows, Ethereum spot ETFs posted $134 million in inflows on Monday, bringing the cumulative total net inflow to $14.49 billion and the net assets to $28.35 billion.
The turnaround in institutional risk appetite follows the Ethereum price increase above the critical $4,000 level. If this trend continues, it would strengthen Ethereum’s short-term bullish outlook, increasing the odds of a return above the critical $4,500 resistance.
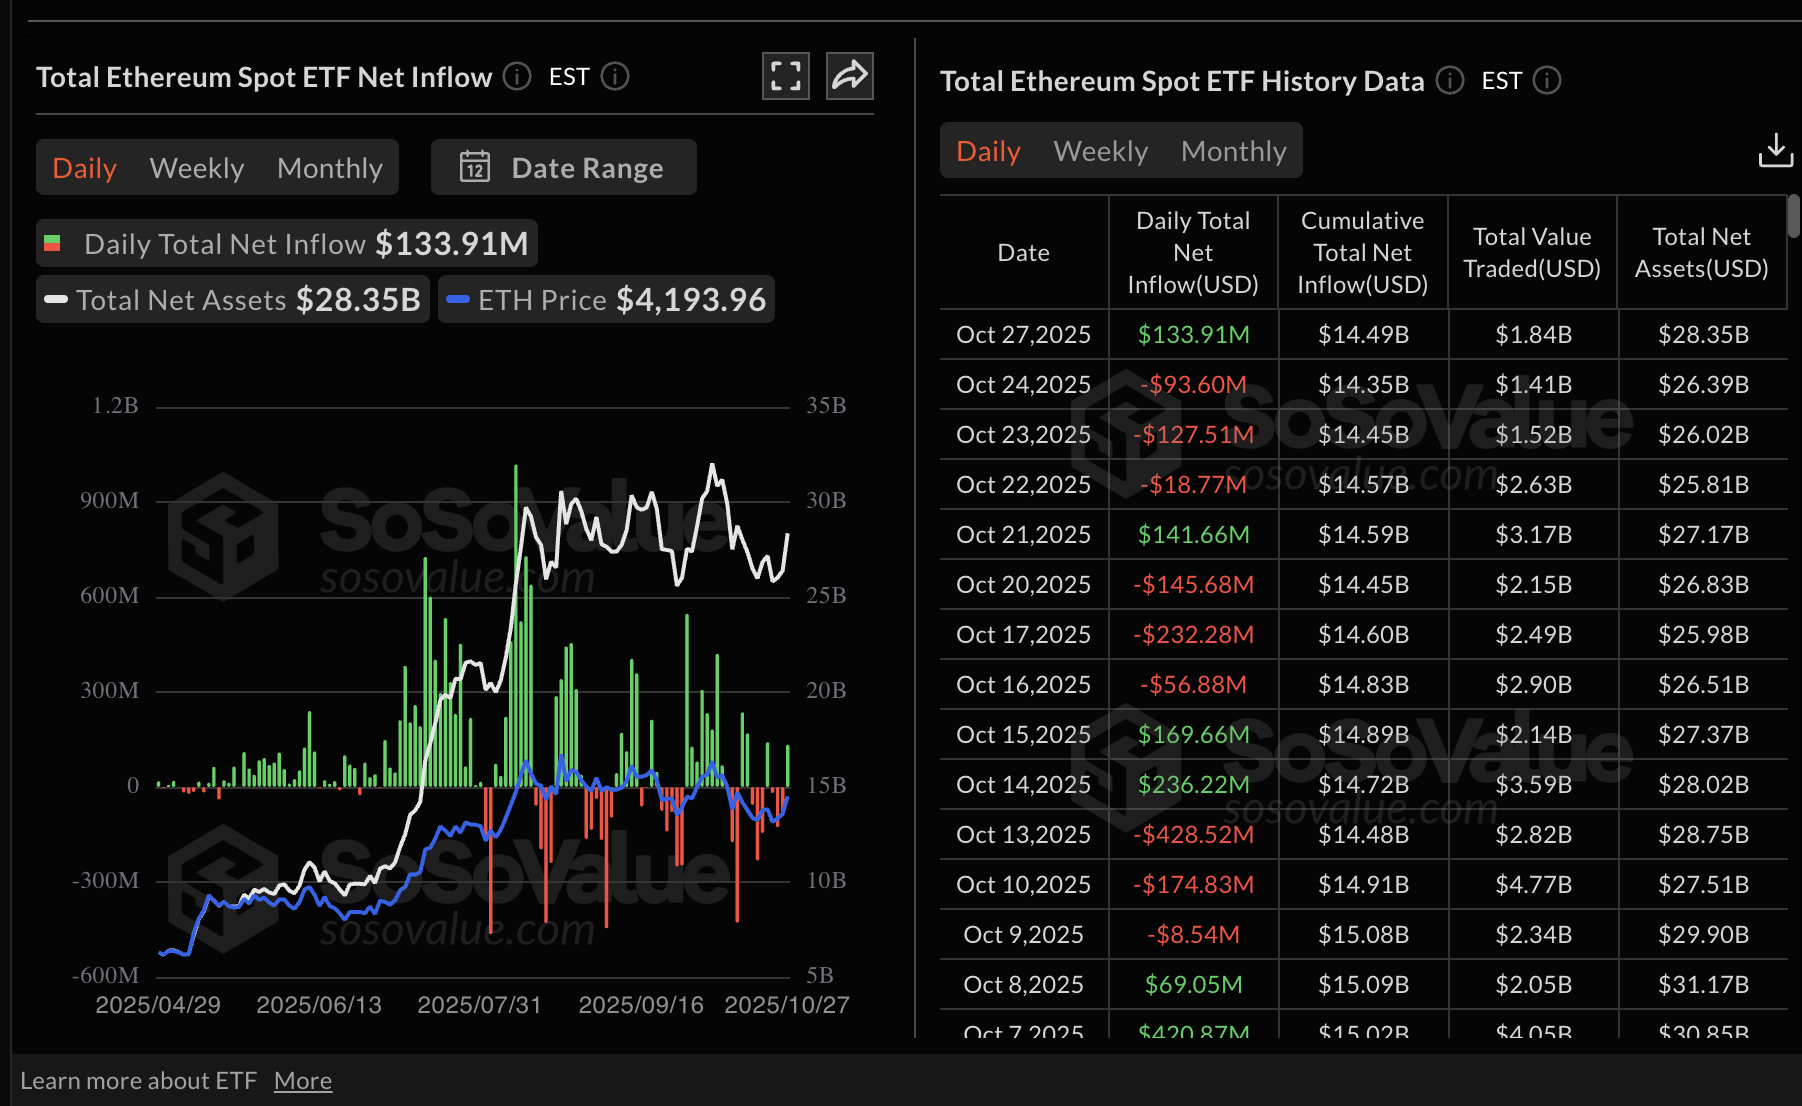
Ethereum spot ETF stats | Source: SoSoValue
Meanwhile, retail interest in XRP is gaining momentum, as evidenced by the futures Open Interest (XRP), which averages $4.51 billion as of writing on Tuesday. According to CoinGlass data, OI, which tracks the notional value of outstanding futures contracts, plunged to $3.49 billion on October 19, the lowest level since late April, as risk-off sentiment spread across the cryptocurrency market amid macroeconomic uncertainty and the trade standoff between the US and China.
The increase in OI suggests that risk appetite is returning among retail traders, which may continue to support the current recovery.
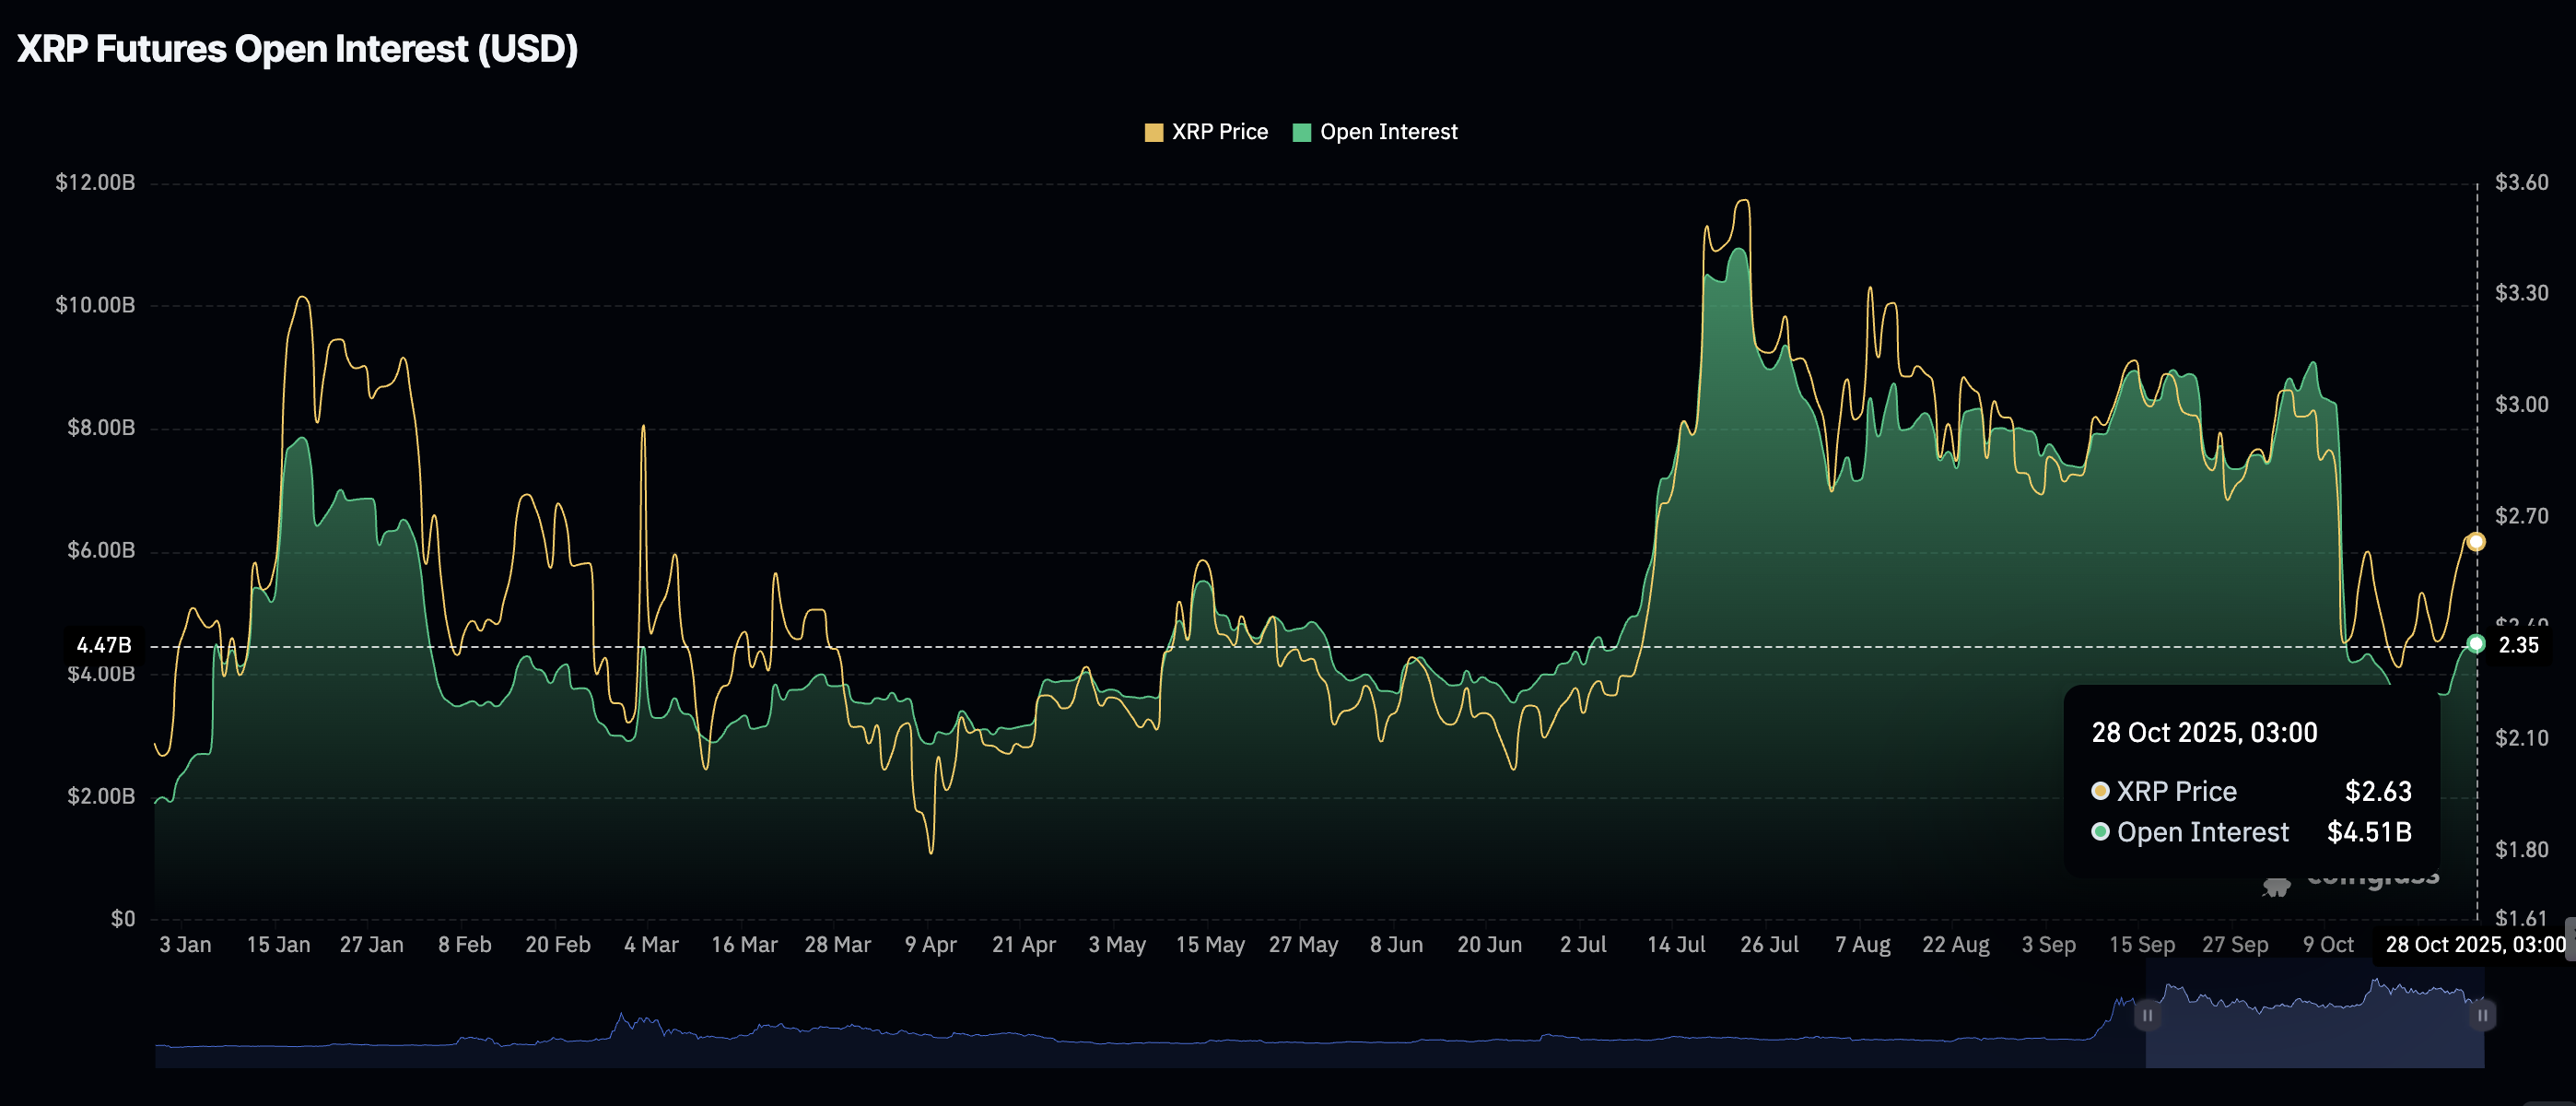
XRP Open Interest | Source: CoinGlass
Chart of the day: Bitcoin bulls defend key support
Bitcoin is trading above the 50-day Exponential Moving Average (EMA) at $113,406, a key support level on the daily chart. Following the rejection from resistance under $116,000 on Monday, BTC collected liquidity above the 50-day EMA, which helped accelerate the current rebound above $114,000.
The Moving Average Convergence Divergence (MACD) indicator reinforces the uptrend by sustaining a buy signal since Sunday. Investors will be inclined to increase exposure as long as the blue MACD line remains above the red signal line.
The Relative Strength Index (RSI) has risen to 53, reinforcing the bullish outlook. Higher RSI readings approaching overbought territory indicate that bullish momentum is increasing.
A break above the $116,000 resistance would go a long way toward validating Bitcoin’s short-term bullish outlook. As more investors increase exposure, the chances of a breakout above $120,000 significantly increase.
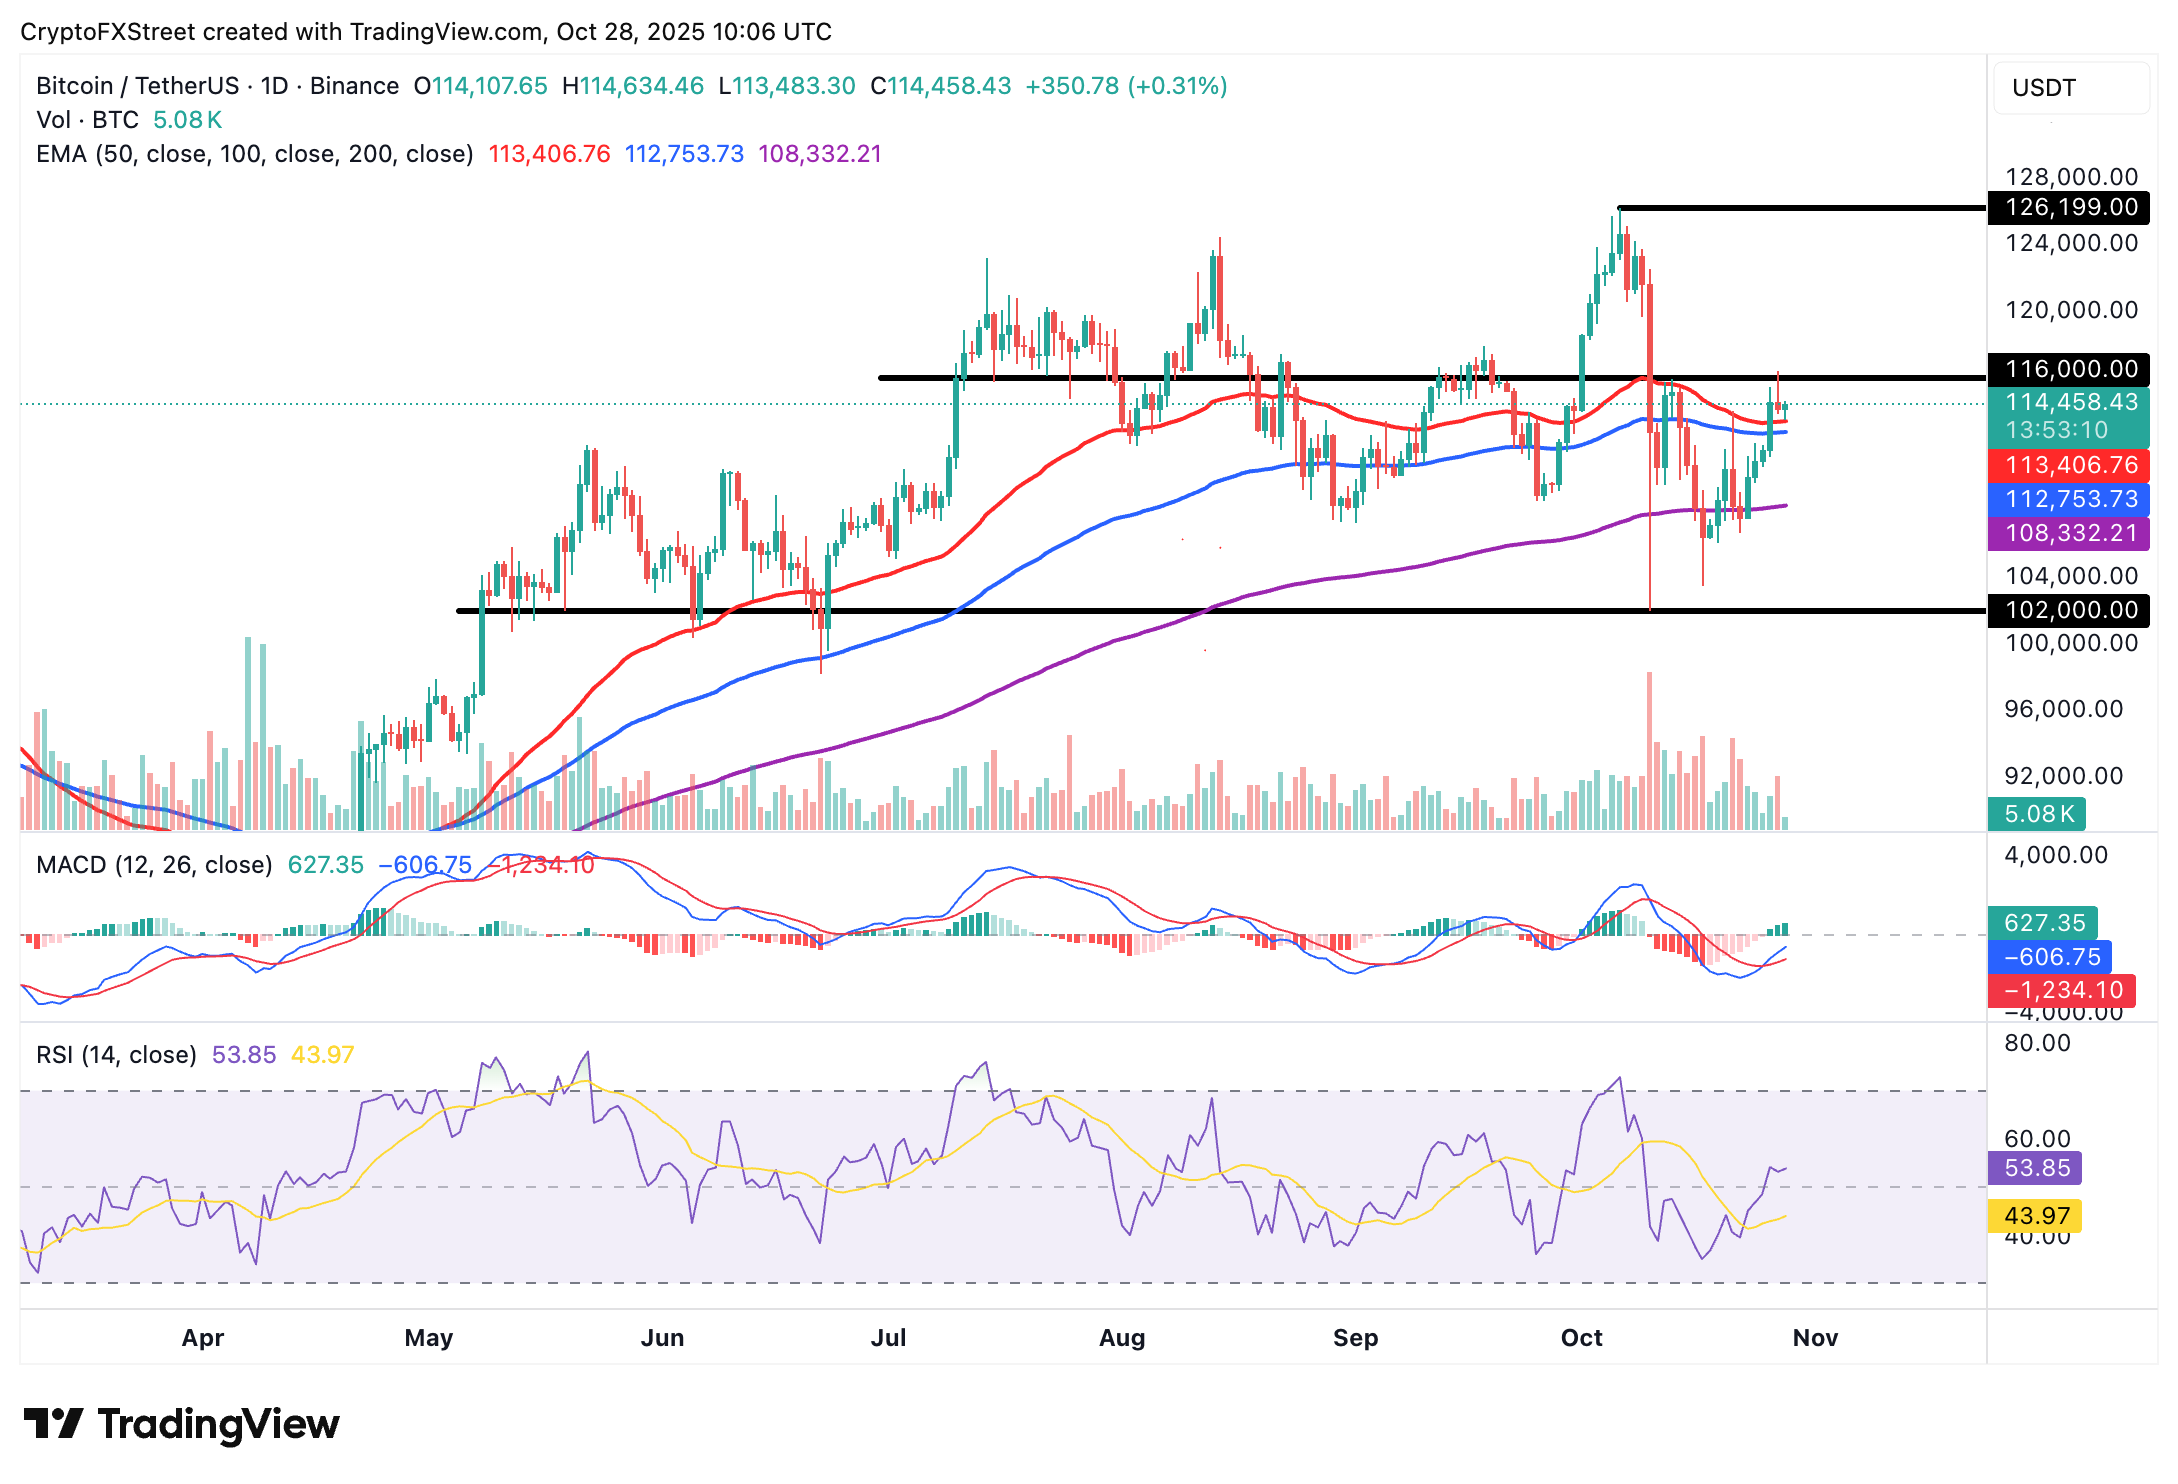
BTC/USDT daily chart
Altcoins update: Ethereum, XRP offer mixed signals
Ethereum pares intraday losses at the time of writing on Monday, hinting at headwinds stemming from that profit-taking. The rejection from resistance at around $4,253 pointed to structural weakness, encouraging traders to book early profits.
The RSI, at 51 and pointing downward, is signaling a decline in bullish momentum. If the RSI declines below the midline, the path of least resistance could remain downward. The 100-day EMA at $3,973 is in line to absorb selling pressure and prevent an extended pullback toward the 200-day EMA at $3,595.
Conversely, the MACD has maintained a buy signal since Sunday, strengthening ETH’s short-term bullish potential. Investors will likely continue to increase their risk exposure with the blue MACD line remaining above the red signal line as the indicator generally rises.
Recovery above the immediate 50-day EMA resistance at $4,125 would pave the way for an extended uptrend toward the next key hurdle at $4,750, which was last tested on October 7.
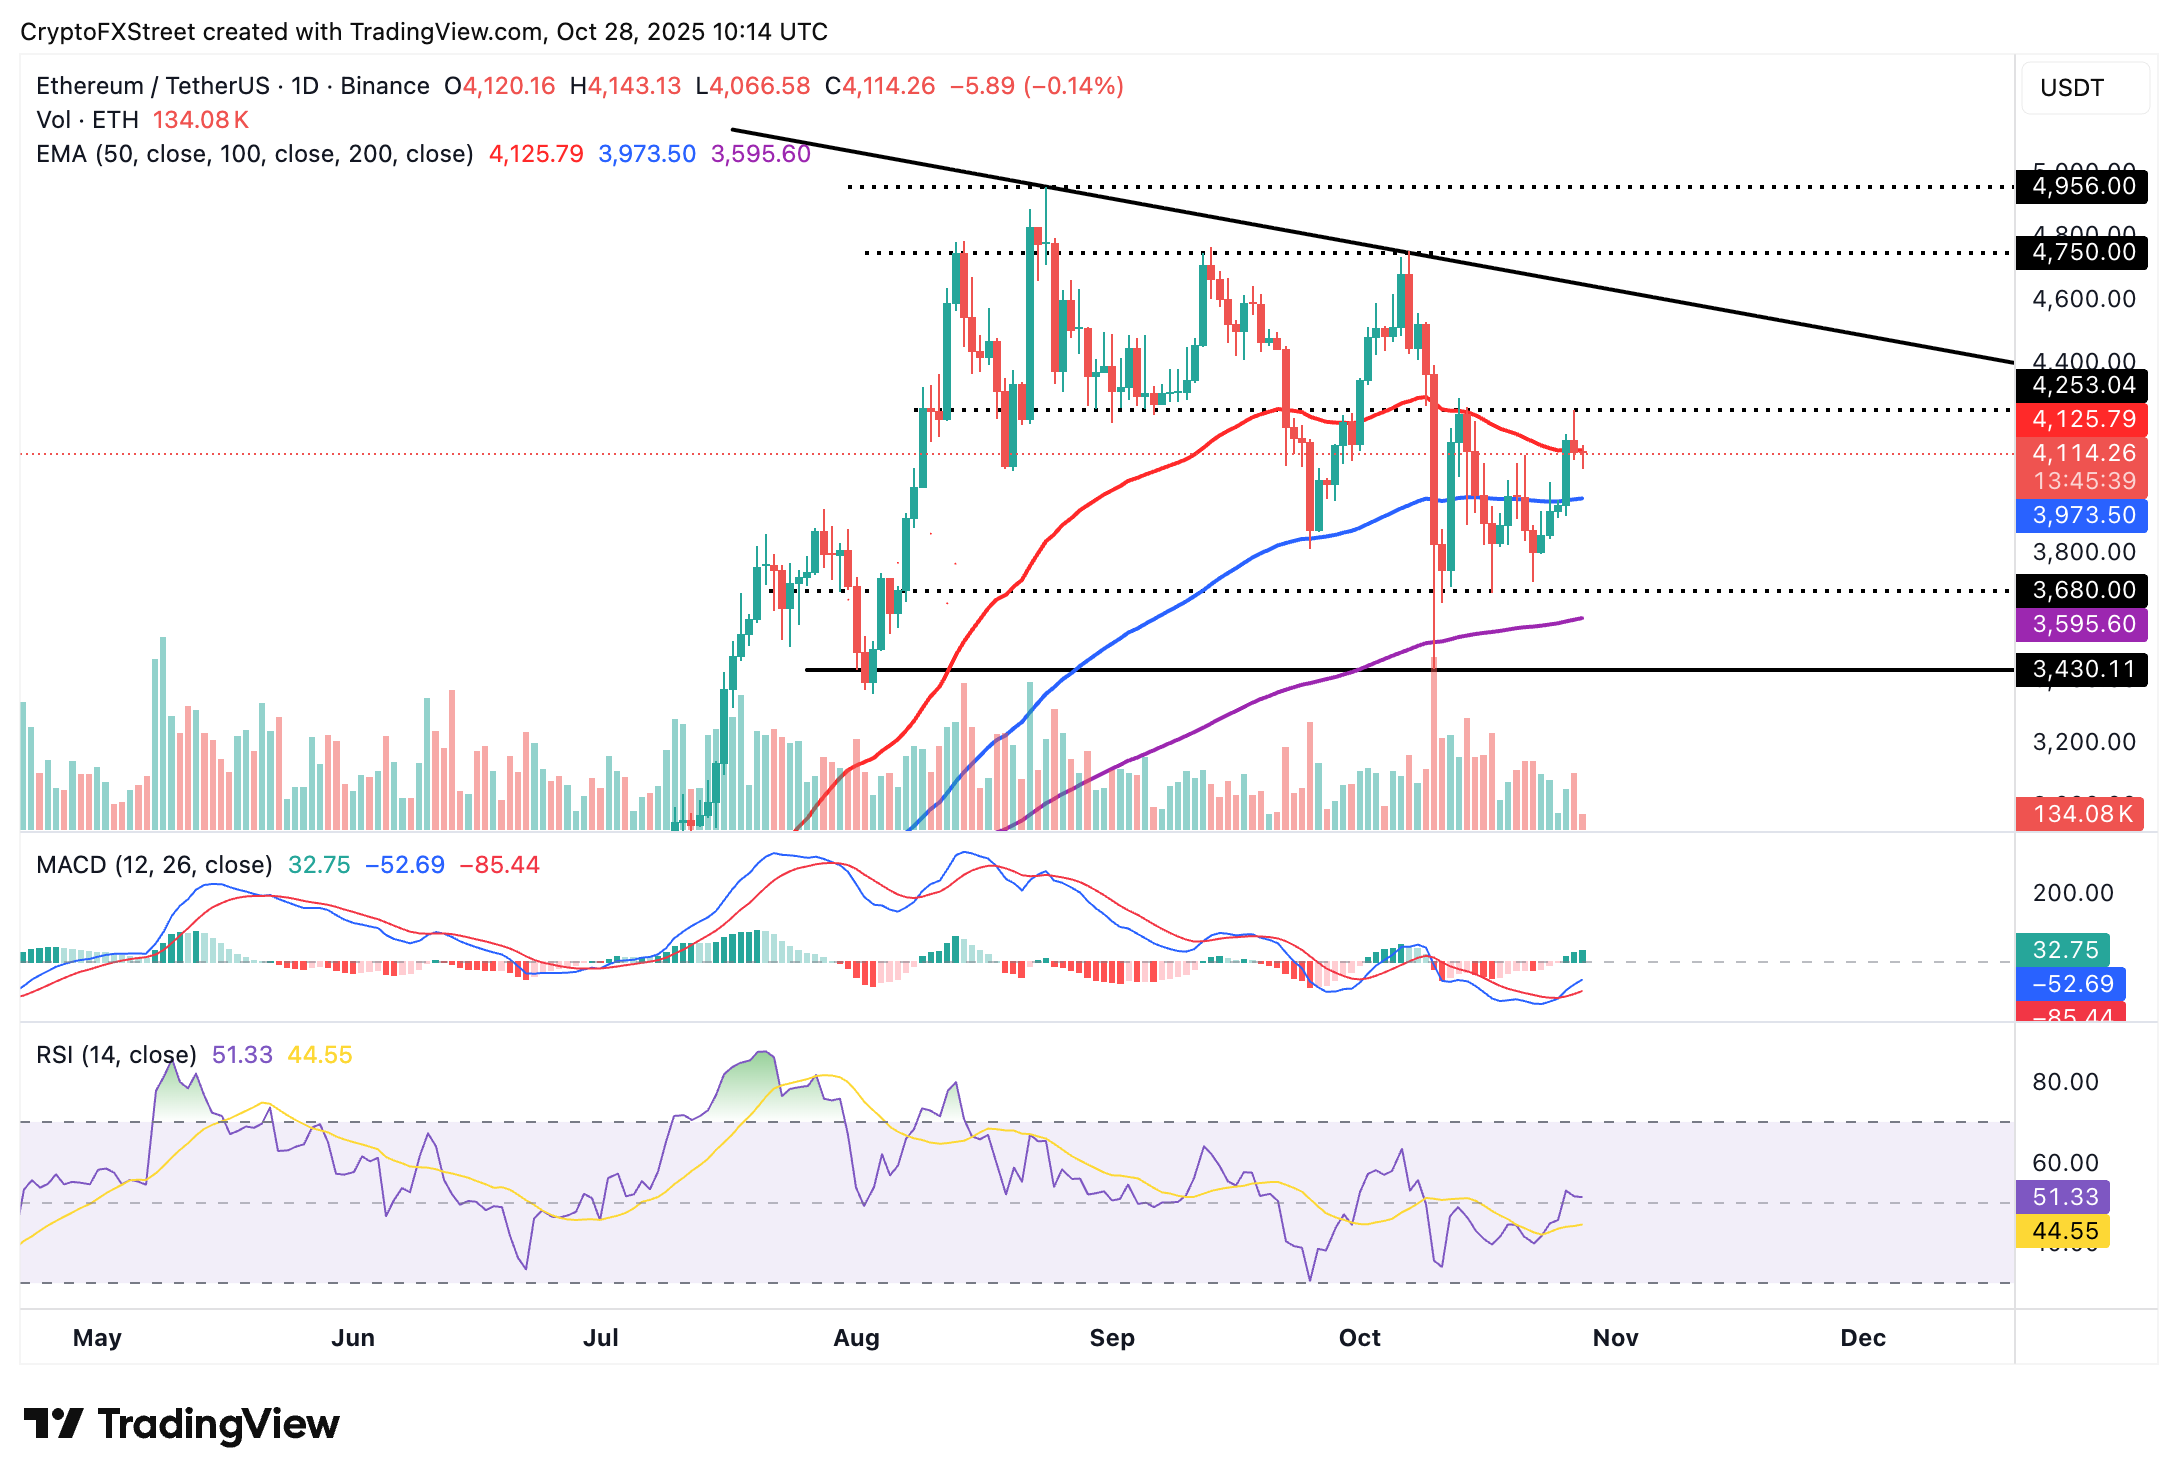
ETH/USDT daily chart
As for XRP, the price is fluctuating between the 200-day EMA support at $2.61 and the 50-day EMA resistance at $2.68. The 100-day EMA sits slightly above this level at $2.73.
Key indicators, including the MACD and the RSI, back XRP’s short-term bullish outlook. The MACD issued a buy signal on Friday, prompting investors to increase their exposure. Similarly, the RSI rising to 53 suggests that bullish momentum is increasing.
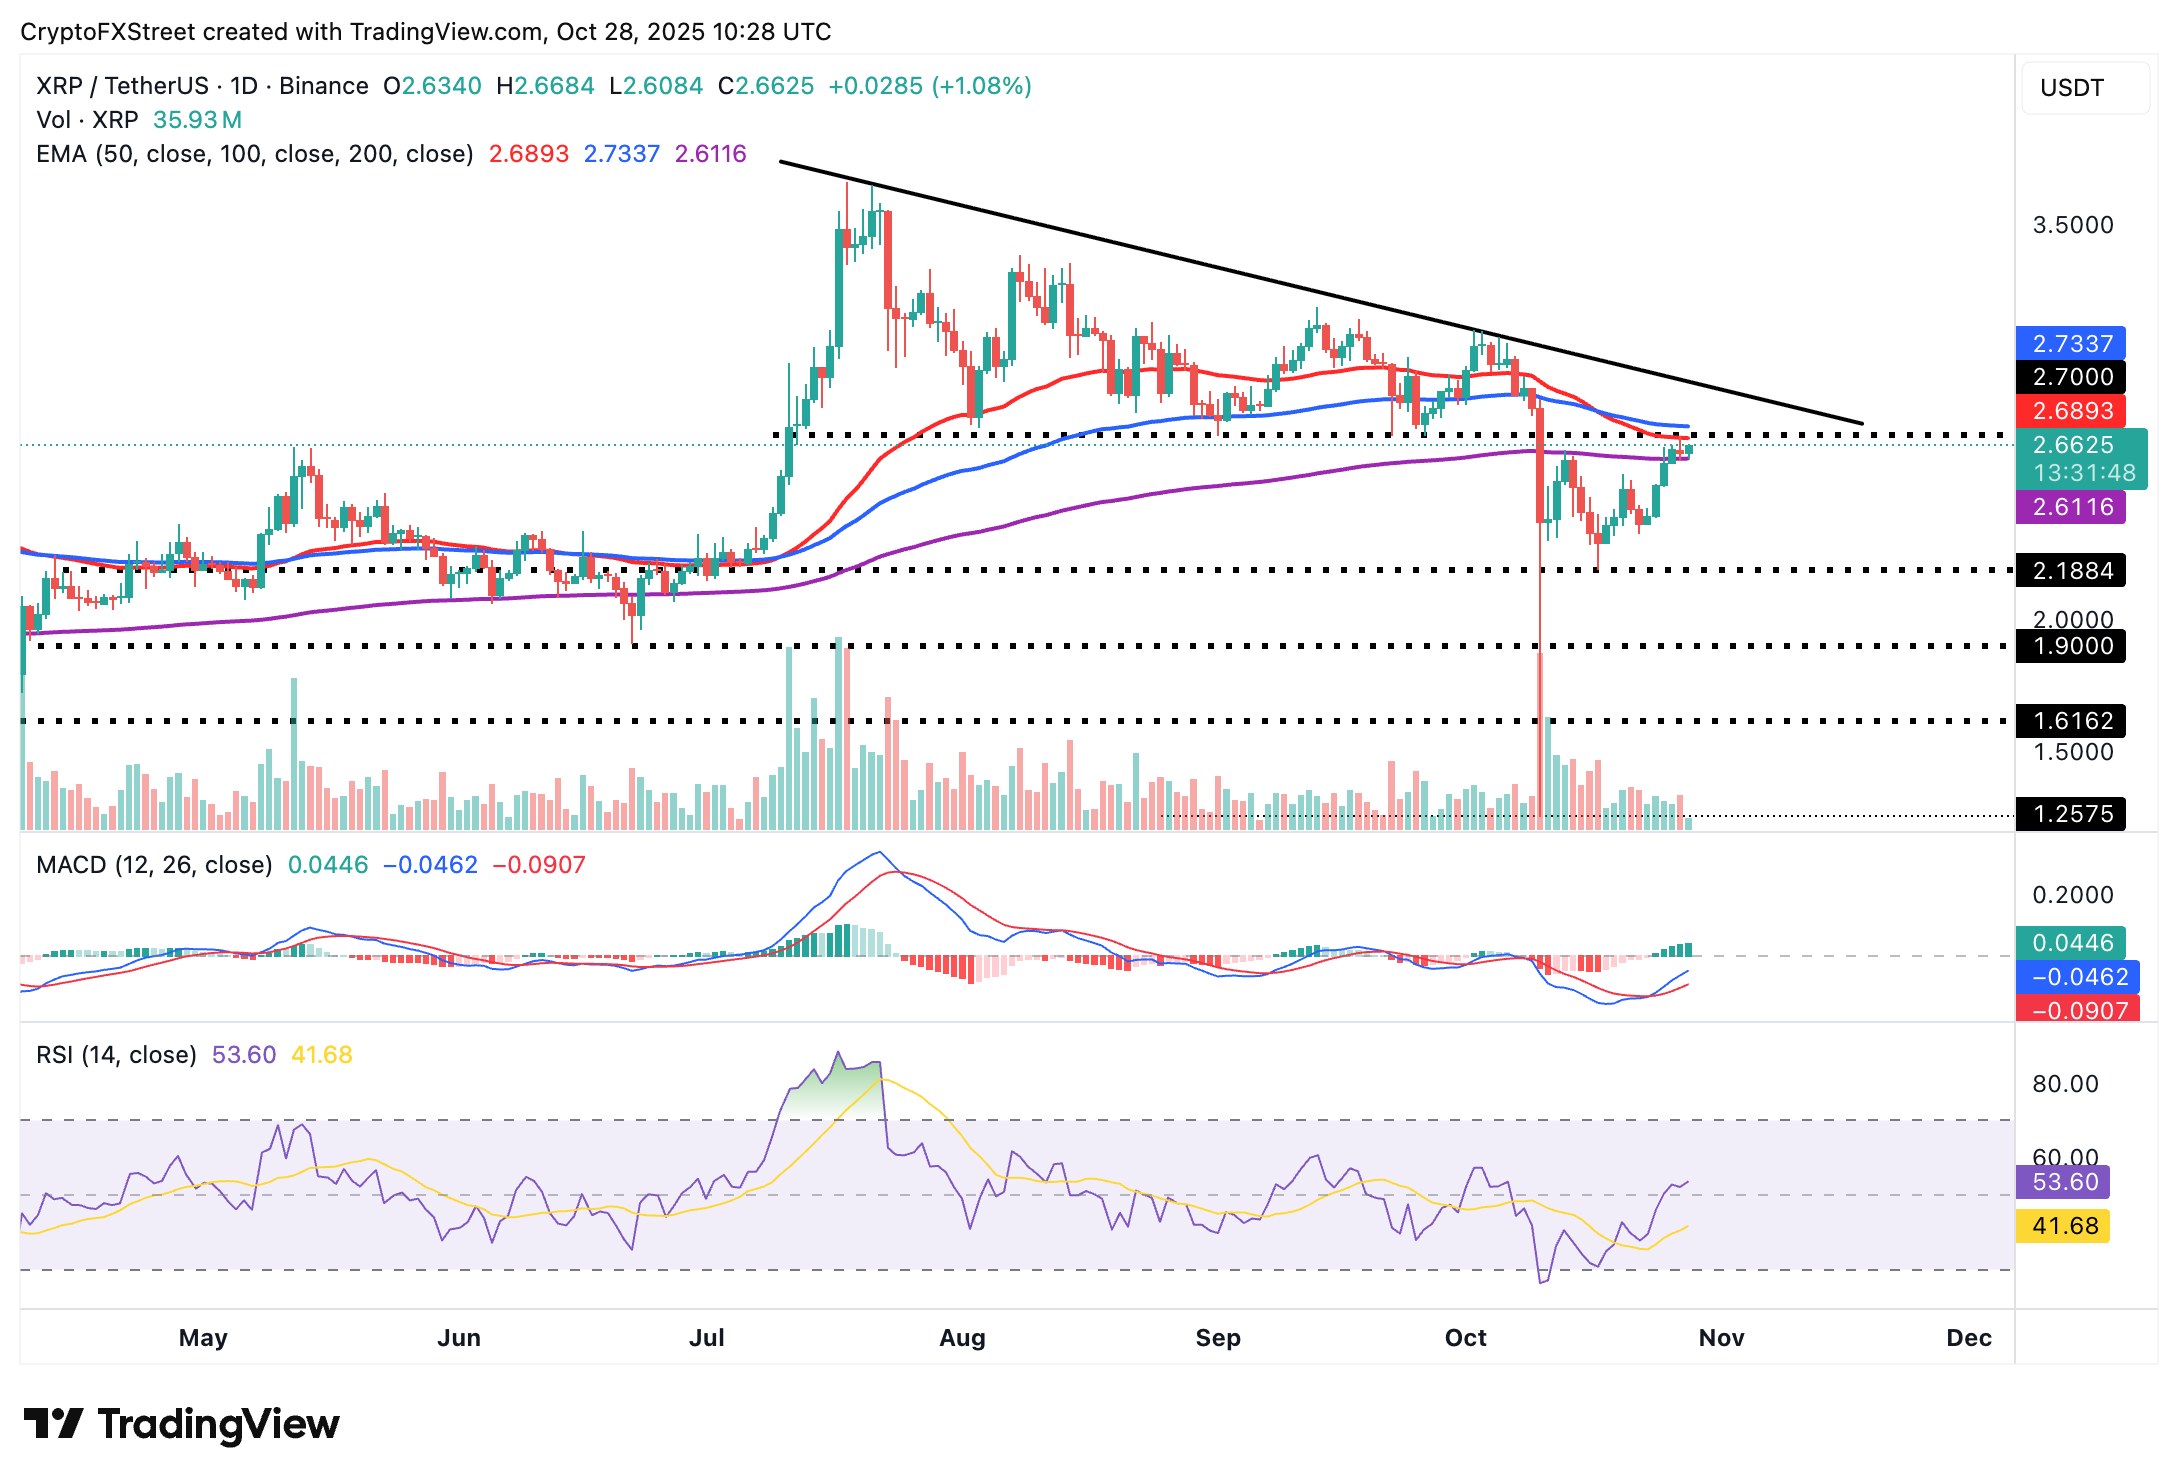
XRP/USDT daily chart
Still, traders must not lose sight of lower support levels at $2.18 and $1.90 in case a reversal accelerates amid potential profit-taking.
Crypto ETF FAQs
An Exchange-Traded Fund (ETF) is an investment vehicle or an index that tracks the price of an underlying asset. ETFs can not only track a single asset, but a group of assets and sectors. For example, a Bitcoin ETF tracks Bitcoin’s price. ETF is a tool used by investors to gain exposure to a certain asset.
Yes. The first Bitcoin futures ETF in the US was approved by the US Securities & Exchange Commission in October 2021. A total of seven Bitcoin futures ETFs have been approved, with more than 20 still waiting for the regulator’s permission. The SEC says that the cryptocurrency industry is new and subject to manipulation, which is why it has been delaying crypto-related futures ETFs for the last few years.
Yes. The SEC approved in January 2024 the listing and trading of several Bitcoin spot Exchange-Traded Funds, opening the door to institutional capital and mainstream investors to trade the main crypto currency. The decision was hailed by the industry as a game changer.
The main advantage of crypto ETFs is the possibility of gaining exposure to a cryptocurrency without ownership, reducing the risk and cost of holding the asset. Other pros are a lower learning curve and higher security for investors since ETFs take charge of securing the underlying asset holdings. As for the main drawbacks, the main one is that as an investor you can’t have direct ownership of the asset, or, as they say in crypto, “not your keys, not your coins.” Other disadvantages are higher costs associated with holding crypto since ETFs charge fees for active management. Finally, even though investing in ETFs reduces the risk of holding an asset, price swings in the underlying cryptocurrency are likely to be reflected in the investment vehicle too.
추천 기사


