
Crypto Today: Bitcoin, Ethereum, XRP extend recovery as derivatives market stabilizes
- Bitcoin reclaims $115,000 level following last week's sell-off to $102,000.
- Ethereum eyes a breakout above $4,500 as the futures Open Interest rebounds.
- XRP bulls tighten their grip, facing short-term resistance at the 200-day EMA.
Bitcoin (BTC) holds onto gains, trading at around $115,000 on Monday, as investors catch their breath following last week's sell-off. Total single-day liquidations in all cryptocurrencies hit $19 billion for the first time in history, with altcoins bearing the brunt of Friday's bearish event.
Ethereum (ETH) is back to trade above $4,100 at the time of writing, while Ripple (XRP) hovers at around $2.60. The total crypto market capitalization recovers above the $4 trillion mark from $3.78 trillion, as observed on Sunday, according to CoinGecko.
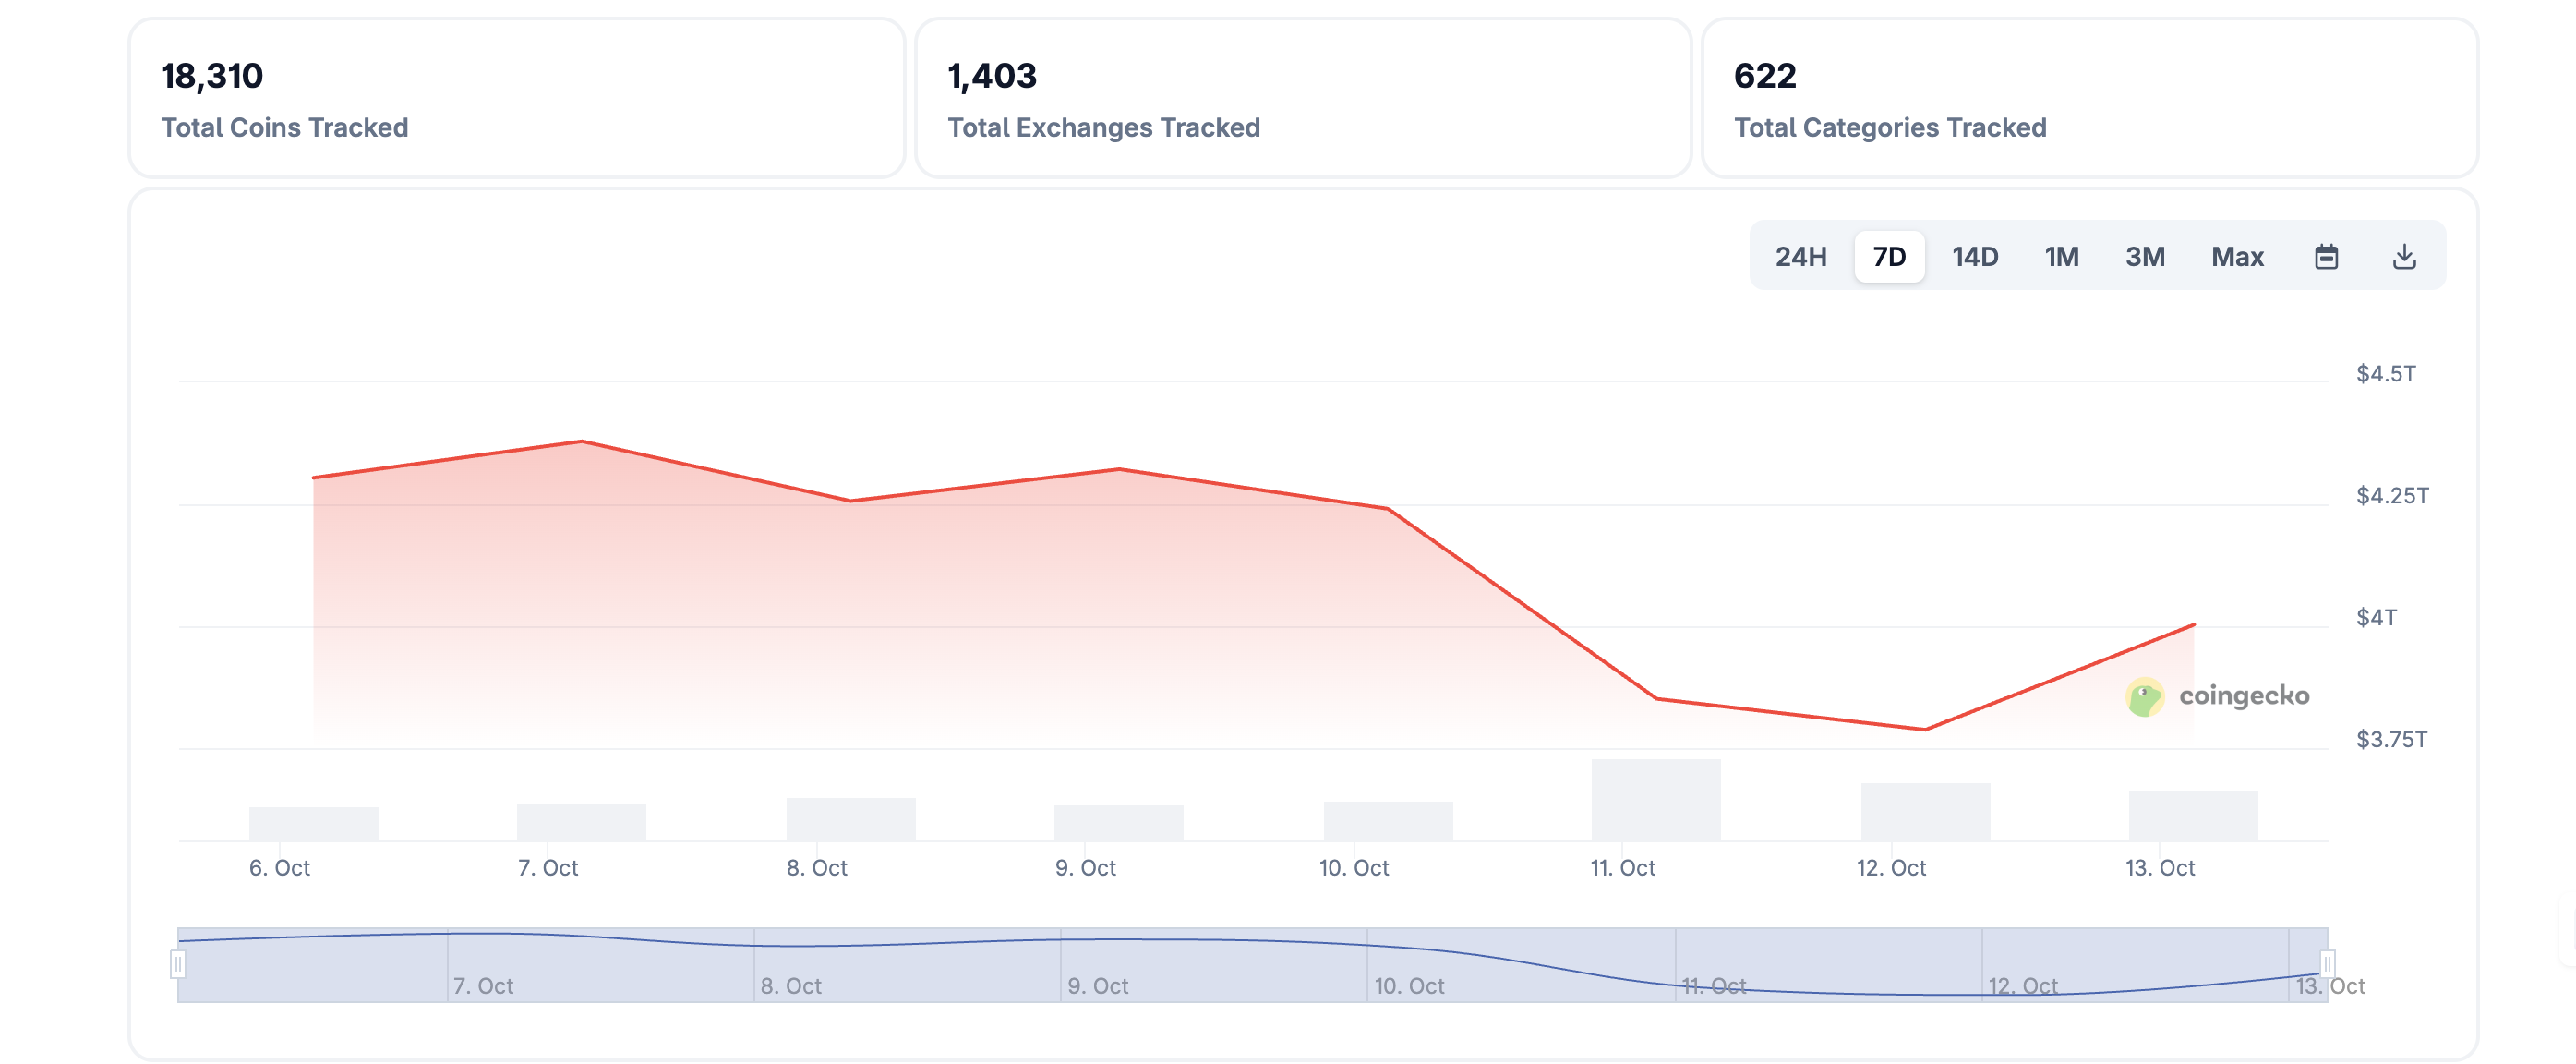
Crypto market capitalization | Source: CoinGecko
Market overview: BTC, ETH, XRP rebound on easing selling pressure
United States (US) President Donald Trump's comments on the trade situation with China on Friday spooked investors, resulting in a violent sell-off across markets, including equities and crypto.
President Trump mulled additional tariffs on China on top of other export controls, casting doubts on the existing trade truce between the two economic giants. Bitcoin extended the decline, briefly testing the $102,000 level before rebounding over the weekend.
Cumulative liquidations hit $19 billion for the first time in history, leaving leveraged traders counting losses. Despite overhanging macroeconomic uncertainty, the prices of Bitcoin, Ethereum and Ripple have regained strength, bringing relief to the battered traders.
Amid the uptick in price, the derivatives market has stabilized, with liquidations over the past 24 hours averaging $627 million. Approximately $420 million of short positions have been liquidated compared to $206 million in longs.
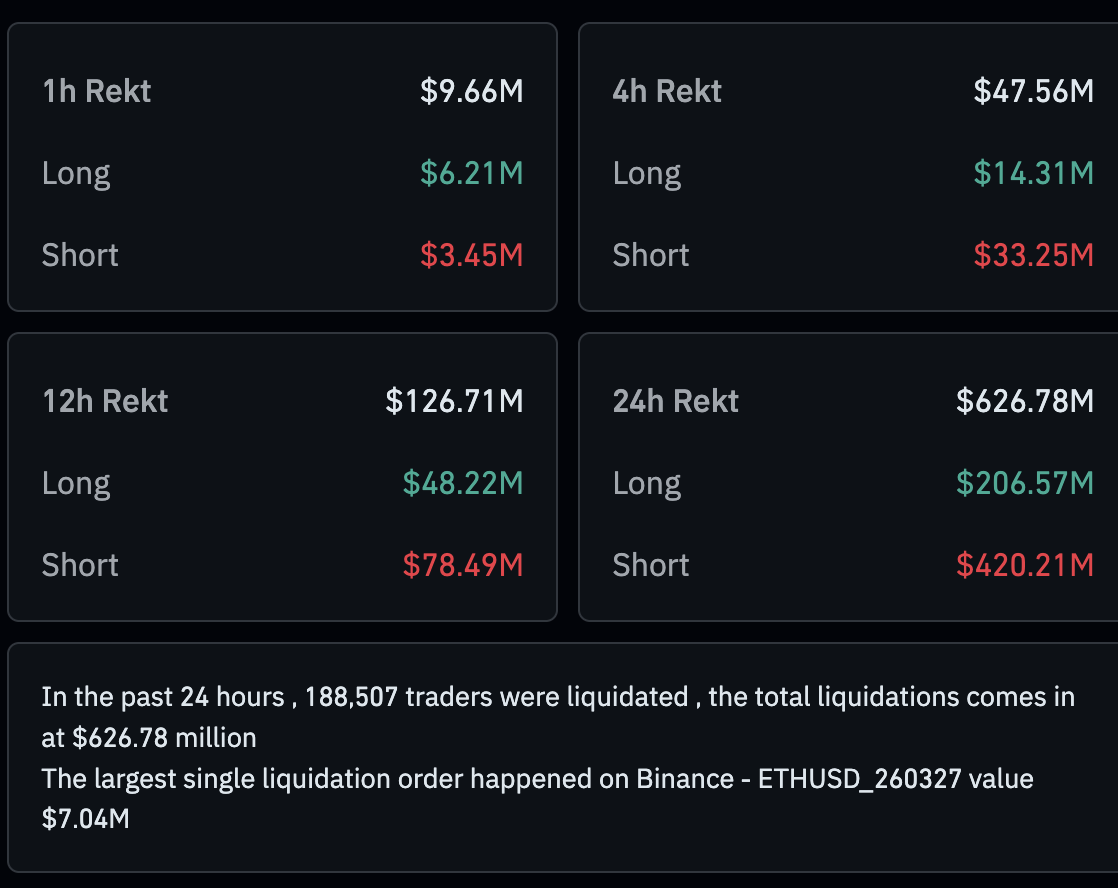
Crypto liquidations | Source: CoinGlass
Chart of the day: Bitcoin bulls regain control
Since the aggressive sell-off to $102,000 on Friday, Bitcoin bulls have tightened their grip. The largest digital asset by market capitalization holds above the $115,000 level, supported by an up-trending Relative Strength Index (RSI) at 47 on the daily chart. Additional movement of the RSI above the midline would indicate that bullish momentum is building, and increase the odds of Bitcoin breaking the resistance at $120,000.
Still, the 50-day Exponential Moving Average (EMA) currently at $115,627 is a resistance that must be broken to pave the way for the swing high.
Similarly, the Moving Average Convergence Divergence (MACD) indicator maintains a sell signal triggered on Friday. If the blue MACD line remains below the red signal line, traders will increasingly pile into short positions, anticipating a persistent decline. The 100-day EMA at $113,519 and the 200-day EMA at $107,981 are in line to absorb selling pressure.
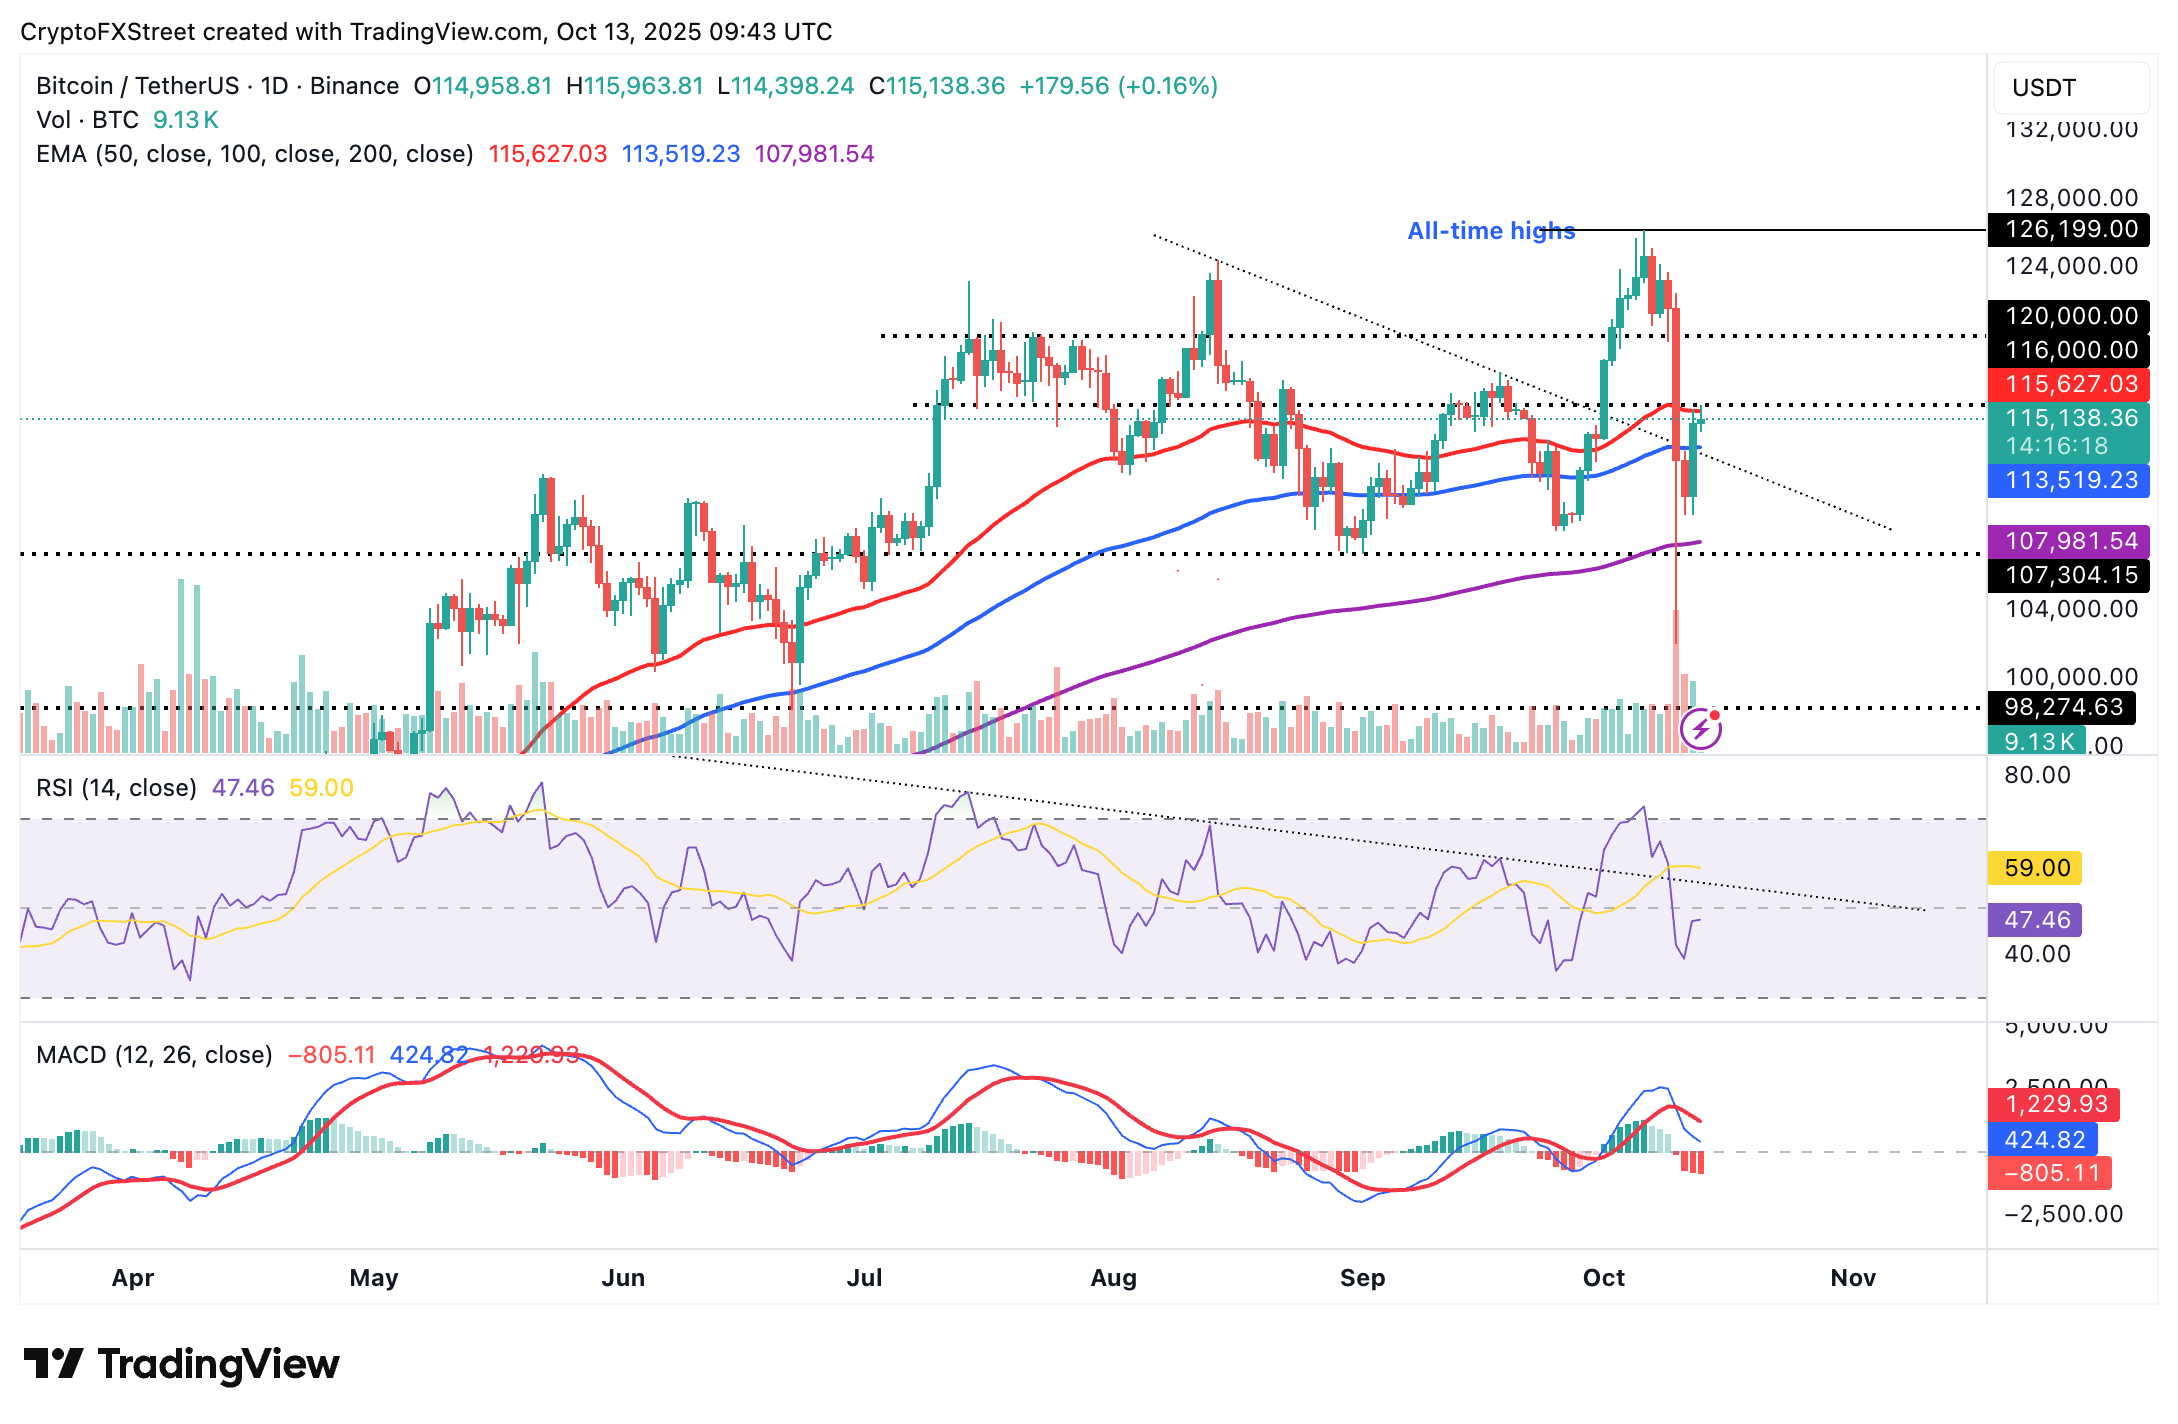
BTC/USDT daily chart
Altcoins update: Ethereum, XRP steady gains after sell-off
Ethereum has recouped part of the losses experienced last week, rising from $3,430 to trade between $4,100 and $4,200 as of Monday. The 100-day EMA at $3,973 and the 200-day EMA at $3,534 back the prevailing positive market sentiment.
Conversely, the 50-day EMA at $4,247 highlights a critical resistance that must be broken for bulls to tighten their grip further for a breakout above $4,500 and the general descending trendline. This trendline has been in place since late August, when Ethereum achieved a new record high of $4,956.
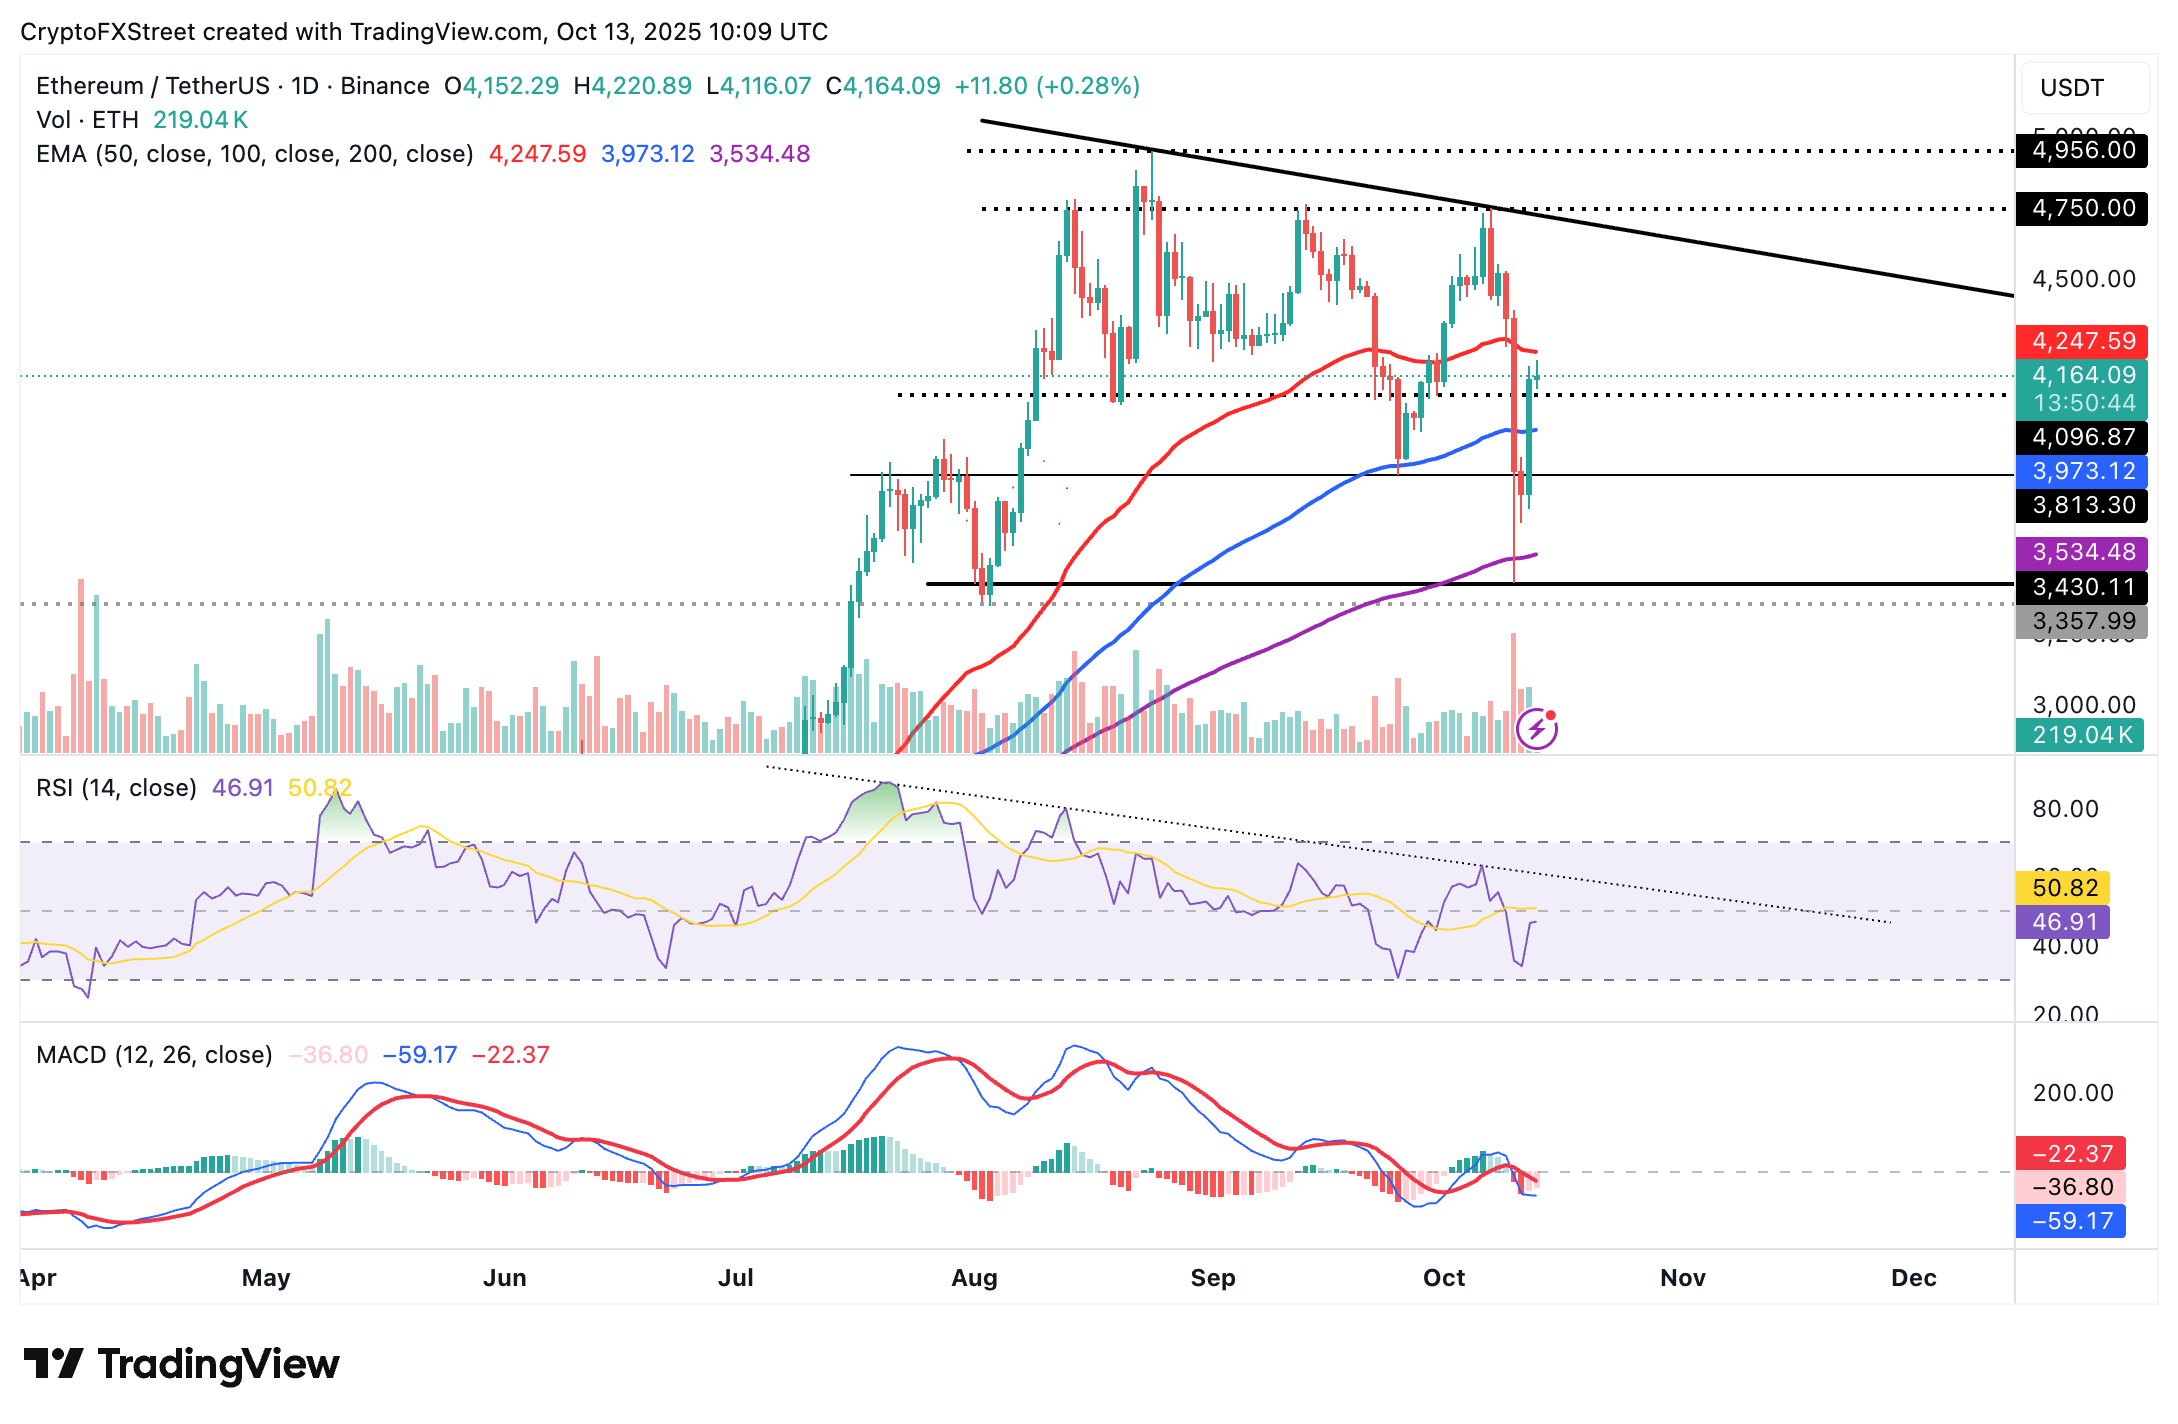
ETH/USDT daily chart
On the bright side, the Ethereum futures Open Interest (OI), representing the notional value of outstanding futures contracts, has rebounded to $75 billion after a sharp drop to approximately $70 billion on Saturday.
If the trend steadies this week, encouraging traders to seek risk exposure, the chances of Ethereum breaking higher toward its record high will significantly increase.
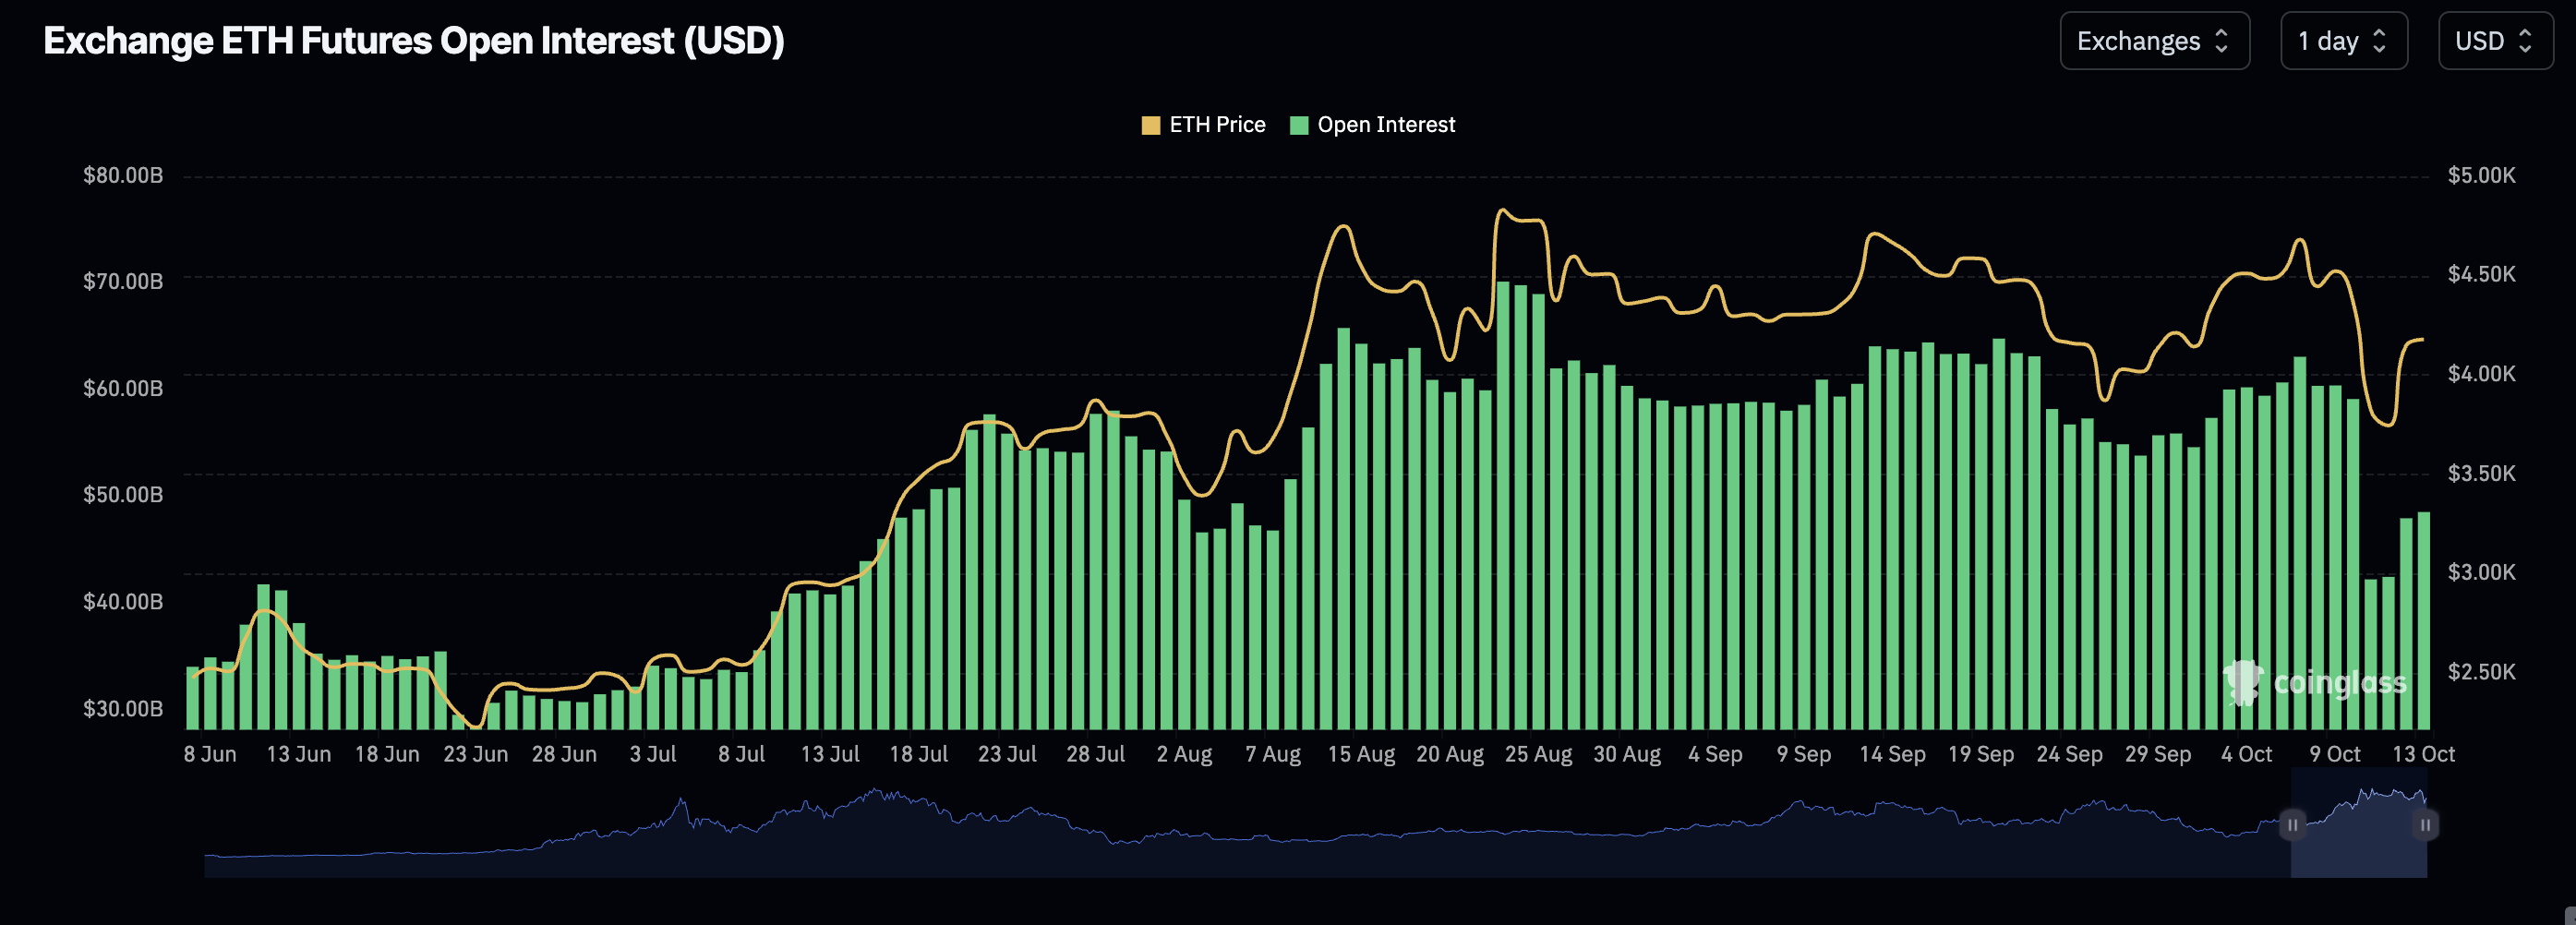
Ethereum Futures Open Interest | Source: CoinGlass
As for XRP, bulls are closing in on the 200-day EMA resistance at $2.63 after the drastic fall to $1.25 on Friday. The RSI on the daily chart supports the bullish outlook, as it lifts above 40 after exiting oversold conditions amid fading bearish momentum.
Key milestones for XRP include a daily close above the 200-day EMA and reclaiming its position above the 100-day EMA at $2.82 and the 50-day EMA at $2.85.
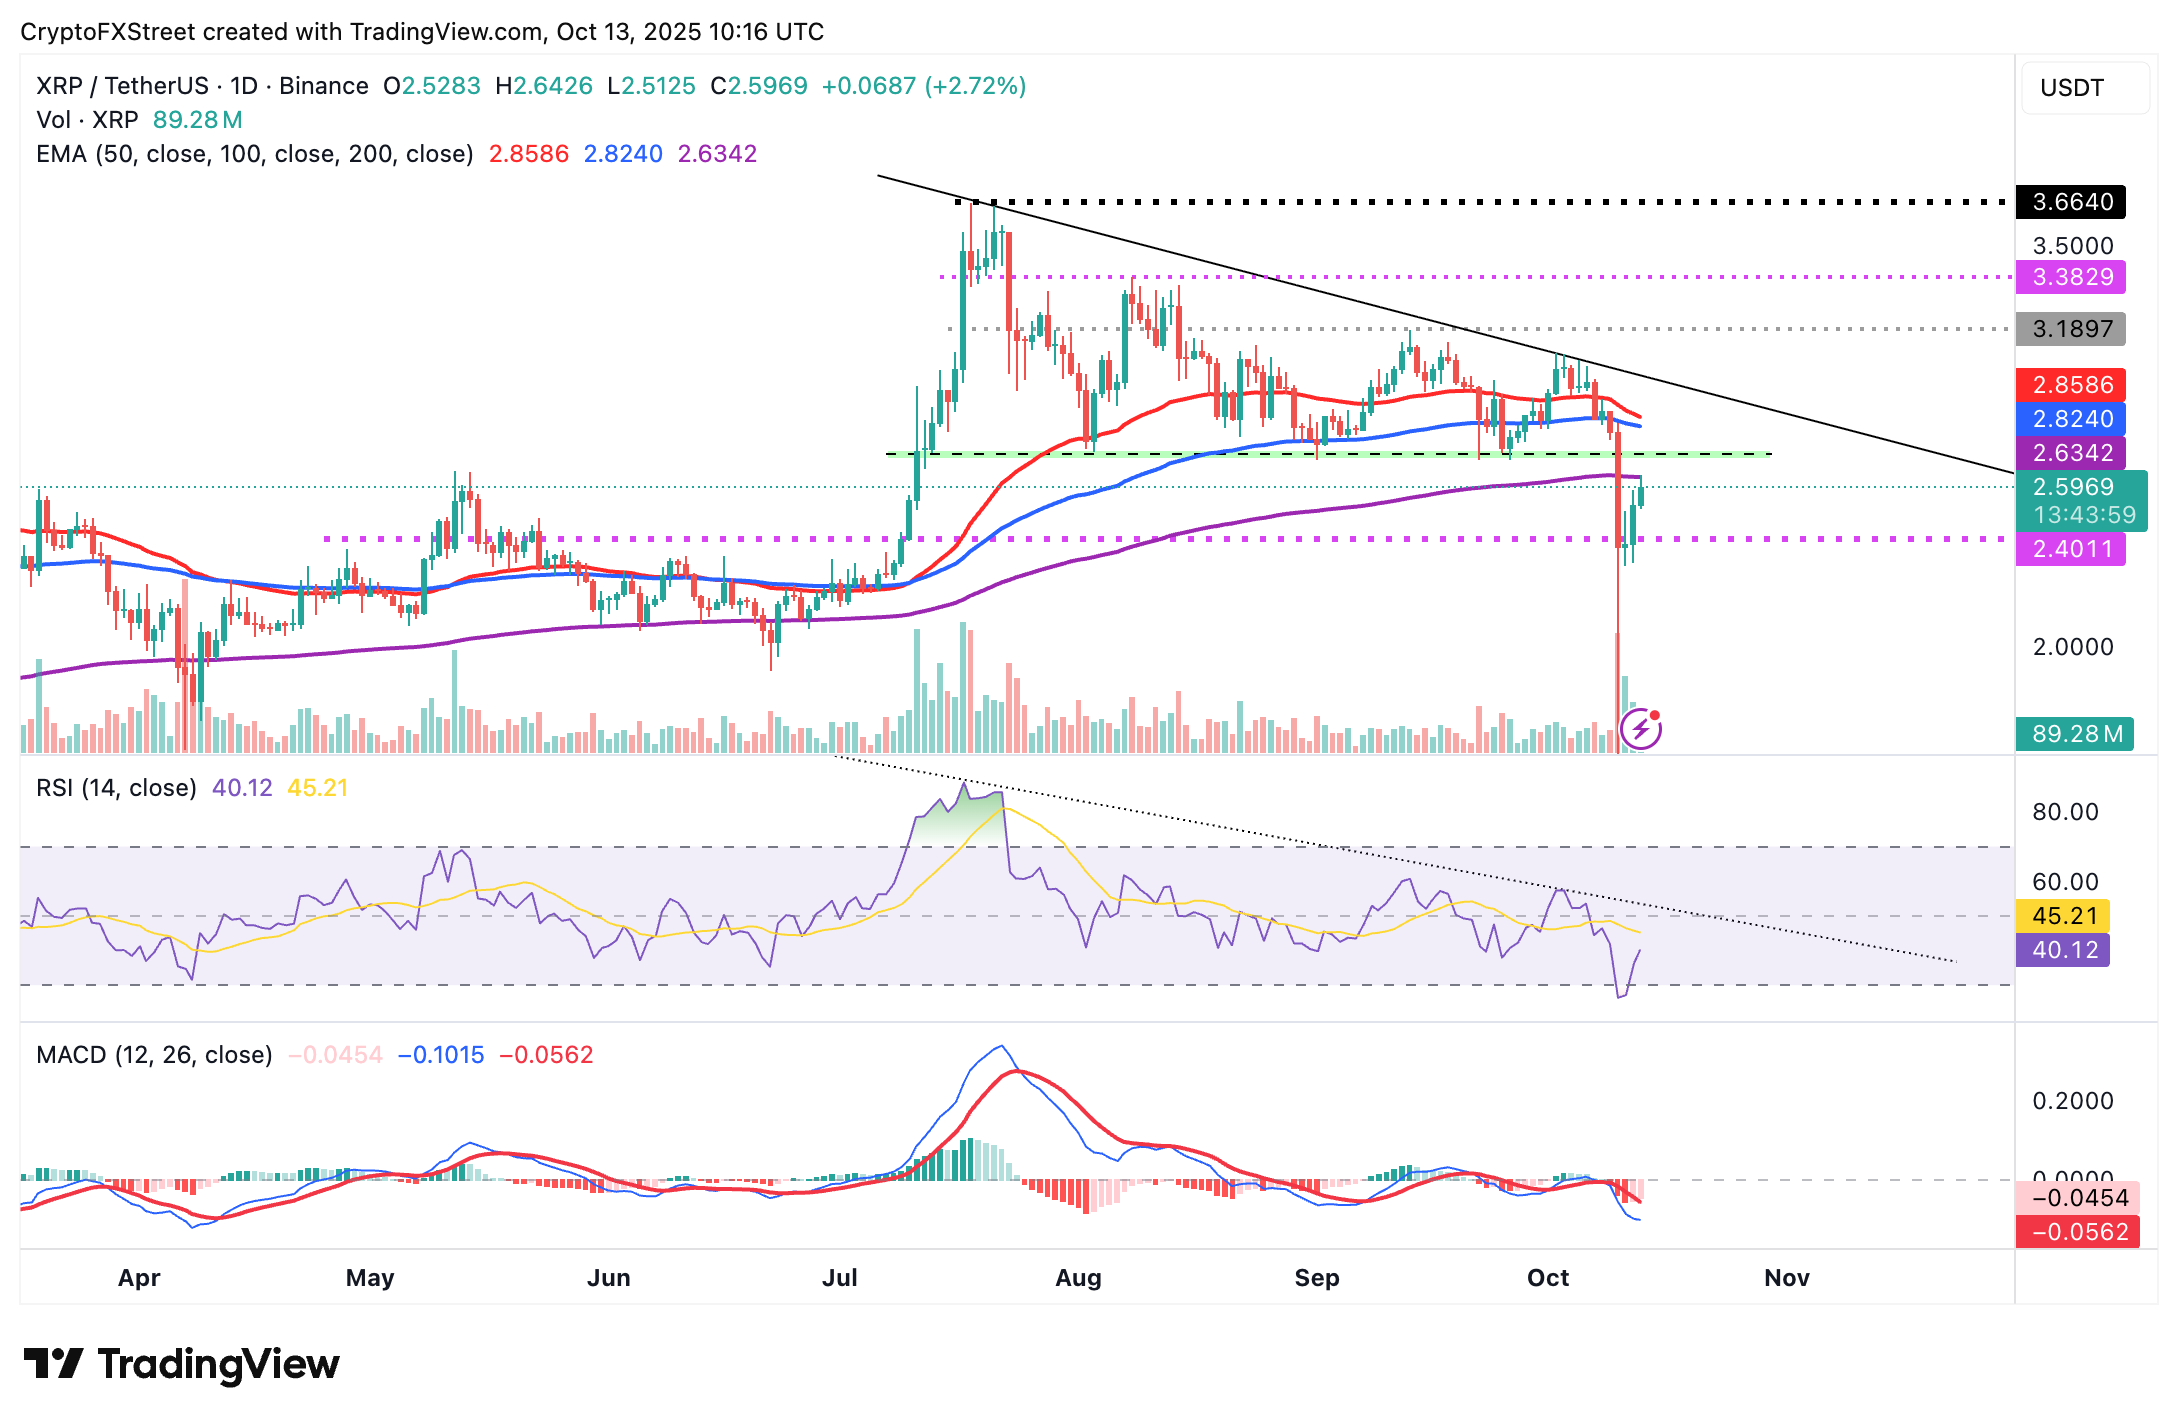
XRP/USDT daily chart
Still, traders must be cautiously optimistic, considering the MACD indicator upholds a sell signal, triggered on Thursday. If the blue line remains below the red signal line, investors may be inclined to reduce exposure, contributing to selling pressure.
Open Interest, funding rate FAQs
Higher Open Interest is associated with higher liquidity and new capital inflow to the market. This is considered the equivalent of increase in efficiency and the ongoing trend continues. When Open Interest decreases, it is considered a sign of liquidation in the market, investors are leaving and the overall demand for an asset is on a decline, fueling a bearish sentiment among investors.
Funding fees bridge the difference between spot prices and prices of futures contracts of an asset by increasing liquidation risks faced by traders. A consistently high and positive funding rate implies there is a bullish sentiment among market participants and there is an expectation of a price hike. A consistently negative funding rate for an asset implies a bearish sentiment, indicating that traders expect the cryptocurrency’s price to fall and a bearish trend reversal is likely to occur.
추천 기사


