

Pi Network Price Forecast: PI extends recovery amid increasing bearish pressure
- Pi Network bounces off a psychological level for its third consecutive day of recovery.
- Outflows from the Pi Network Foundation wallet and Liquidity reserve risk additional supply pressure.
- Technical outlook flashes downside risk as bearish momentum persists.
Pi Network (PI) edges higher by 4% at press time on Monday, extending its recovery for the third consecutive day after bouncing off the $0.2000 psychological level. Despite the short-term recovery, PI remains at risk of extended correction as outflows from the Pi Network Foundation wallet and liquidity reserve threaten further supply pressure.
Pi Network’s supply problem
Out of Pi Network’s 8.27 million circulating supply, the majority is off exchanges, according to PiScan data, which shows the total reserve of Centralized Exchanges (CEXs) at 417.20 million PI. This suggests that the majority of the selling pressure comes from off-exchange transactions.
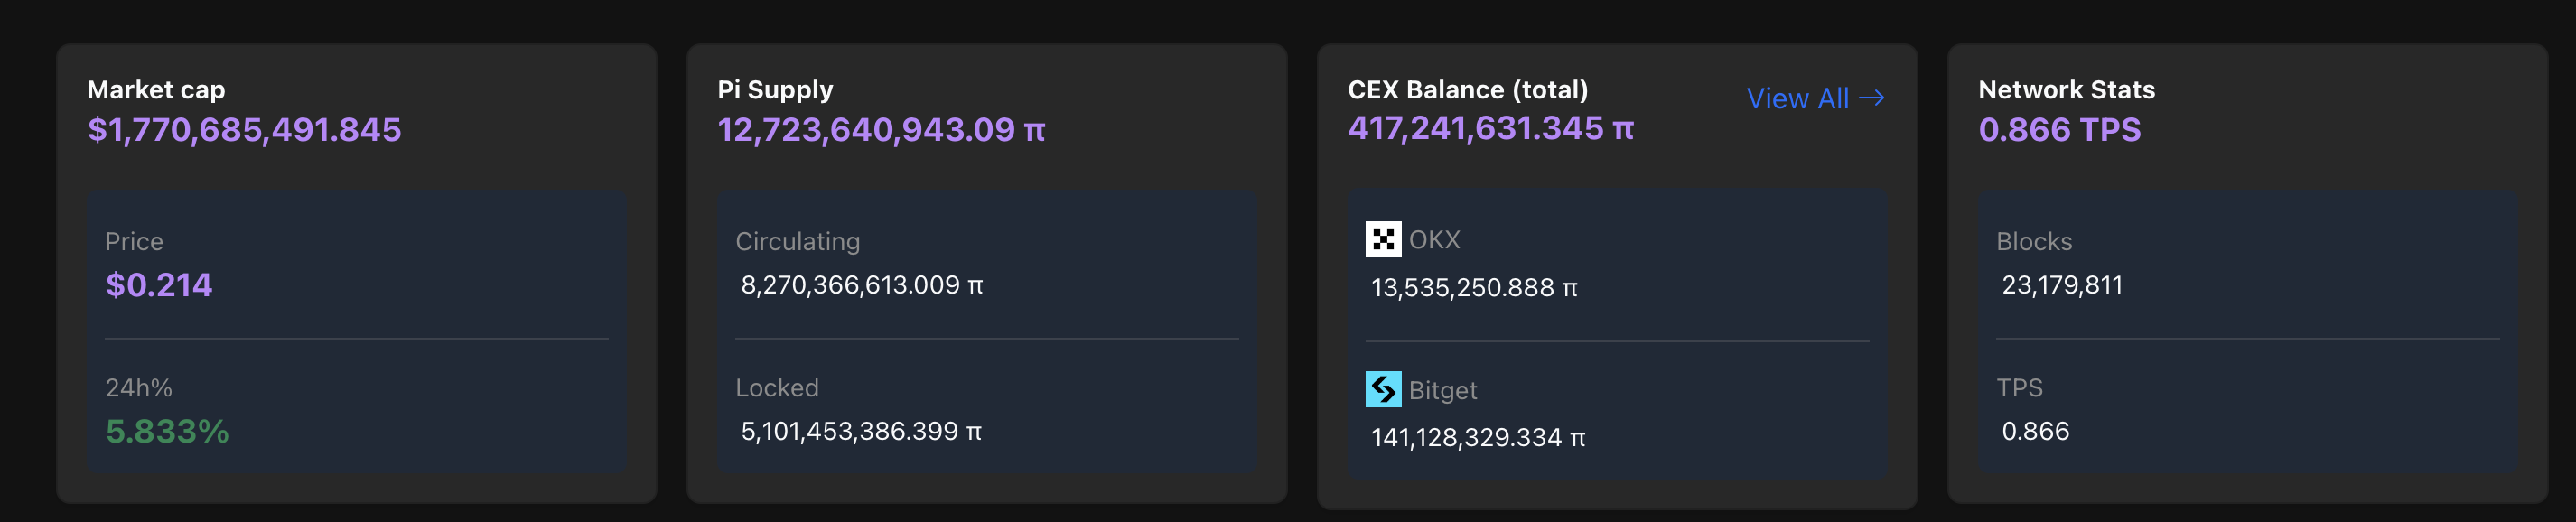
Pi Network metrics. Source: PiScan
The outflow of 50 million PI tokens from Pi Network Foundation wallet #11 on Sunday resulted in strategic distribution within the community via Foundation Wallet #2. At the same time, the 50 million PI outflow from the liquidity reserve remains stagnant in a different wallet at press time. This increased outflow activity from Pi core team wallets risks adding to the available supply.
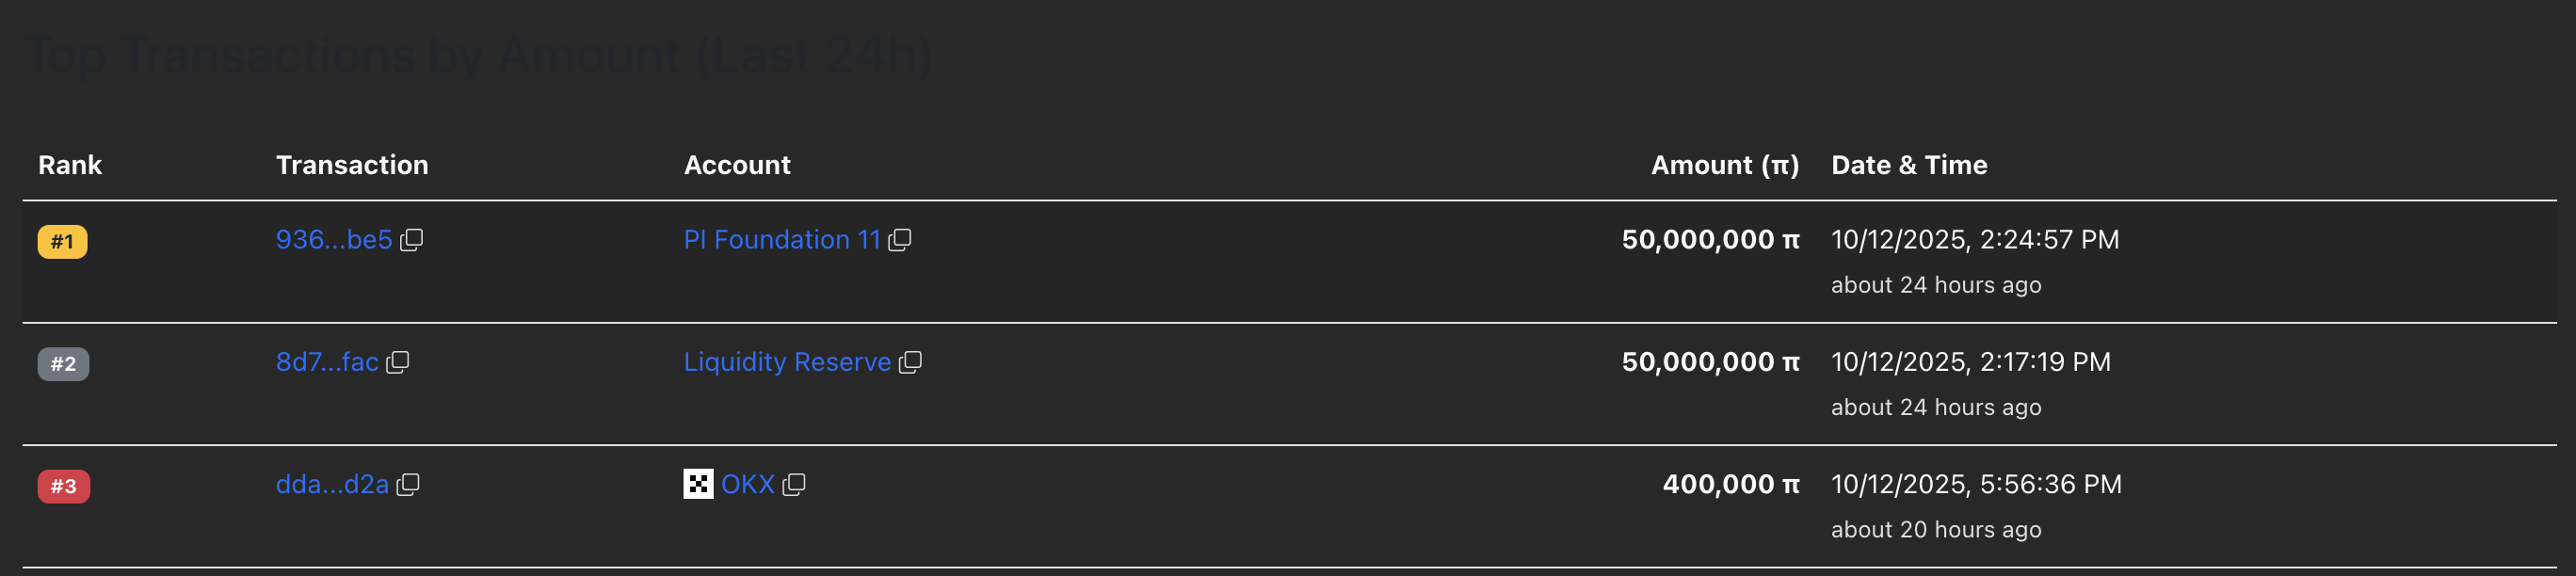
Pi Network transactions data. Source: PiScan
Technical Outlook: Will Pi Network extend the recovery?
Pi Network price dropped 13% on Friday, resulting in a fresh low of $0.1533 before retracing higher to close at $0.1996 on the day. At the time of writing, PI trades above $0.2150, hinting at a potential V-shaped reversal.
If the bounce back from the $0.2000 psychological level extends, PI could face a hurdle at $0.2755, marked by the centre Pivot Point level.
The Relative Strength Index (RSI) reads 28 on the daily chart, reversing within the oversold zone while the selling pressure remains heightened. The Moving Average Convergence Divergence (MACD) on the same chart inches closer to its signal line while maintaining a declining trend, hinting at a potential crossover. If MACD crosses above the signal line, it would flash a positive shift in trend momentum that could signal extended recovery.
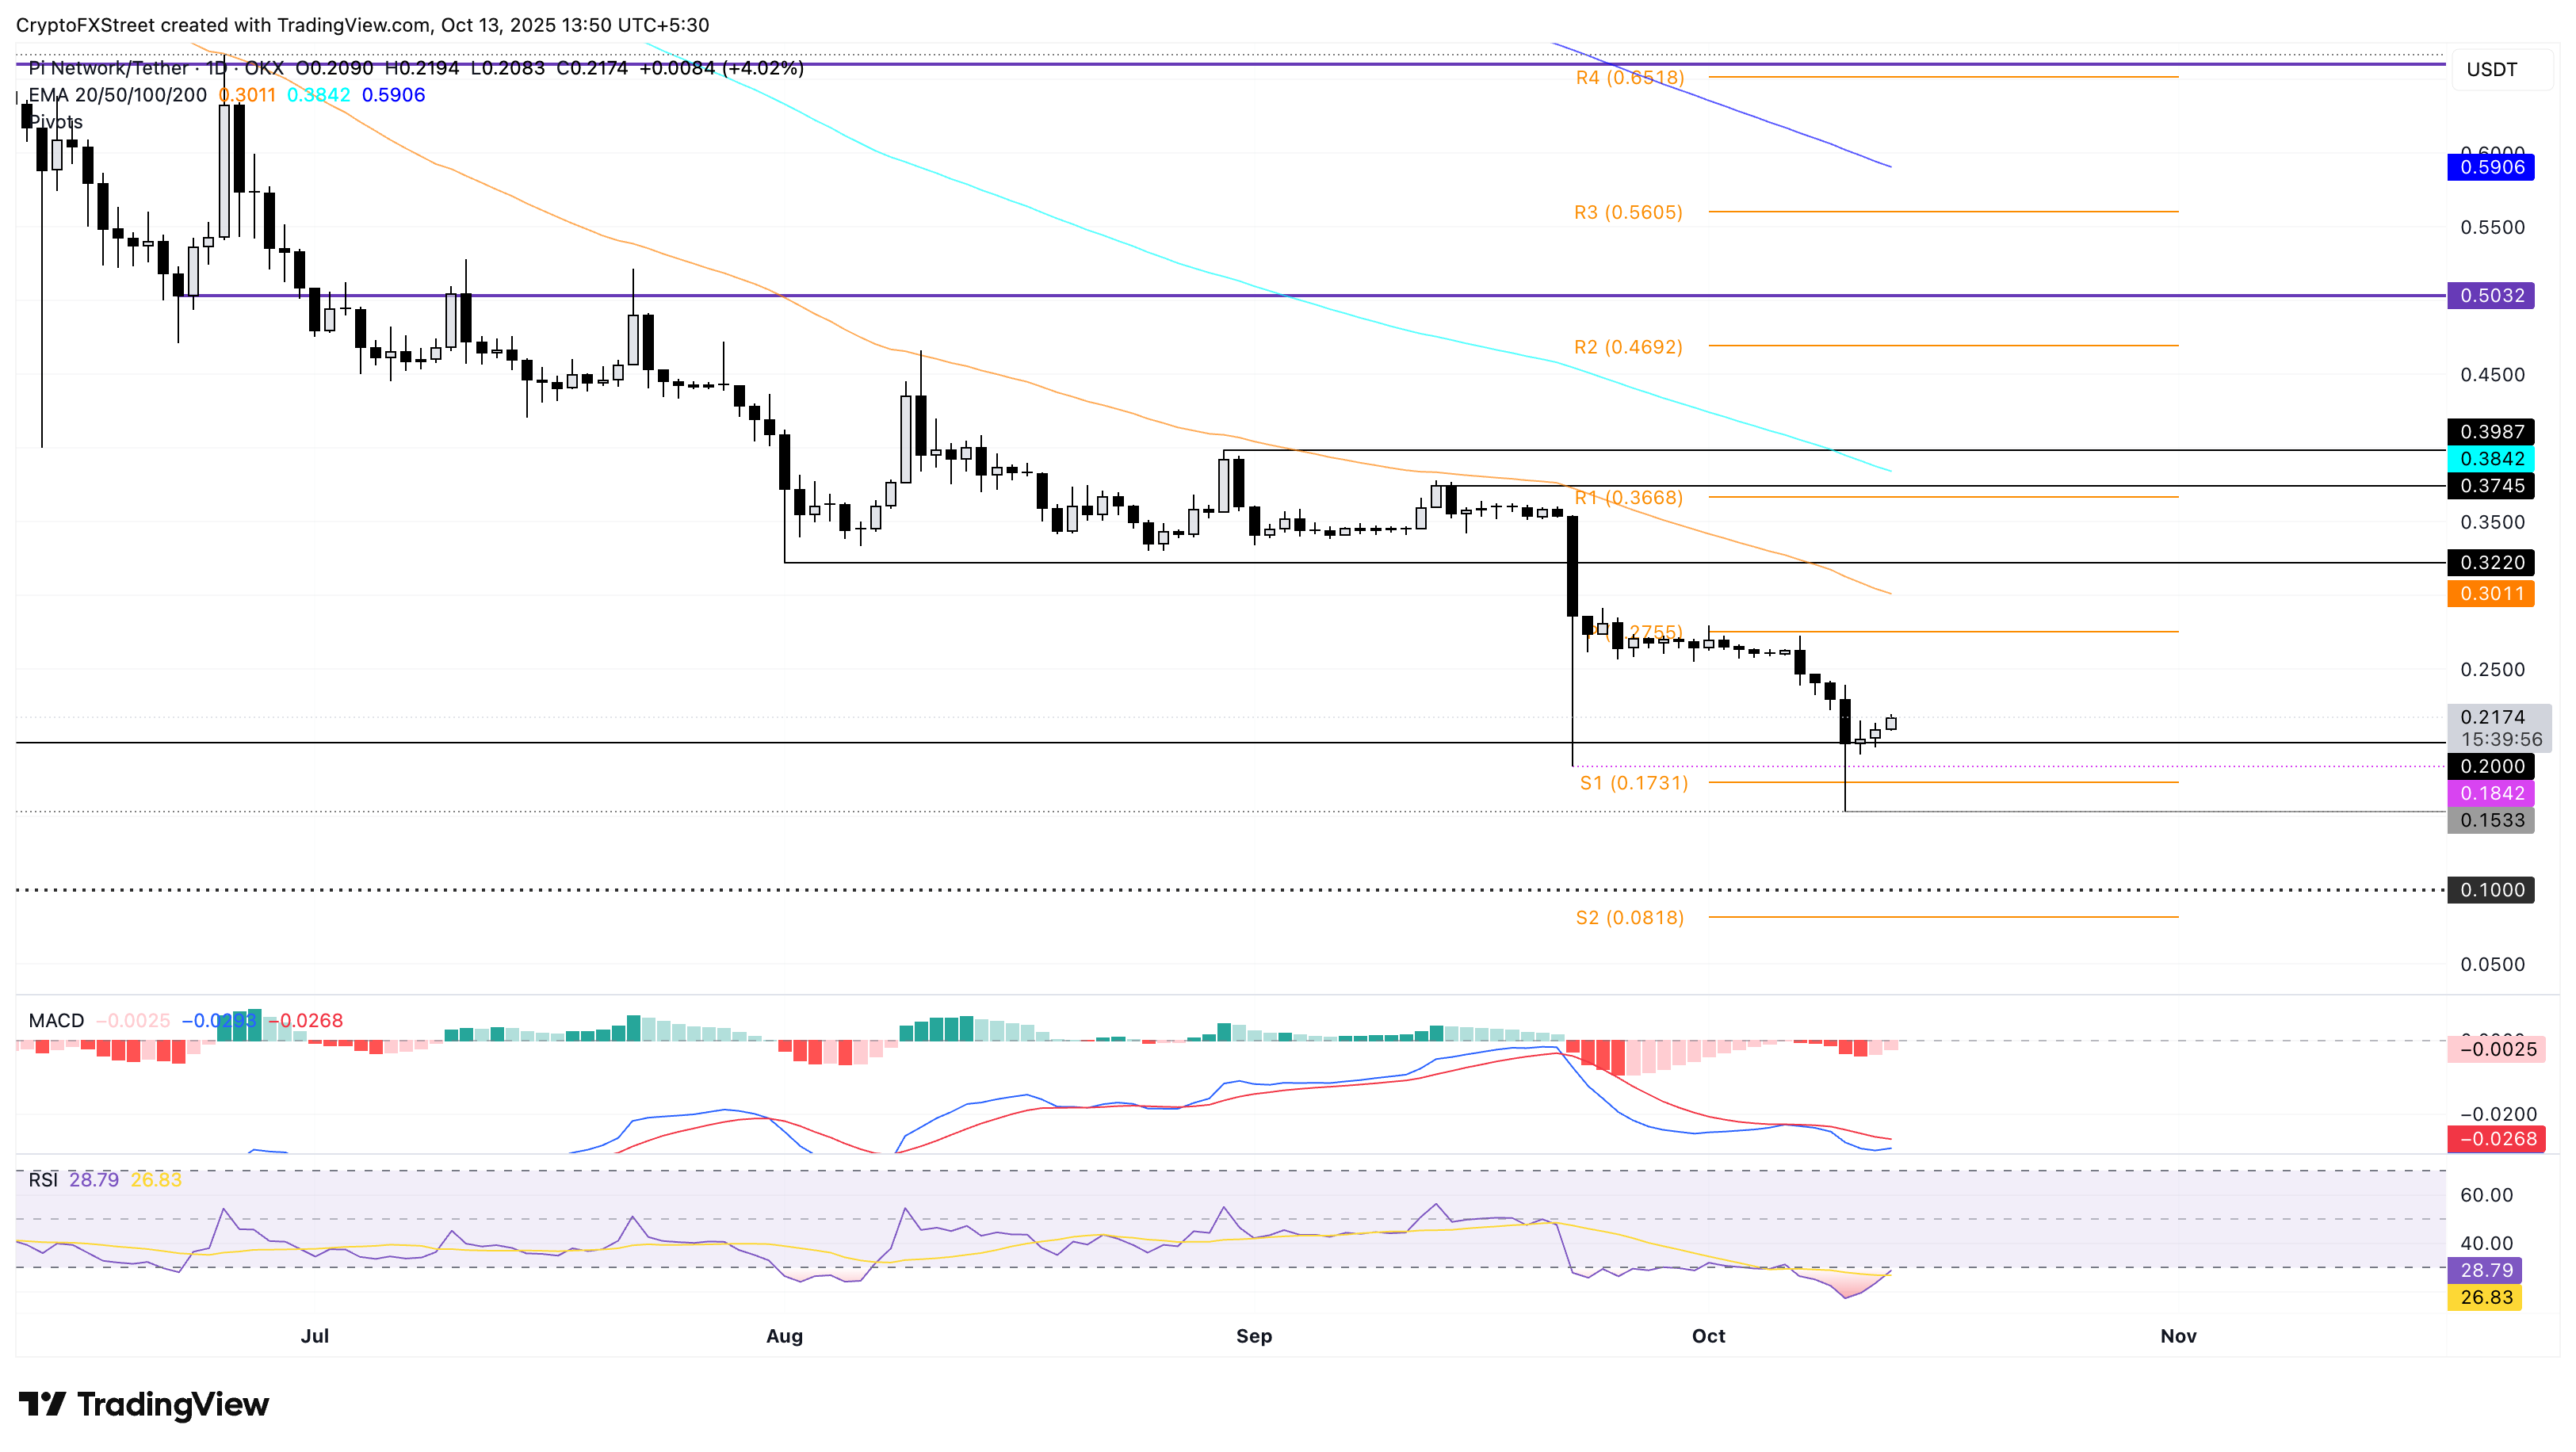
PI/USDT daily price chart.
Looking down, crucial support levels for Pi Network remain at the $0.2000 psychological level and the S1 Pivot Point level at $0.1731.
Bitcoin, altcoins, stablecoins FAQs
Bitcoin is the largest cryptocurrency by market capitalization, a virtual currency designed to serve as money. This form of payment cannot be controlled by any one person, group, or entity, which eliminates the need for third-party participation during financial transactions.
Altcoins are any cryptocurrency apart from Bitcoin, but some also regard Ethereum as a non-altcoin because it is from these two cryptocurrencies that forking happens. If this is true, then Litecoin is the first altcoin, forked from the Bitcoin protocol and, therefore, an “improved” version of it.
Stablecoins are cryptocurrencies designed to have a stable price, with their value backed by a reserve of the asset it represents. To achieve this, the value of any one stablecoin is pegged to a commodity or financial instrument, such as the US Dollar (USD), with its supply regulated by an algorithm or demand. The main goal of stablecoins is to provide an on/off-ramp for investors willing to trade and invest in cryptocurrencies. Stablecoins also allow investors to store value since cryptocurrencies, in general, are subject to volatility.
Bitcoin dominance is the ratio of Bitcoin's market capitalization to the total market capitalization of all cryptocurrencies combined. It provides a clear picture of Bitcoin’s interest among investors. A high BTC dominance typically happens before and during a bull run, in which investors resort to investing in relatively stable and high market capitalization cryptocurrency like Bitcoin. A drop in BTC dominance usually means that investors are moving their capital and/or profits to altcoins in a quest for higher returns, which usually triggers an explosion of altcoin rallies.
추천 기사


