

Crypto Today: Bitcoin, Ethereum, XRP extend consolidation as sentiment, institutional demand cools
- Bitcoin price breaks above a short-term descending channel, but sideways trading persists.
- Ethereum traders near the range low as US ETFs extend outflows for two consecutive days.
- XRP attempts recovery, but slows under the 50-period EMA on the 4-hour chart.
Bitcoin (BTC) struggles to hold $111,000 on Wednesday, following a breakout above a short-term descending channel. Despite several attempts to push higher, cooling market sentiment and low institutional demand continue to suppress price movement.
Altcoins, including Ethereum (ETH) and Ripple (XRP), are trading in choppy conditions, with limited upward movement while holding key support levels. Ethereum remains above $4,300 at the time of writing, reflecting a decline in retail interest and institutional demand.
Data spotlight: Bitcoin regains institutional interest, as Ethereum ETF outflows extend
Interest in Bitcoin Exchange Traded Funds (ETFs) is increasing, with inflows of $333 million recorded on Tuesday. Since August 25, BTC spot ETFs have seen only one day of outflows, totaling $127 million on August 29.
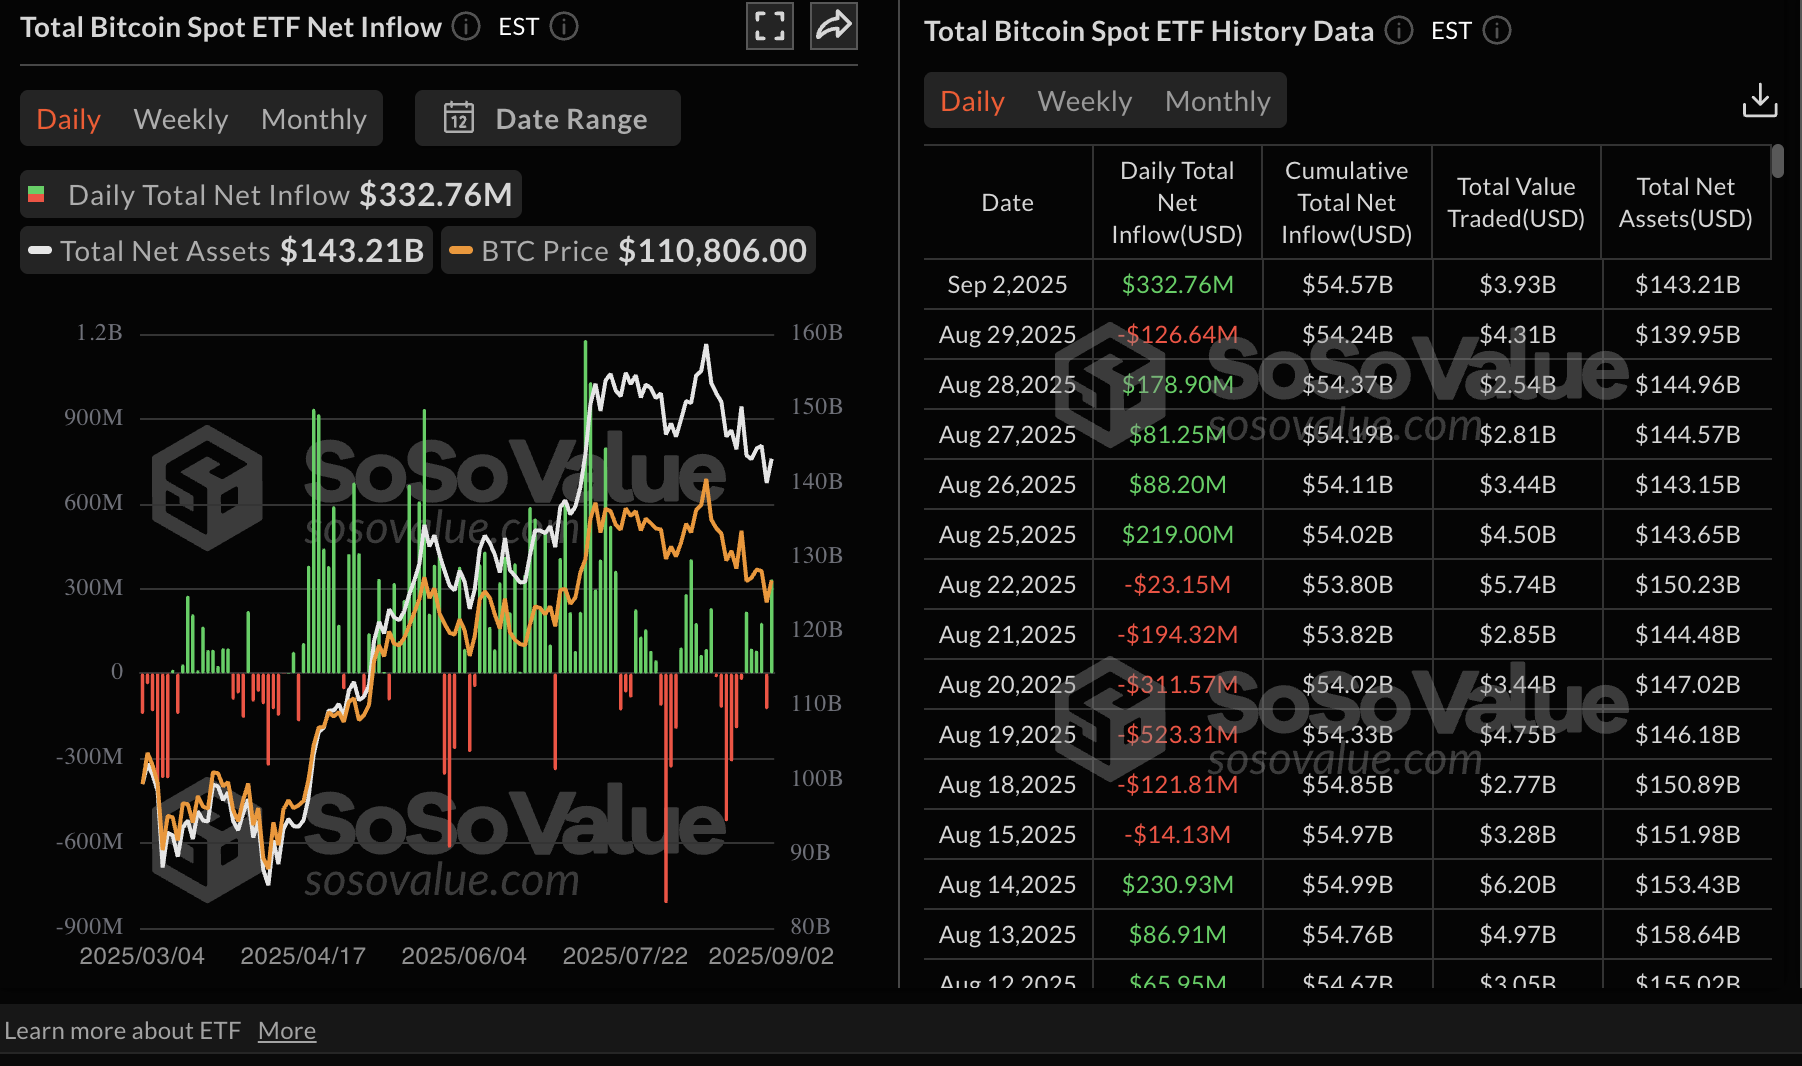
Bitcoin spot ETFs data | Source: SoSoValue
On the other hand, Ethereum ETFs have resumed outflows after six days of consecutive inflows. According to SoSoValue data, US ETH spot ETFs experienced outflows of $135 million on Tuesday, extending the bearish trend that began on Friday.
If outflows persist in the coming days, it could indicate a shift in market dynamics, with institutional interest moving to other asset classes, including altcoins such as Solana (SOL).
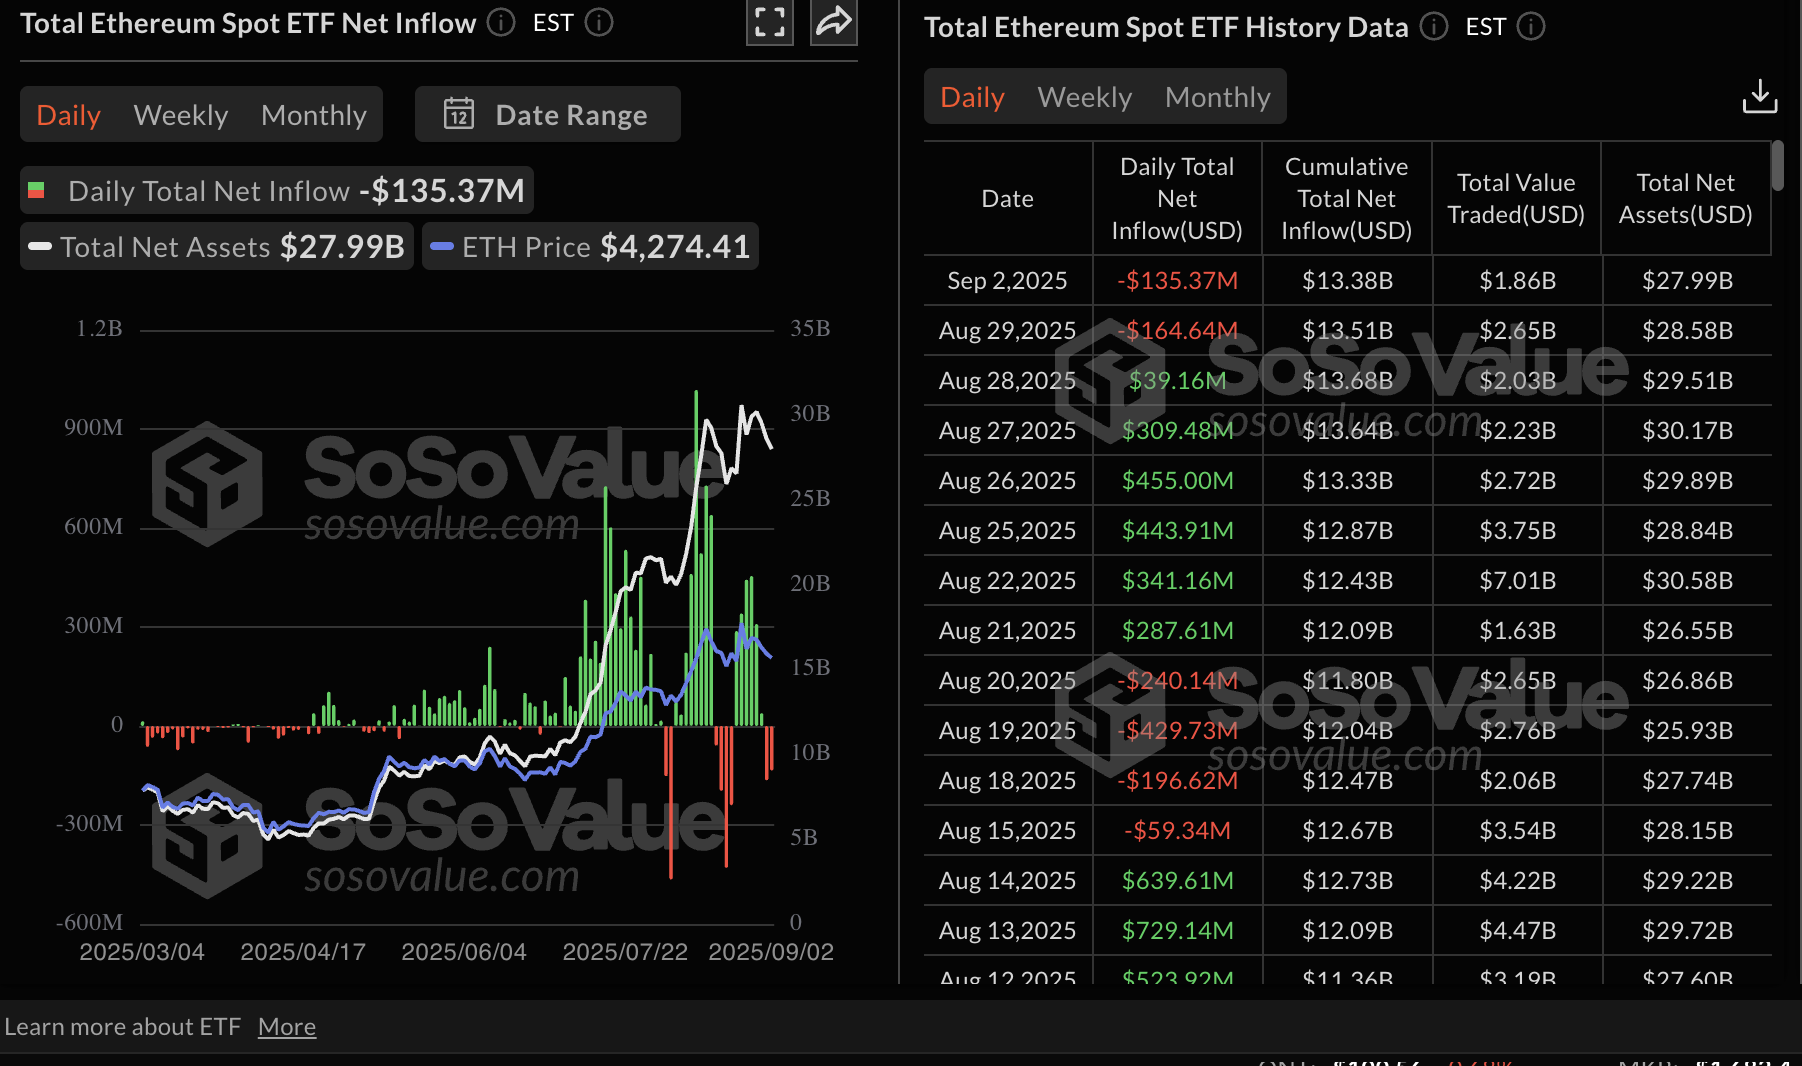
Ethereum spot ETFs data | Source: SoSoValue
As for XRP, retail demand remains relatively subdued, with the futures Open Interest (OI) averaging $7.75 billion, down from $10.94 billion on July 22. The chart below indicates that OI is stabilizing and could reclaim the $8 billion mark in the short term.
A steady growth in the OI, representing the notional value of outstanding futures contracts, suggests that traders have a strong conviction in the short-term rise of XRP prices and are willing to bet on long positions.
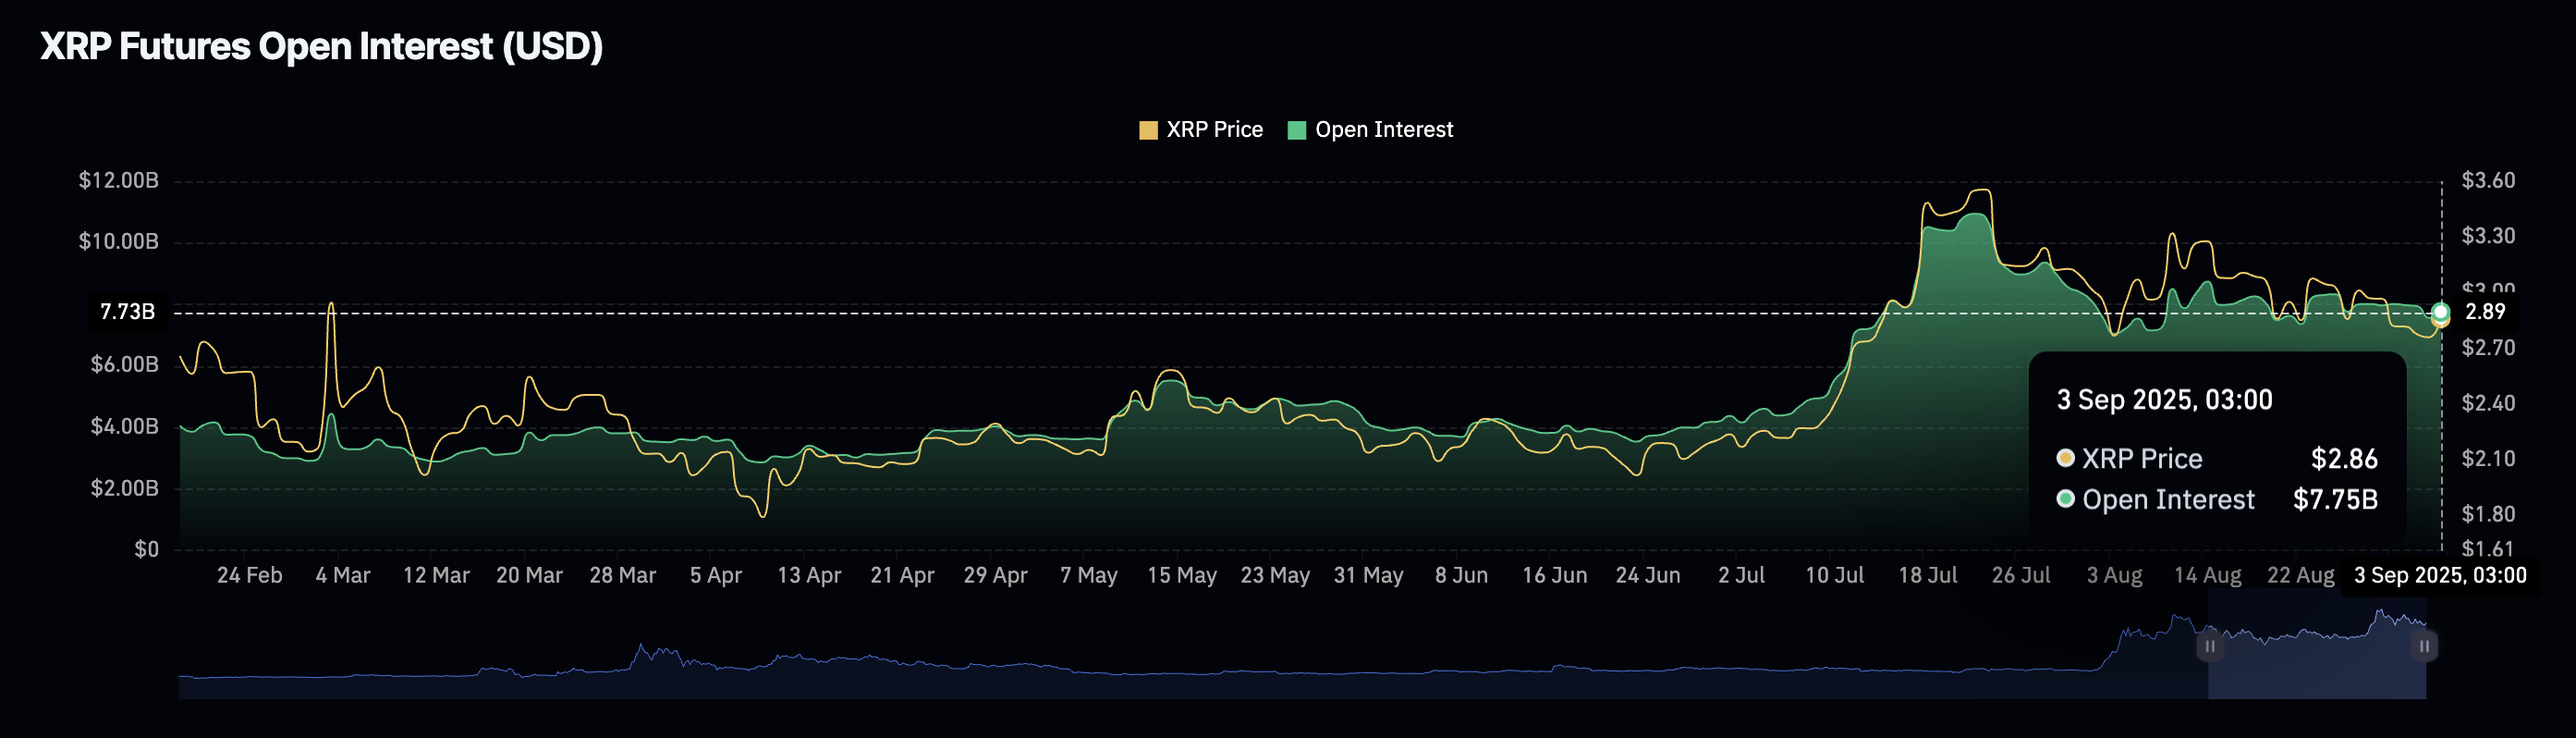
XRP Futures Open Interest | Source: CoinGlass
Chart of the day: Bitcoin flaunts short-term bullish structure
Bitcoin price hovers above $111,000 after breaking the descending channel on the 4-hour chart. The 50-period Exponential Moving Average (EMA) at $110,537 provides immediate support, as declines below the $110,000 round-number support could accelerate toward the next demand zone at $107,271, which was tested on Monday and in early July.
Backing the uptrend is a buy signal from the Moving Average Convergence Divergence (MACD) indicator sustained since Monday. Traders will consider seeking exposure as the MACD line in blue holds above the red signal line.
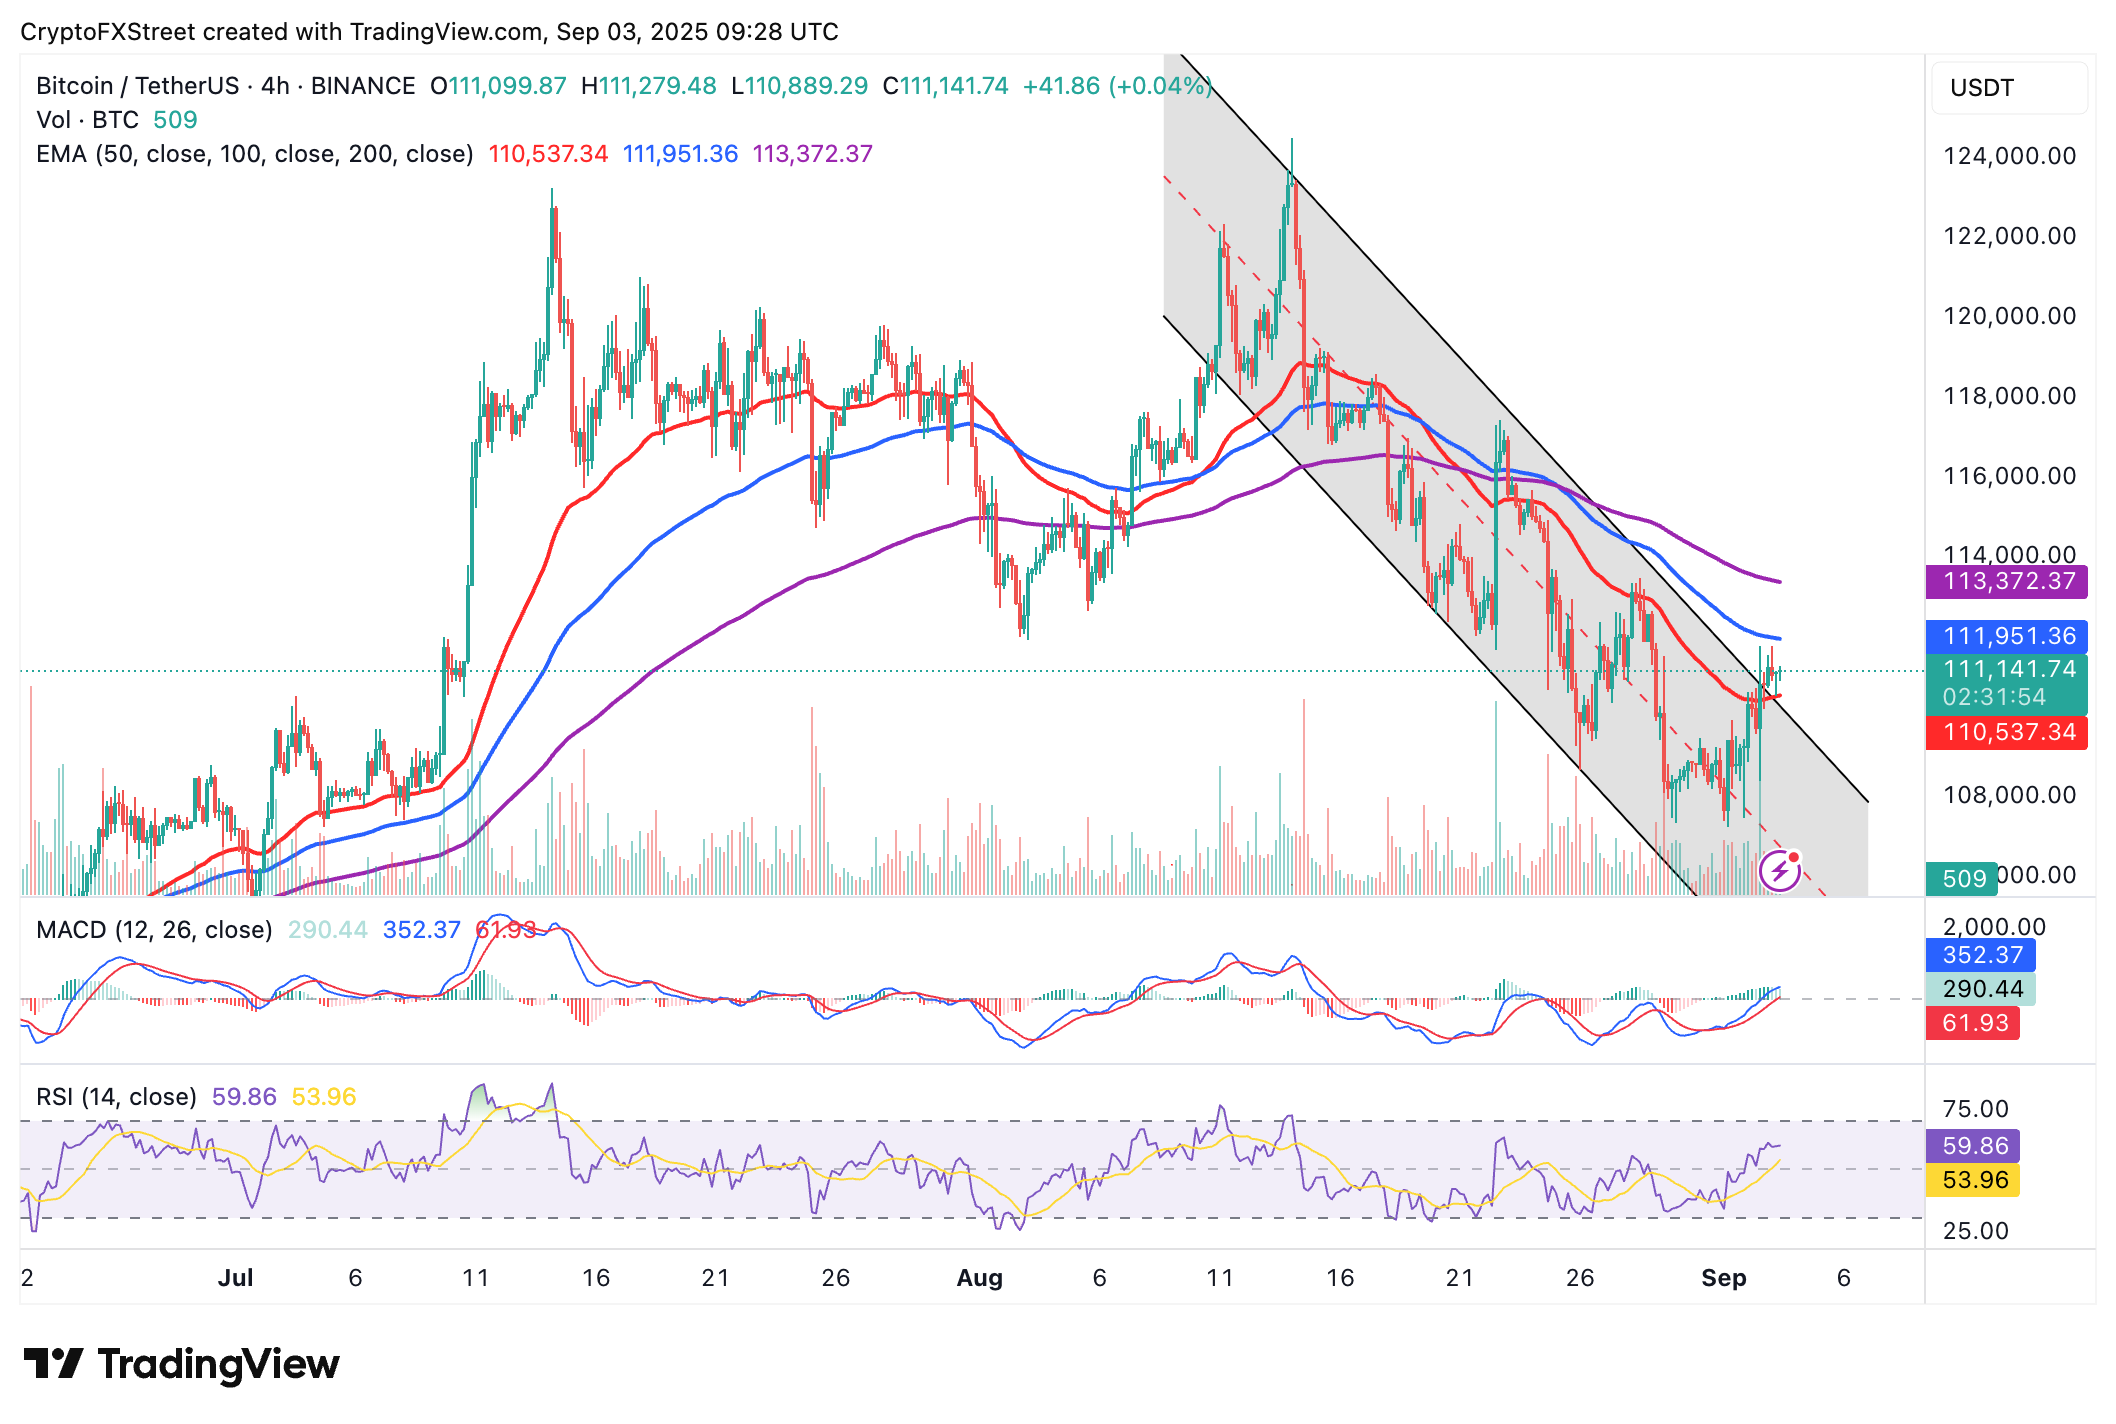
BTC/USDT 4-hour chart
The Relative Strength Index (RSI) at 60 and rising toward the overbought region backs the increase in buying pressure. Key areas of interest to traders are the 100-period EMA at $111,951, which, if broken, could boost Bitcoin’s bullish case, and the 200-period EMA resistance at $113,372.
Altcoins update: Ethereum, XRP eye short-term breakout
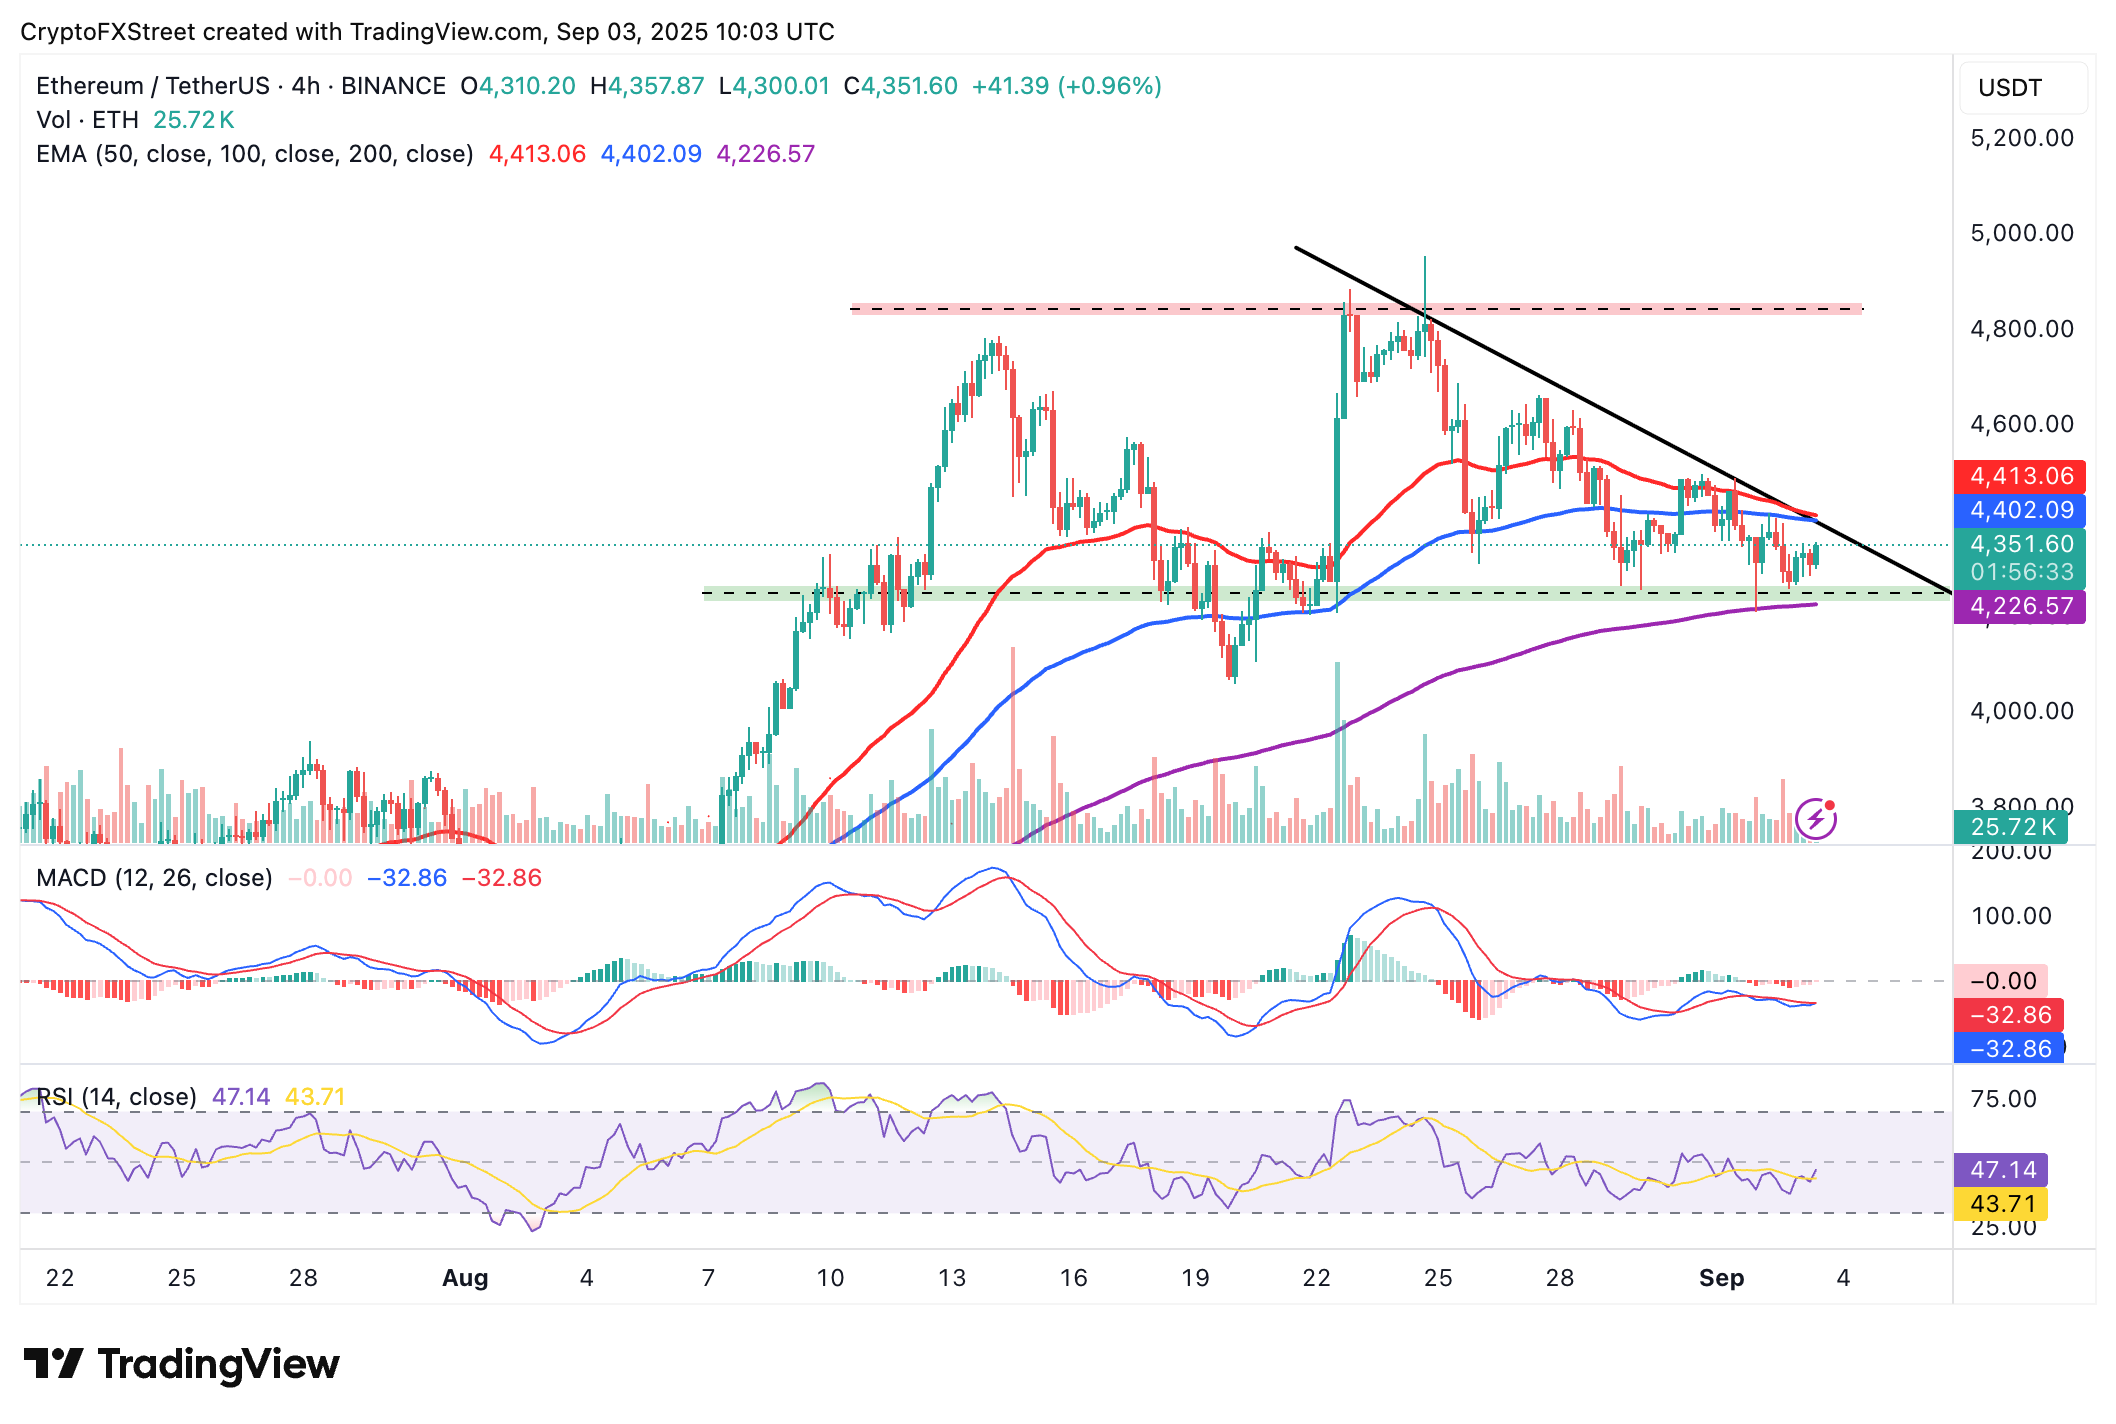
Ethereum price holds above $4,300, underpinned by a strengthening technical structure. A breakout above the next key resistance level at $4,402, as indicated by the 100-period EMA on the 4-hour chart, would affirm the bullish grip.
Traders should also look out for a potential buy signal from the MACD indicator. This signal would manifest as the blue line crosses above the red signal line, encouraging investors to buy ETH as bullish sentiment returns in the market.
In the medium term, bulls target a break toward Ethereum’s record high of $4,956, reached on August 24 – a move that is likely to increase the chance of ETH extending its price discovery phase.
ETH/USDT 4-hour chart
As for XRP, bulls are attempting a breakout above $2.80, short-term support backed by a MACD buy signal on the 4-hour chart below. If bullish sentiment stabilizes in the upcoming sessions as the RSI at 53 rises, the path of least resistance will remain upward, increasing the chances of breaching the critical $3.00 hurdle.
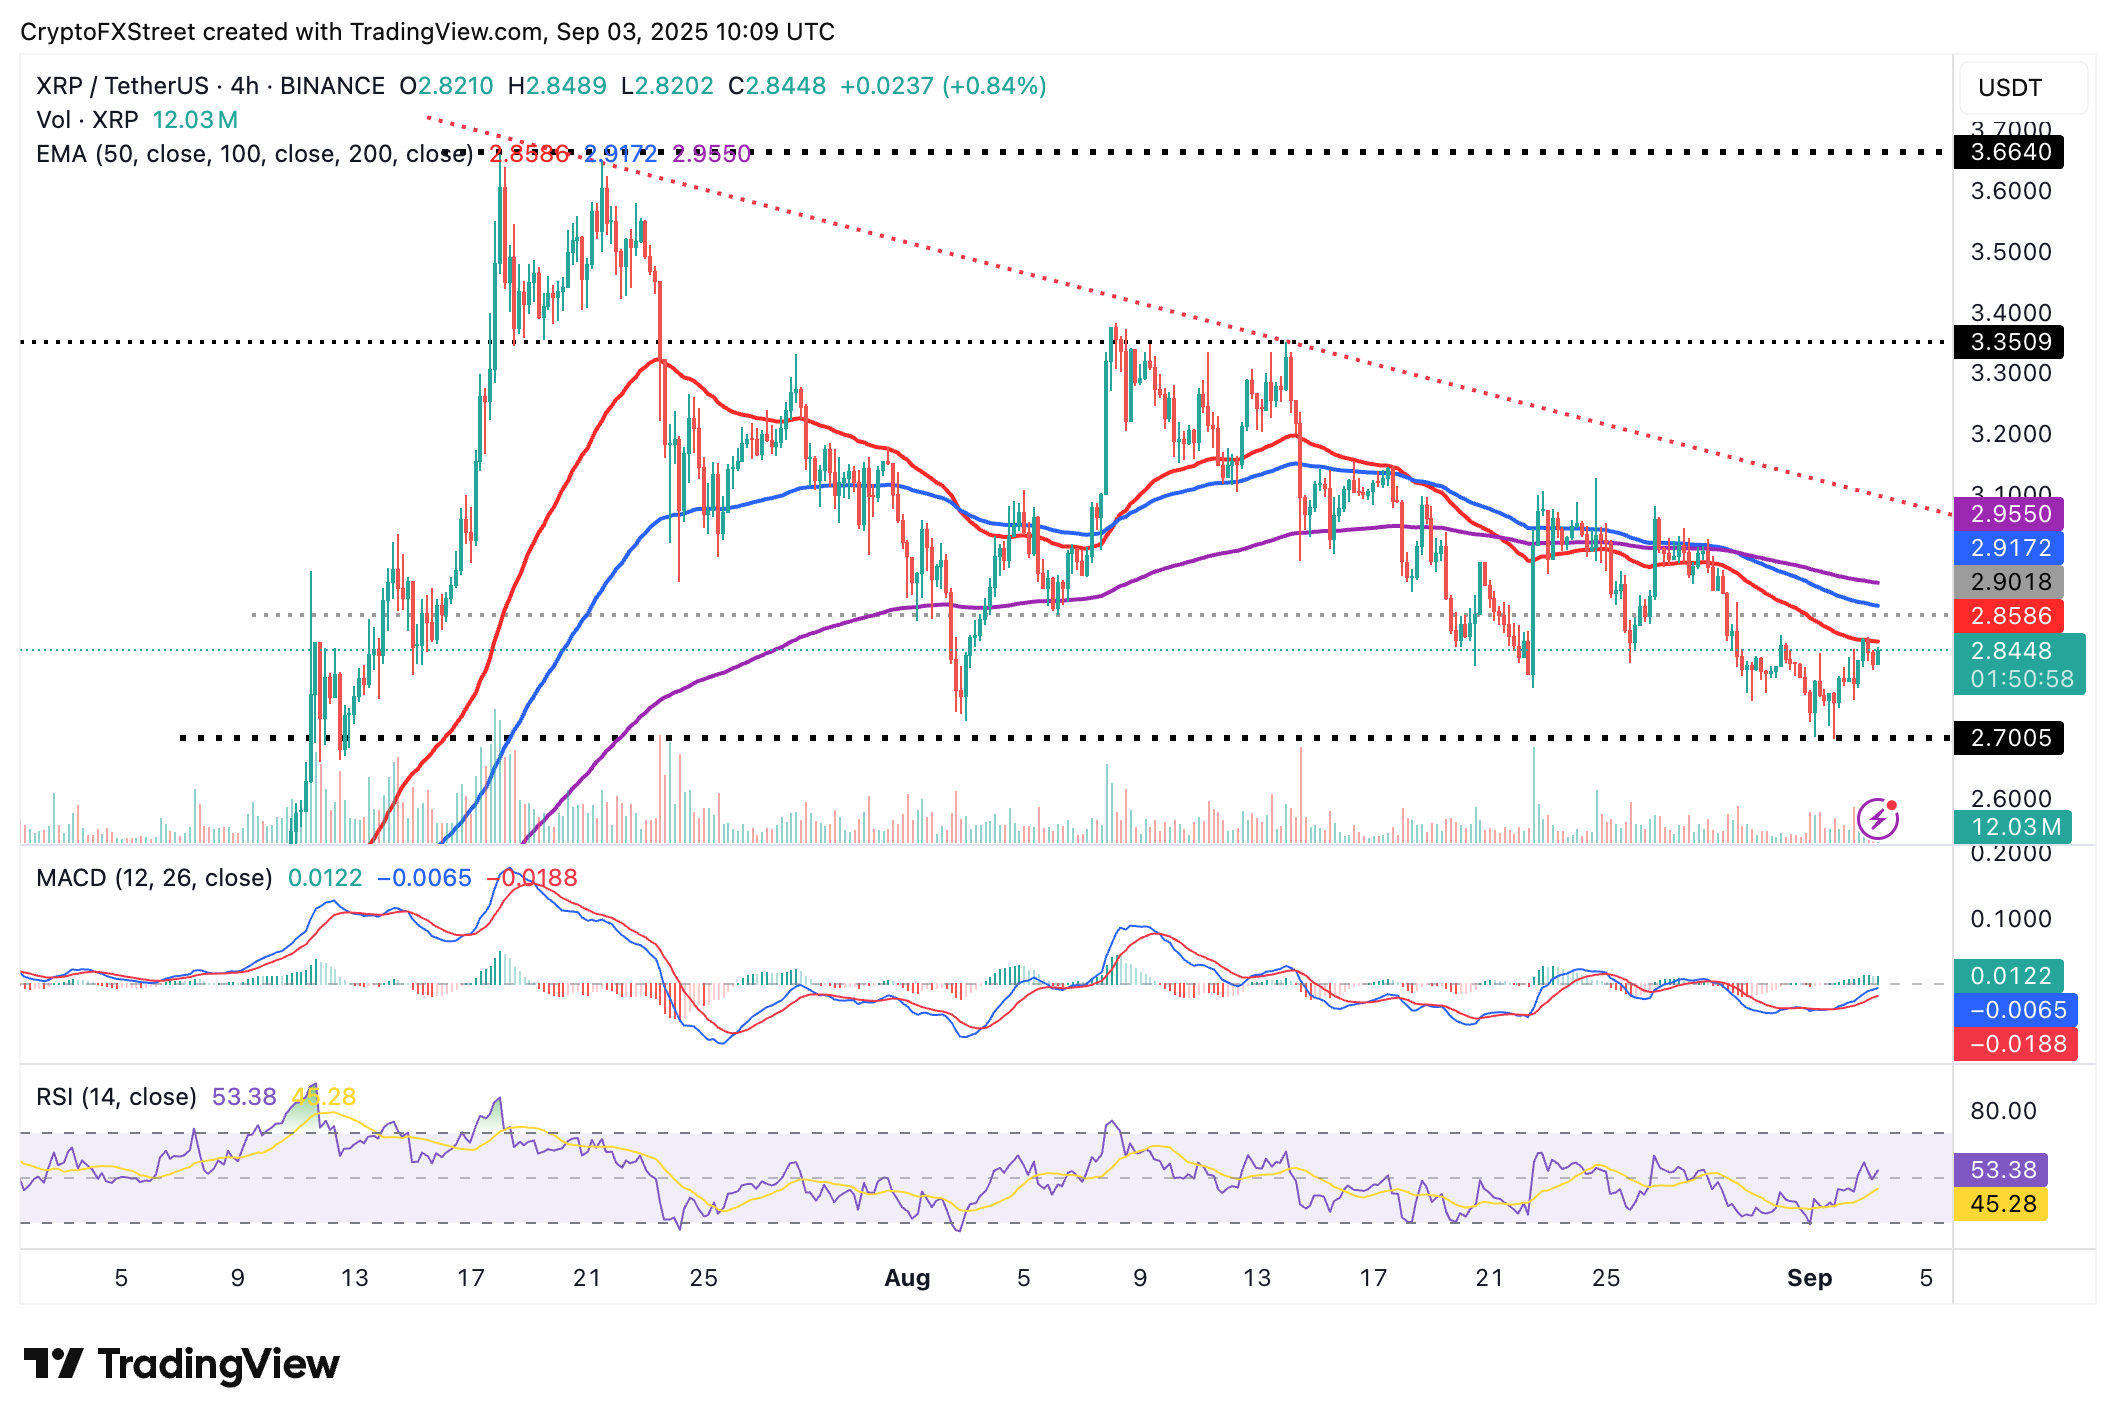
XRP/USDT 4-hour chart
Still, traders must be cautious with the 50-period EMA highlighting resistance at $2.85, the 100-period EMA at $2.91 and the 200-period EMA at $2.95. The dotted descending trendline resistance is worth watching, as movement above it could affirm the bullish grip.
Bitcoin, altcoins, stablecoins FAQs
Bitcoin is the largest cryptocurrency by market capitalization, a virtual currency designed to serve as money. This form of payment cannot be controlled by any one person, group, or entity, which eliminates the need for third-party participation during financial transactions.
Altcoins are any cryptocurrency apart from Bitcoin, but some also regard Ethereum as a non-altcoin because it is from these two cryptocurrencies that forking happens. If this is true, then Litecoin is the first altcoin, forked from the Bitcoin protocol and, therefore, an “improved” version of it.
Stablecoins are cryptocurrencies designed to have a stable price, with their value backed by a reserve of the asset it represents. To achieve this, the value of any one stablecoin is pegged to a commodity or financial instrument, such as the US Dollar (USD), with its supply regulated by an algorithm or demand. The main goal of stablecoins is to provide an on/off-ramp for investors willing to trade and invest in cryptocurrencies. Stablecoins also allow investors to store value since cryptocurrencies, in general, are subject to volatility.
Bitcoin dominance is the ratio of Bitcoin's market capitalization to the total market capitalization of all cryptocurrencies combined. It provides a clear picture of Bitcoin’s interest among investors. A high BTC dominance typically happens before and during a bull run, in which investors resort to investing in relatively stable and high market capitalization cryptocurrency like Bitcoin. A drop in BTC dominance usually means that investors are moving their capital and/or profits to altcoins in a quest for higher returns, which usually triggers an explosion of altcoin rallies.
추천 기사


