
Crypto Today: Bitcoin, Ethereum, XRP amid healthy stablecoin liquidity, moderate capital inflows
- Bitcoin recovers above $110,000, but moderate capital inflows could extend consolidation.
- Ethereum's declining Open Interest suggests cooling retail demand amid persistent macroeconomic headwinds.
- XRP holds the 100-day EMA as the RSI rebounds, backing growing risk-on sentiment.
Bitcoin (BTC) shows subtle signs of strength following a rebound above $110,000 on Tuesday as traders look out for a macroeconomic lifeline ahead of the United States (US) Federal Reserve's (Fed) September interest rate decision. Ethereum (ETH) and Ripple (XRP) are extending their consolidation as optimism builds for a bullish breakout.
Market overview: Investors eye Fed interest rate cut lifeline
Federal Reserve officials will closely monitor key inflation indicators, including the unemployment rate on Friday, the Producer Price Index (PPI) on September 10, the Consumer Price Index (CPI) and Jobless Claims on September 11, when assessing the US economic standpoint ahead of the September 17 interest rate decision.
According to the CME Fedwatch tool, there is an 89.8% chance that the Federal Reserve will cut interest rates by 25 basis points (bps) to a range of 4% to 4.25%, a potential lifeline for risk asset classes, such as crypto and Equities.
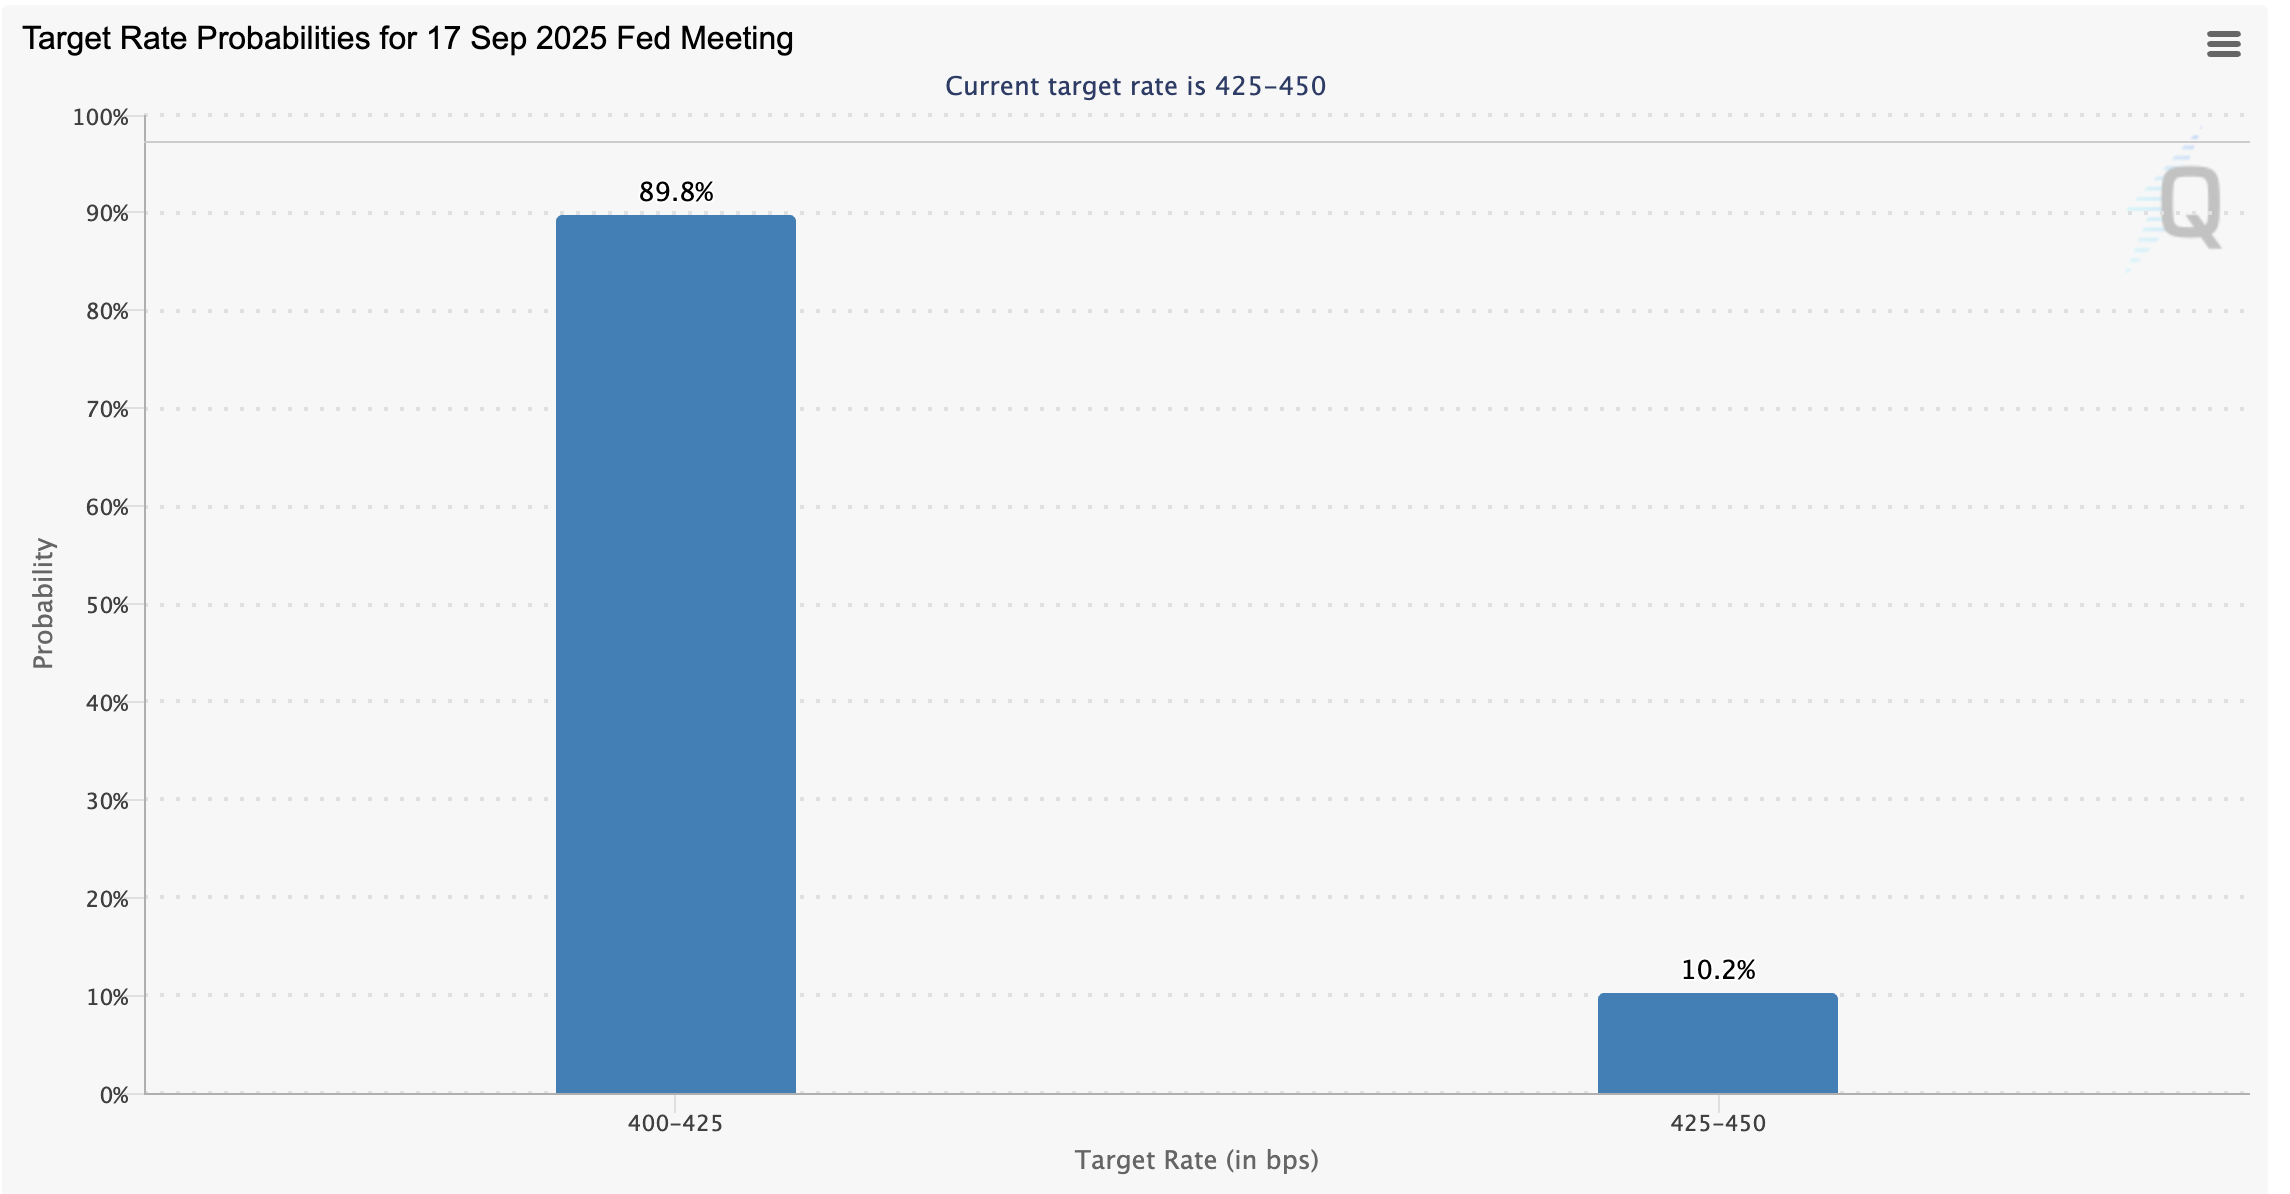
Fedwatch tool | Source: CME Group
Data spotlight: Bitcoin faces moderate capital inflows
Bitcoin faces varied market conditions, ranging from micro to macro, that continue to shape its outlook. For instance, the weekly stablecoin market capitalization has cooled to approximately $1.1 billion, expanding the gap from the $4-$8 billion growth waves that catalyzed its 2024 rally.
"This slowdown signals that, while there is still net capital entering the system, the pace has weakened. From a liquidity standpoint, this creates a less supportive backdrop for sustaining rapid Bitcoin price appreciation," CryptoQuant highlighted in a recent report.
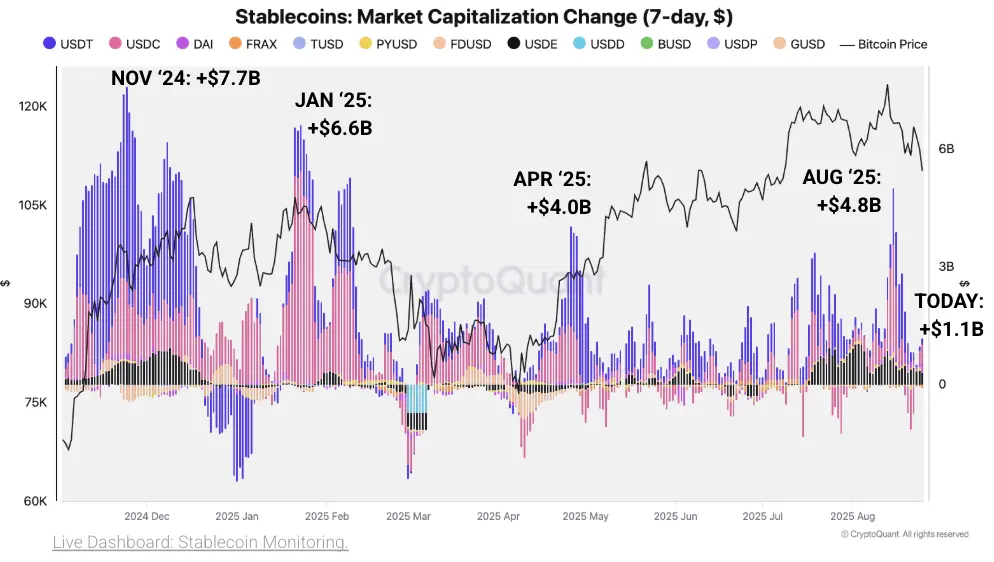
Stablecoin market capitalization | Source: CryptoQuant
Historically, growth in stablecoin market capitalization has coincided with the rapid appreciation of Bitcoin price. This expansion reflects the influx of fresh capital into the crypto ecosystem, which supports the growing demand for crypto assets.
Chart of the day: Bitcoin upholds short-term bullish outlook
Bitcoin holds above $110,000 at the time of writing on Tuesday, as bulls shift their focus on breaching the immediate 100-day Exponential Moving Average (EMA) at $110,697. The path with the least resistance is gradually shifting upward, underpinned by optimism for what could be the first interest rate cut by the Fed this year. A buy signal from the Moving Average Convergence Divergence (MACD) indicator backs a bullish outlook. If traders increase their exposure anticipating a steady rebound in the Bitcoin price, a reversal to the resistance at $118,510, which was last tested on August 10, would gain momentum.
The Relative Strength Index (RSI) at 43 reinforces the bullish grip as it rebounds toward the midline. Demand for BTC is expected to increase in tandem with the recovery of the RSI supporting a bullish outcome.
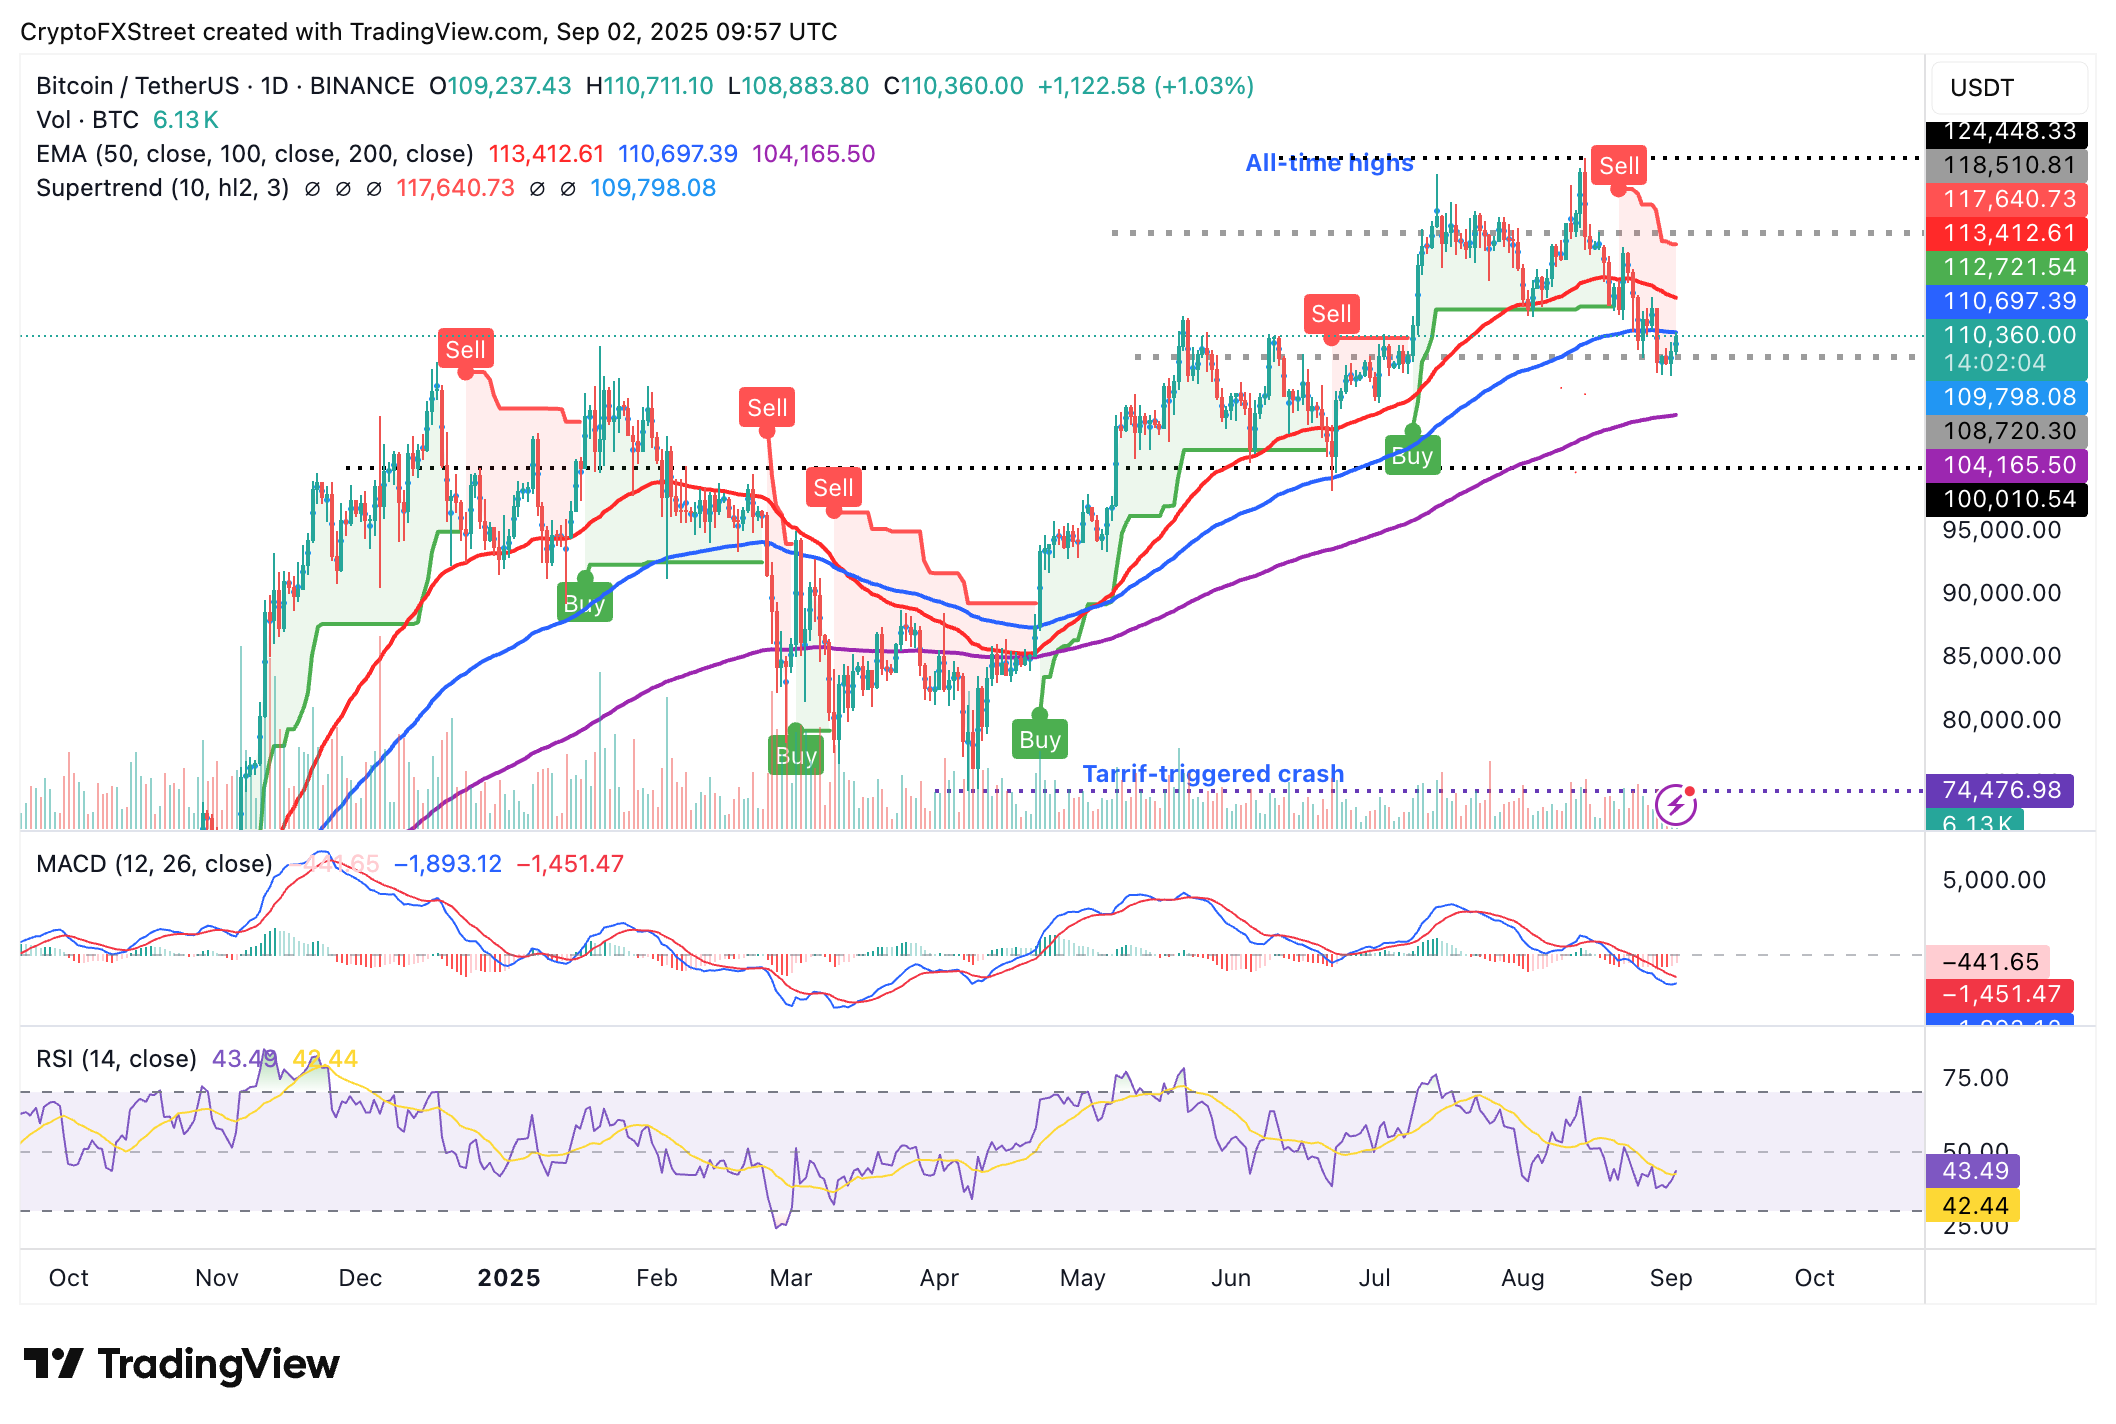
BTC/USDT daily chart
Still, Bitcoin faces macroeconomic uncertainty, especially with upcoming key inflation indicators influencing the Fed's monetary policy decision. Hence, there's a need to keep an eye on critical support levels, including the 200-day EMA at $104,165 and the round-figure psychological zone at $100,000. If Bitcoin accelerates its decline, these levels could serve as Dollar-Cost Averaging (DCA) opportunities ahead of the next recovery attempt.
Altcoins update: Ethereum, XRP offer recovery signals
Ethereum is extending its consolidation between the record high of $4,956 and the support at around $4,000. Key technical indicators are offering mixed signals, with the RSI slightly above the midline, at 52, indicating that buying pressure has stabilized.
Ethereum's price position above the 50-day EMA at $4,014, the 100-day EMA at $3,532 and the 200-day EMA at $3,132 supports bullish market sentiment.
On the other hand, the MACD has displayed a sell signal since August 24. As the indicator drops toward the mean line, traders increasingly reduce exposure, contributing to the headwinds.
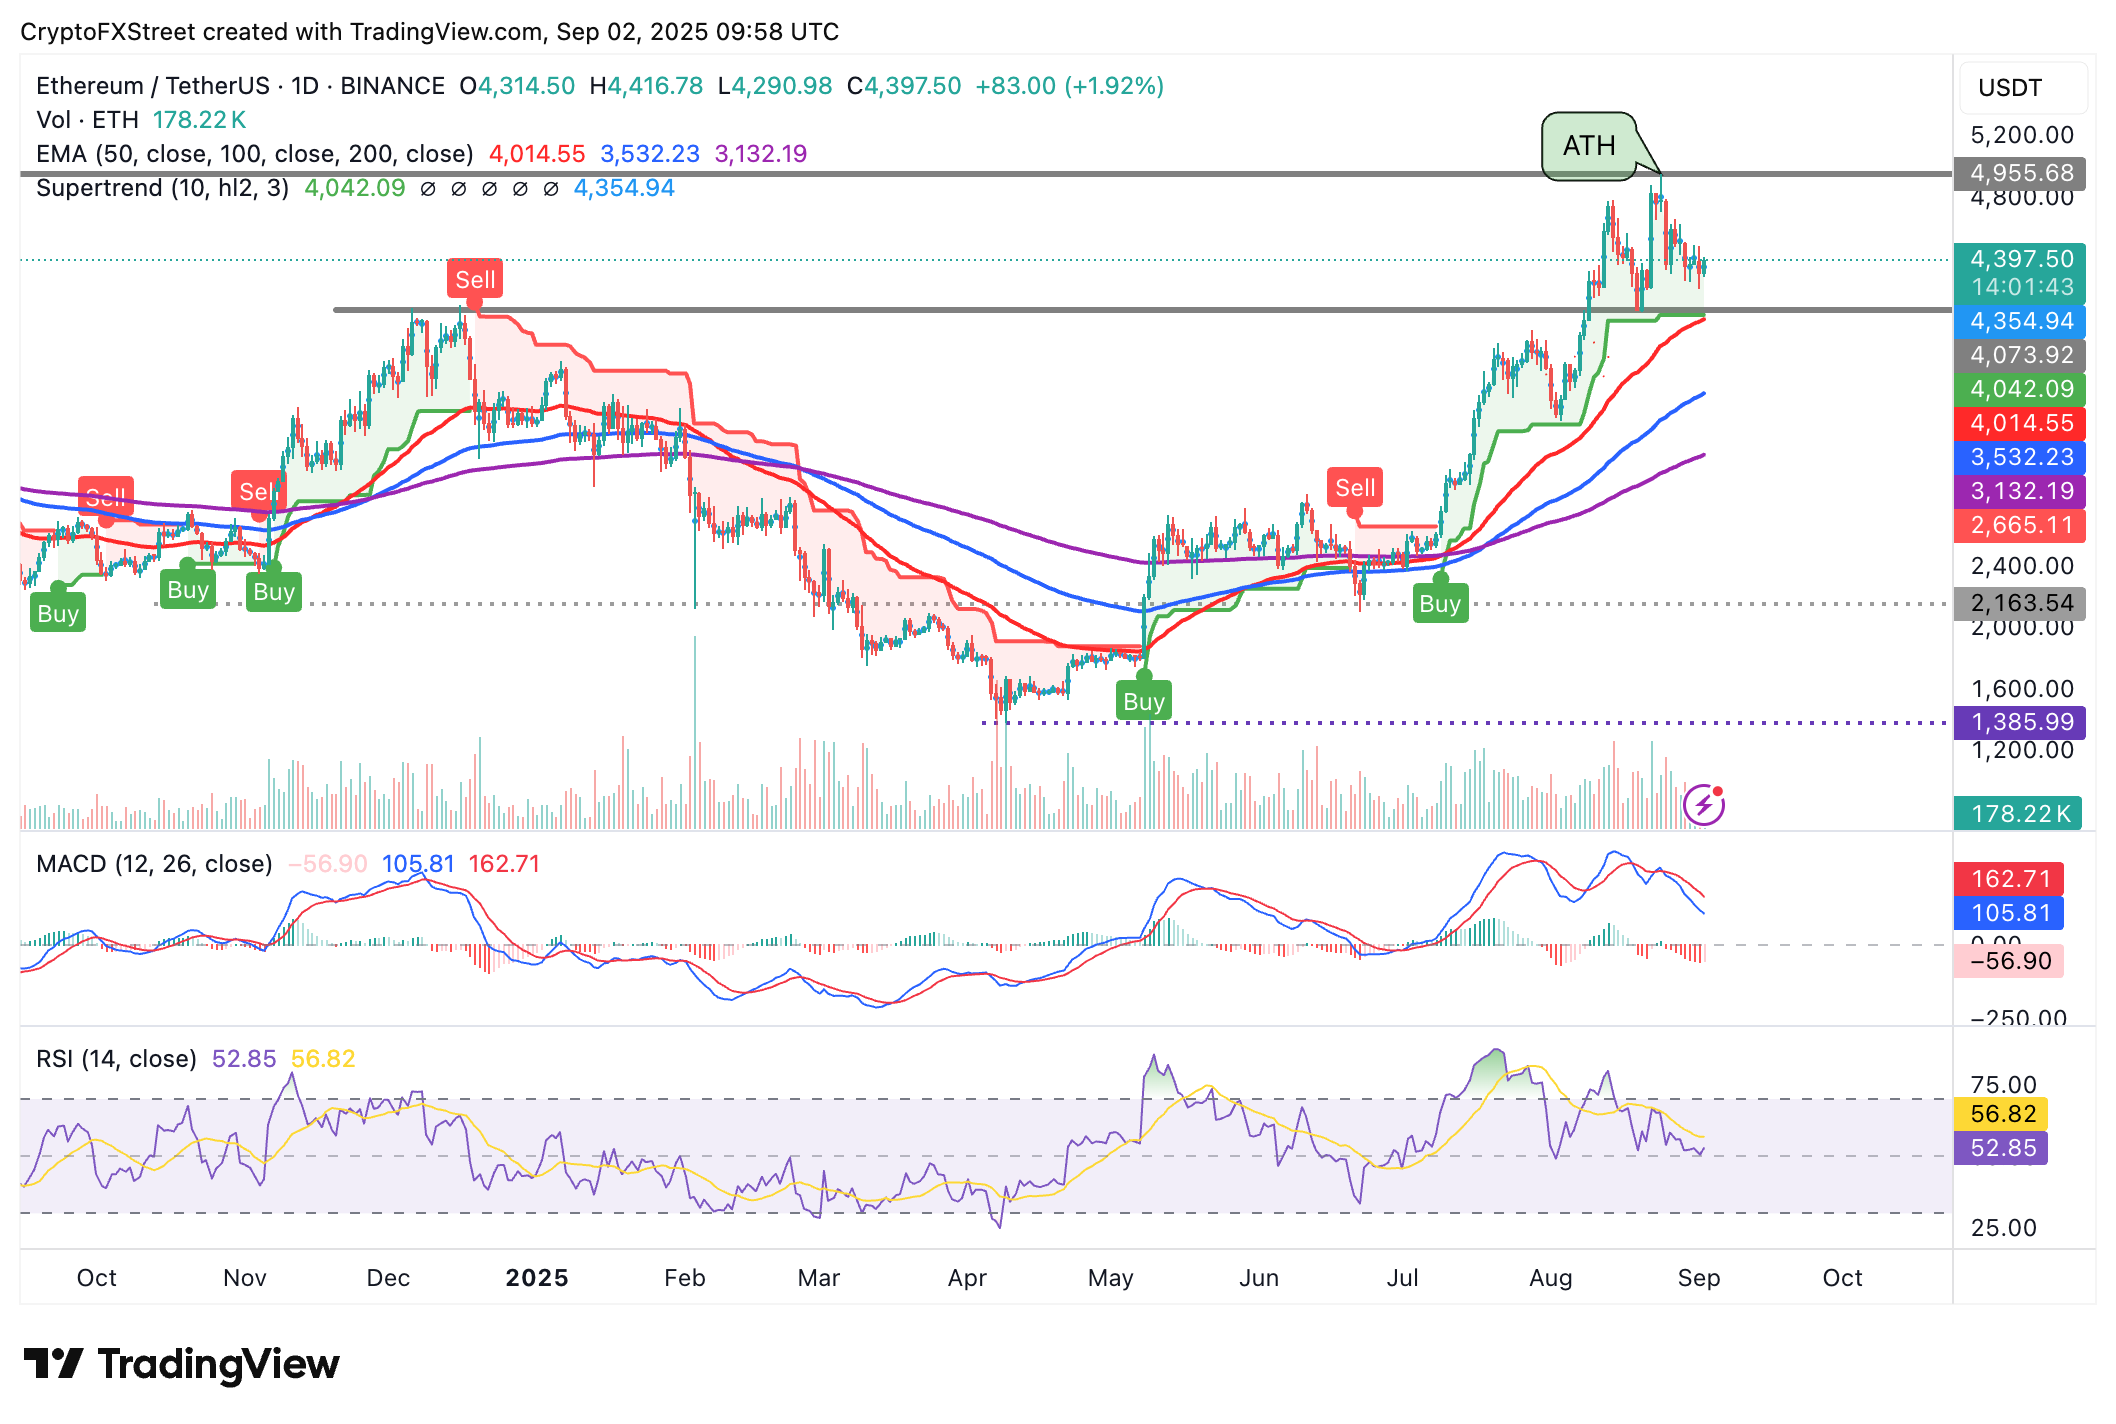
ETH/USDT daily chart
Interest in Ethereum has cooled over the last two weeks, with the futures Open Interest (OI) averaging at $58.4 billion, down from $70.13 billion recorded on August 24. If this trend persists, it would indicate low conviction in Ethereum's bullish outlook, with traders closing long orders or generally reducing market activity.
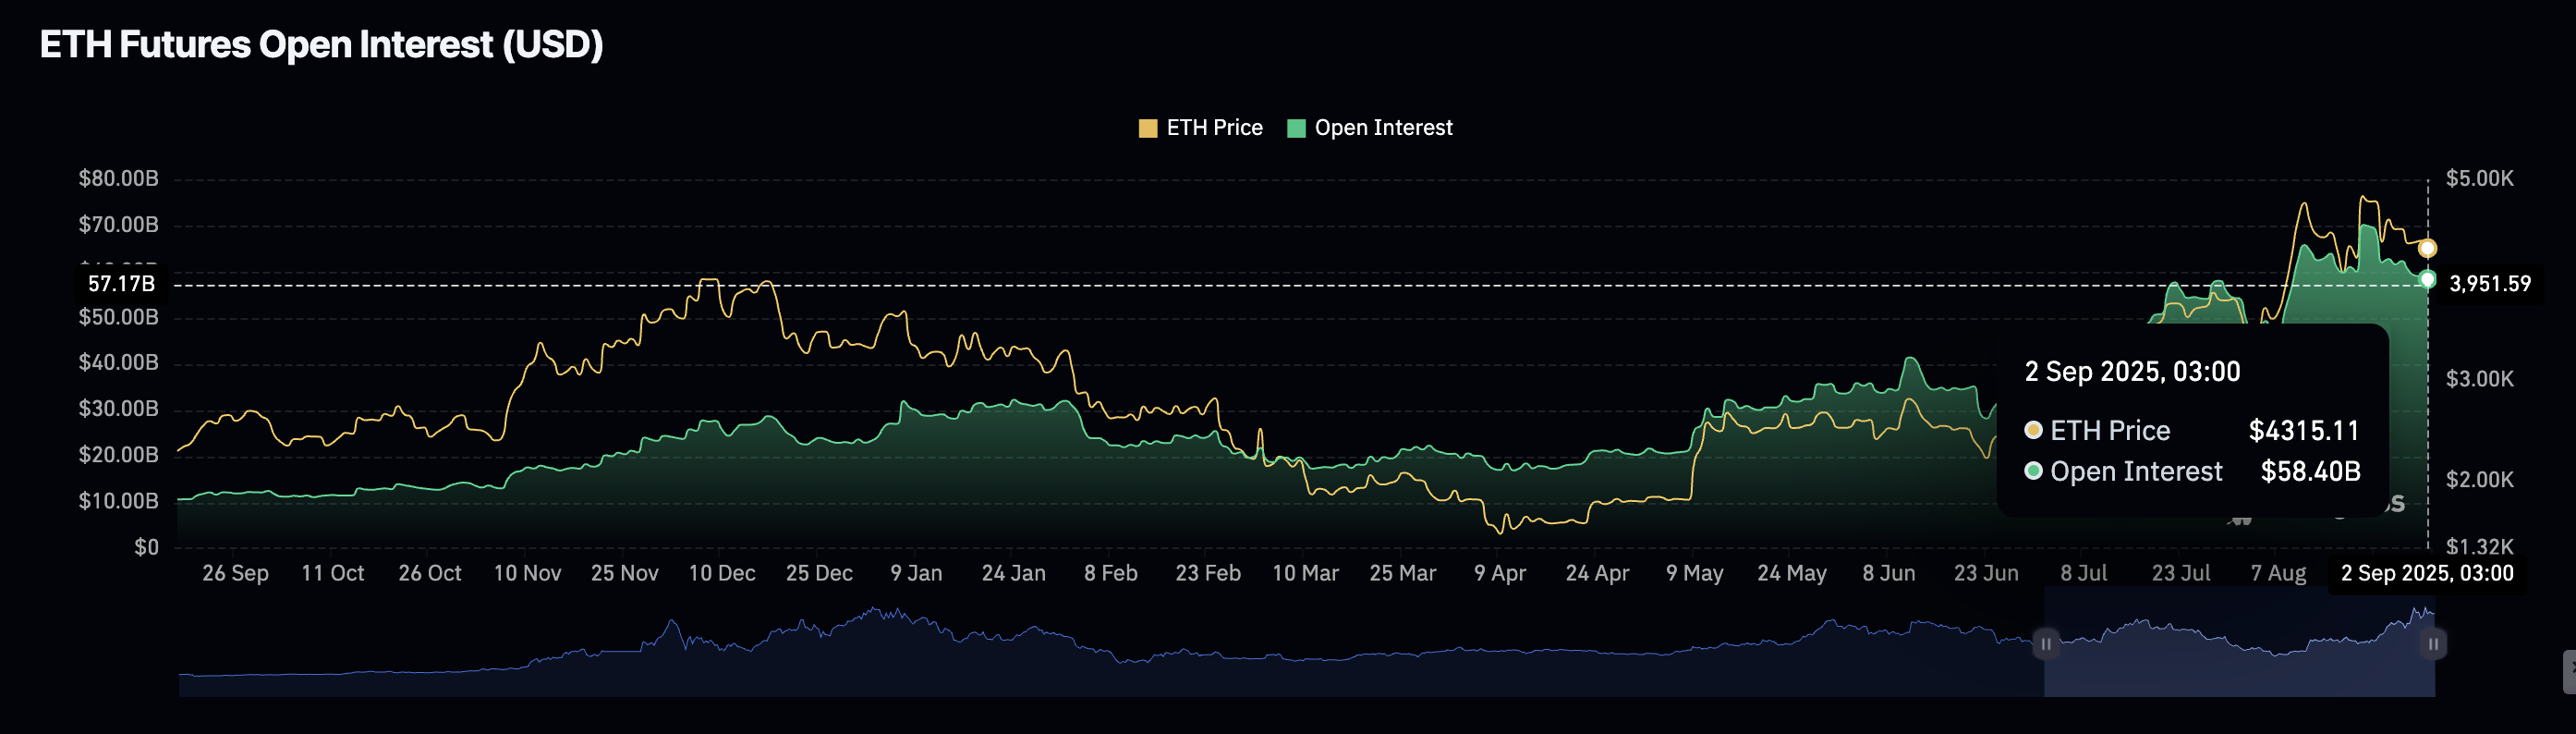
Ethereum futures Open Interest | Source: CoinGlass
As for XRP, bulls are battling to take back control, holding above the 100-day EMA support at $2.76. The RSI at 42 backs the short-term bullish outlook, eyeing a breakout above the $3.00 level.
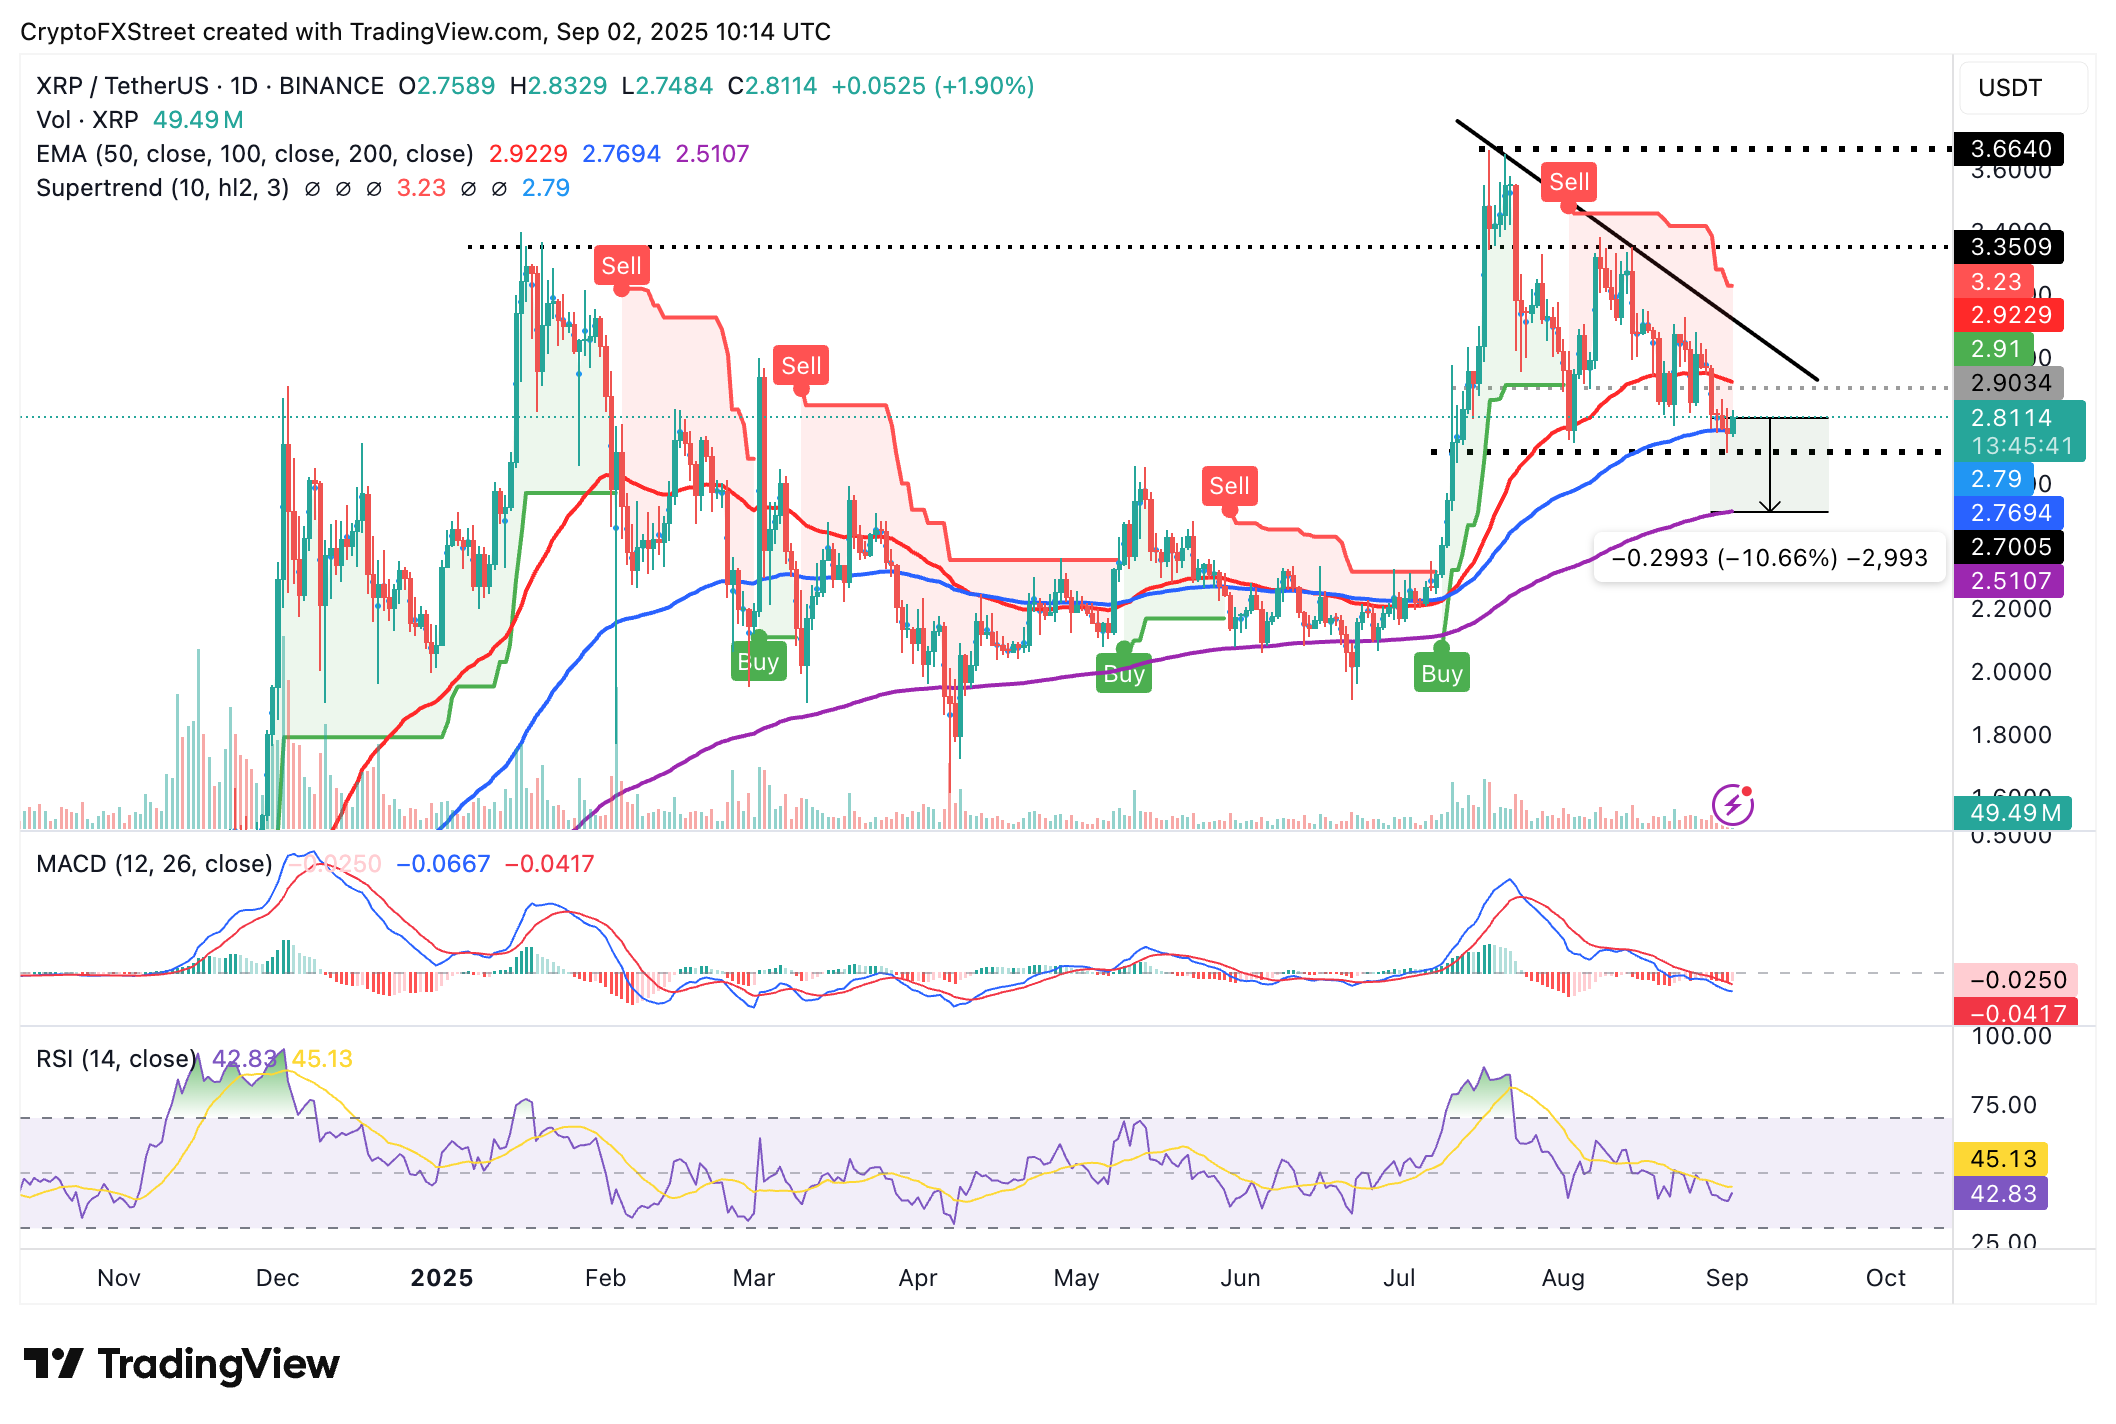
XRP/USDT daily chart
Traders should consider the longstanding MACD sell signal, which has been maintained since July 25. If traders de-risk due to short-term bearish biases, the XRP price could resume its downtrend, 11% below the current level, to the 200-day EMA support at $2.51.
Cryptocurrency prices FAQs
Token launches influence demand and adoption among market participants. Listings on crypto exchanges deepen the liquidity for an asset and add new participants to an asset’s network. This is typically bullish for a digital asset.
A hack is an event in which an attacker captures a large volume of the asset from a DeFi bridge or hot wallet of an exchange or any other crypto platform via exploits, bugs or other methods. The exploiter then transfers these tokens out of the exchange platforms to ultimately sell or swap the assets for other cryptocurrencies or stablecoins. Such events often involve an en masse panic triggering a sell-off in the affected assets.
Macroeconomic events like the US Federal Reserve’s decision on interest rates influence crypto assets mainly through the direct impact they have on the US Dollar. An increase in interest rate typically negatively influences Bitcoin and altcoin prices, and vice versa. If the US Dollar index declines, risk assets and associated leverage for trading gets cheaper, in turn driving crypto prices higher.
Halvings are typically considered bullish events as they slash the block reward in half for miners, constricting the supply of the asset. At consistent demand if the supply reduces, the asset’s price climbs.
추천 기사


