
Hyperliquid struggles to reclaim $40 threshold as bearish sentiment persists
- Hyperliquid extends its bearish leg 22% from the record high as investors enter risk-off mode.
- A weak technical structure characterized by a MACD sell signal and a downward-trending RSI indicates dominant selling pressure.
- HYPE DeFi TVL dips slightly but remains above the $2 billion mark.
Hyperliquid (HYPE), the high-performance Layer-1 blockchain protocol, is edging lower on Friday, underpinned by bearish market sentiment in the broader cryptocurrency market. Following a bullish July, which propelled HYPE 35% to its record high of $49.85, the token has trimmed part of the gains to exchange hands at $39.48 at the time of writing.
HYPE slips below $40.00 as DeFi TVL falters
Hyperliquid’s Decentralized Finance (DeFi) ecosystem experienced tremendous growth in the second quarter, with the trend continuing in the third quarter of this year, bringing the Total Value Locked (TVL) to a historical high of $2.14 billion.
TVL refers to the sum of the value of all coins held in smart contracts of all the protocols on the chain. Such a consistent increase in TVL underscores investor confidence in the ecosystem, as holders anticipate the price of HYPE to keep rising. Smart contracts allow token holders to participate in securing the network while earning annualized rewards.
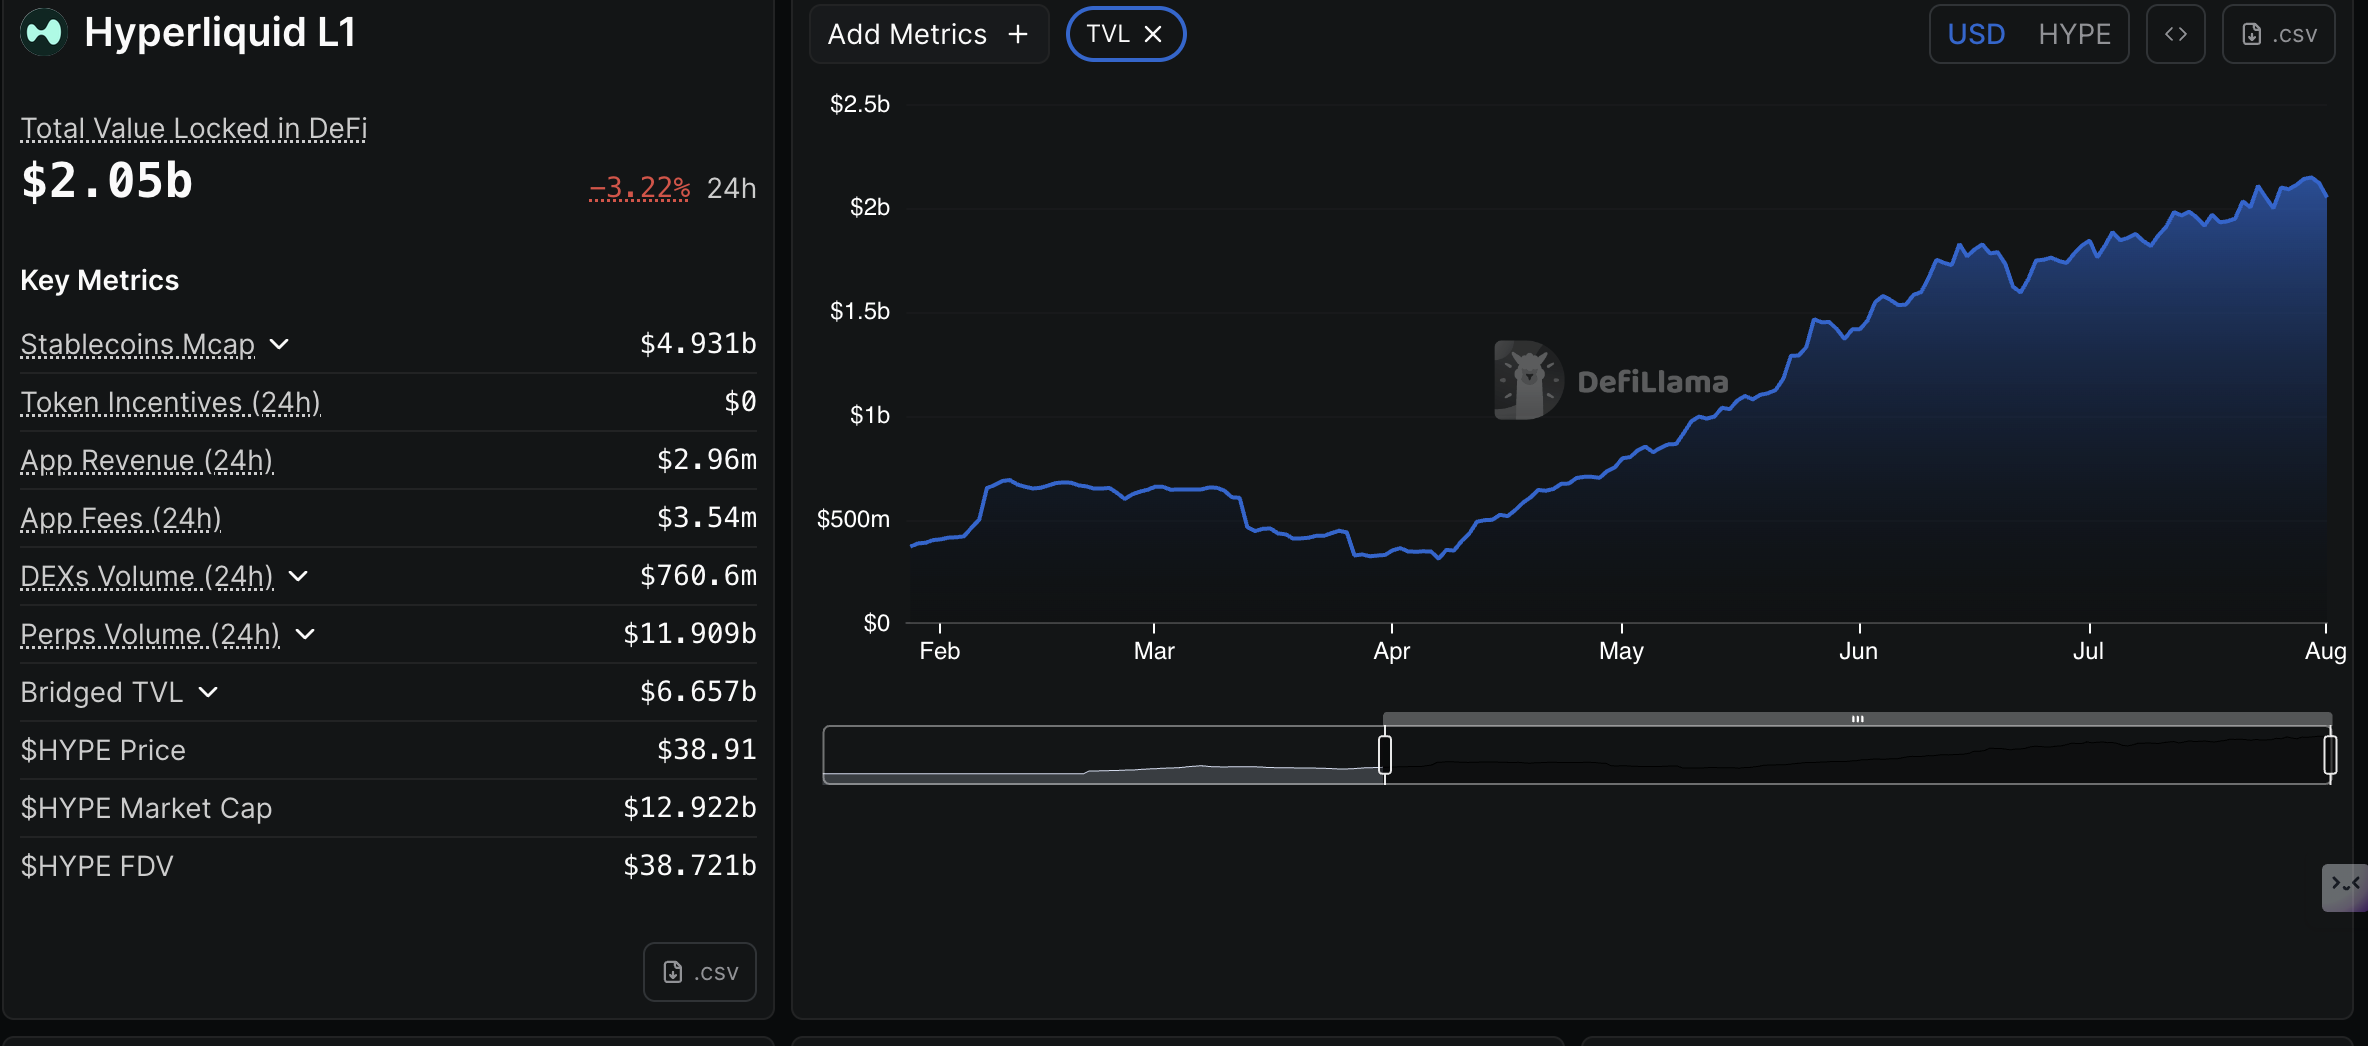
Hyperliquid DeFi TVL | Source: DefiLlama
As TVL rises, the token’s circulating supply decreases, in turn, causing a reduction in potential selling pressure. However, with HYPE’s DeFi TVL faltering slightly from the record high of $2.05 billion on Friday, it could imply a shaky recovery in upcoming sessions.
The reversal in the TVL coincides with a minor drop in the futures Open Internet (OI), averaging $1.86 billion after peaking at $2.19 billion on July 15. If this drop persists, it would indicate a lack of conviction in HYPE’s ability to sustain recovery as fewer traders leverage long positions.
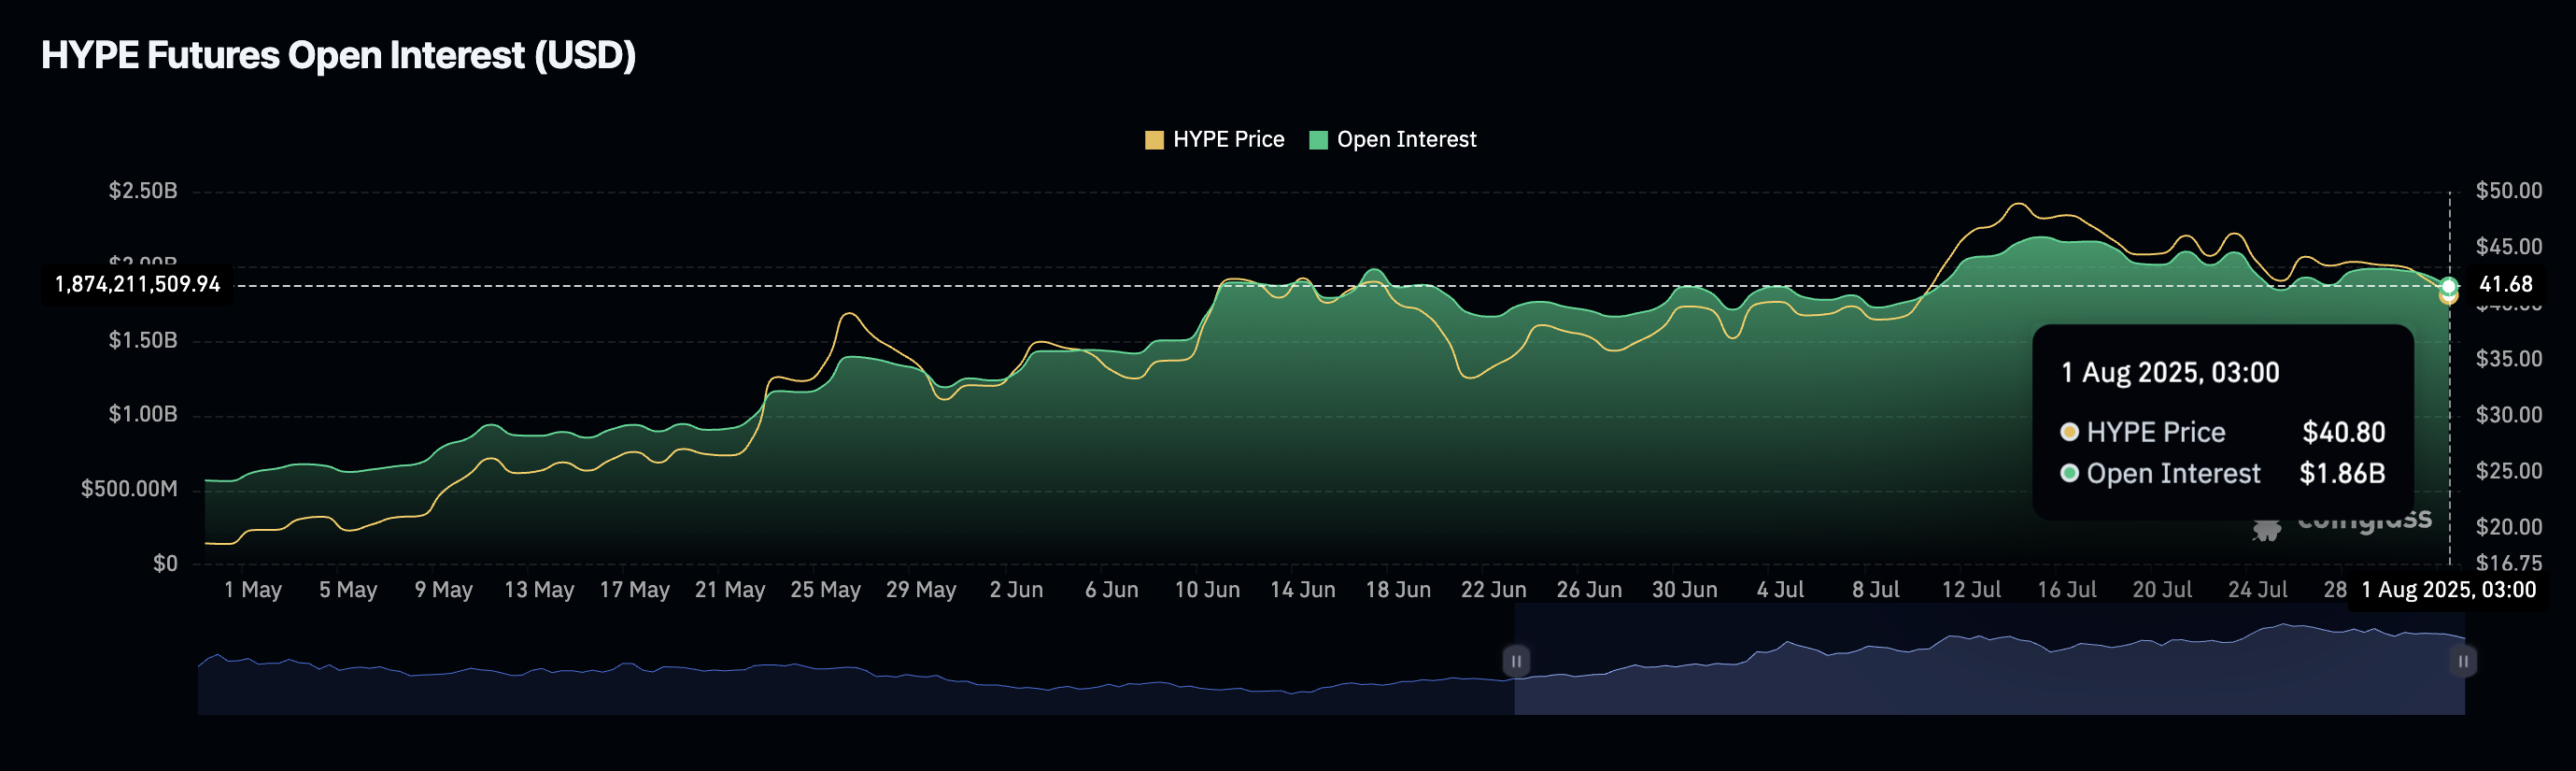
Hyperliquid Futures Open Interest | Source: CoinGlass
Technical outlook: Hyperliquid holds below $40.00
Hyperliquid price remains suppressed below the $40.00 threshold, reflecting risk-off sentiment and low speculative demand. The daily chart below highlights key bearish signals, including a downward-trending Relative Strength Index (RSI) that is currently below the midline at 39.
A sell signal maintained by the Moving Average Convergence Divergence (MACD) indicator since Sunday calls on investors to consider reducing exposure. The red histogram bars below the mean line imply dominant bearish momentum. If this outlook persists, the decline could accelerate toward the 50-day Exponential Moving Average (EMA) currently at $36.07.
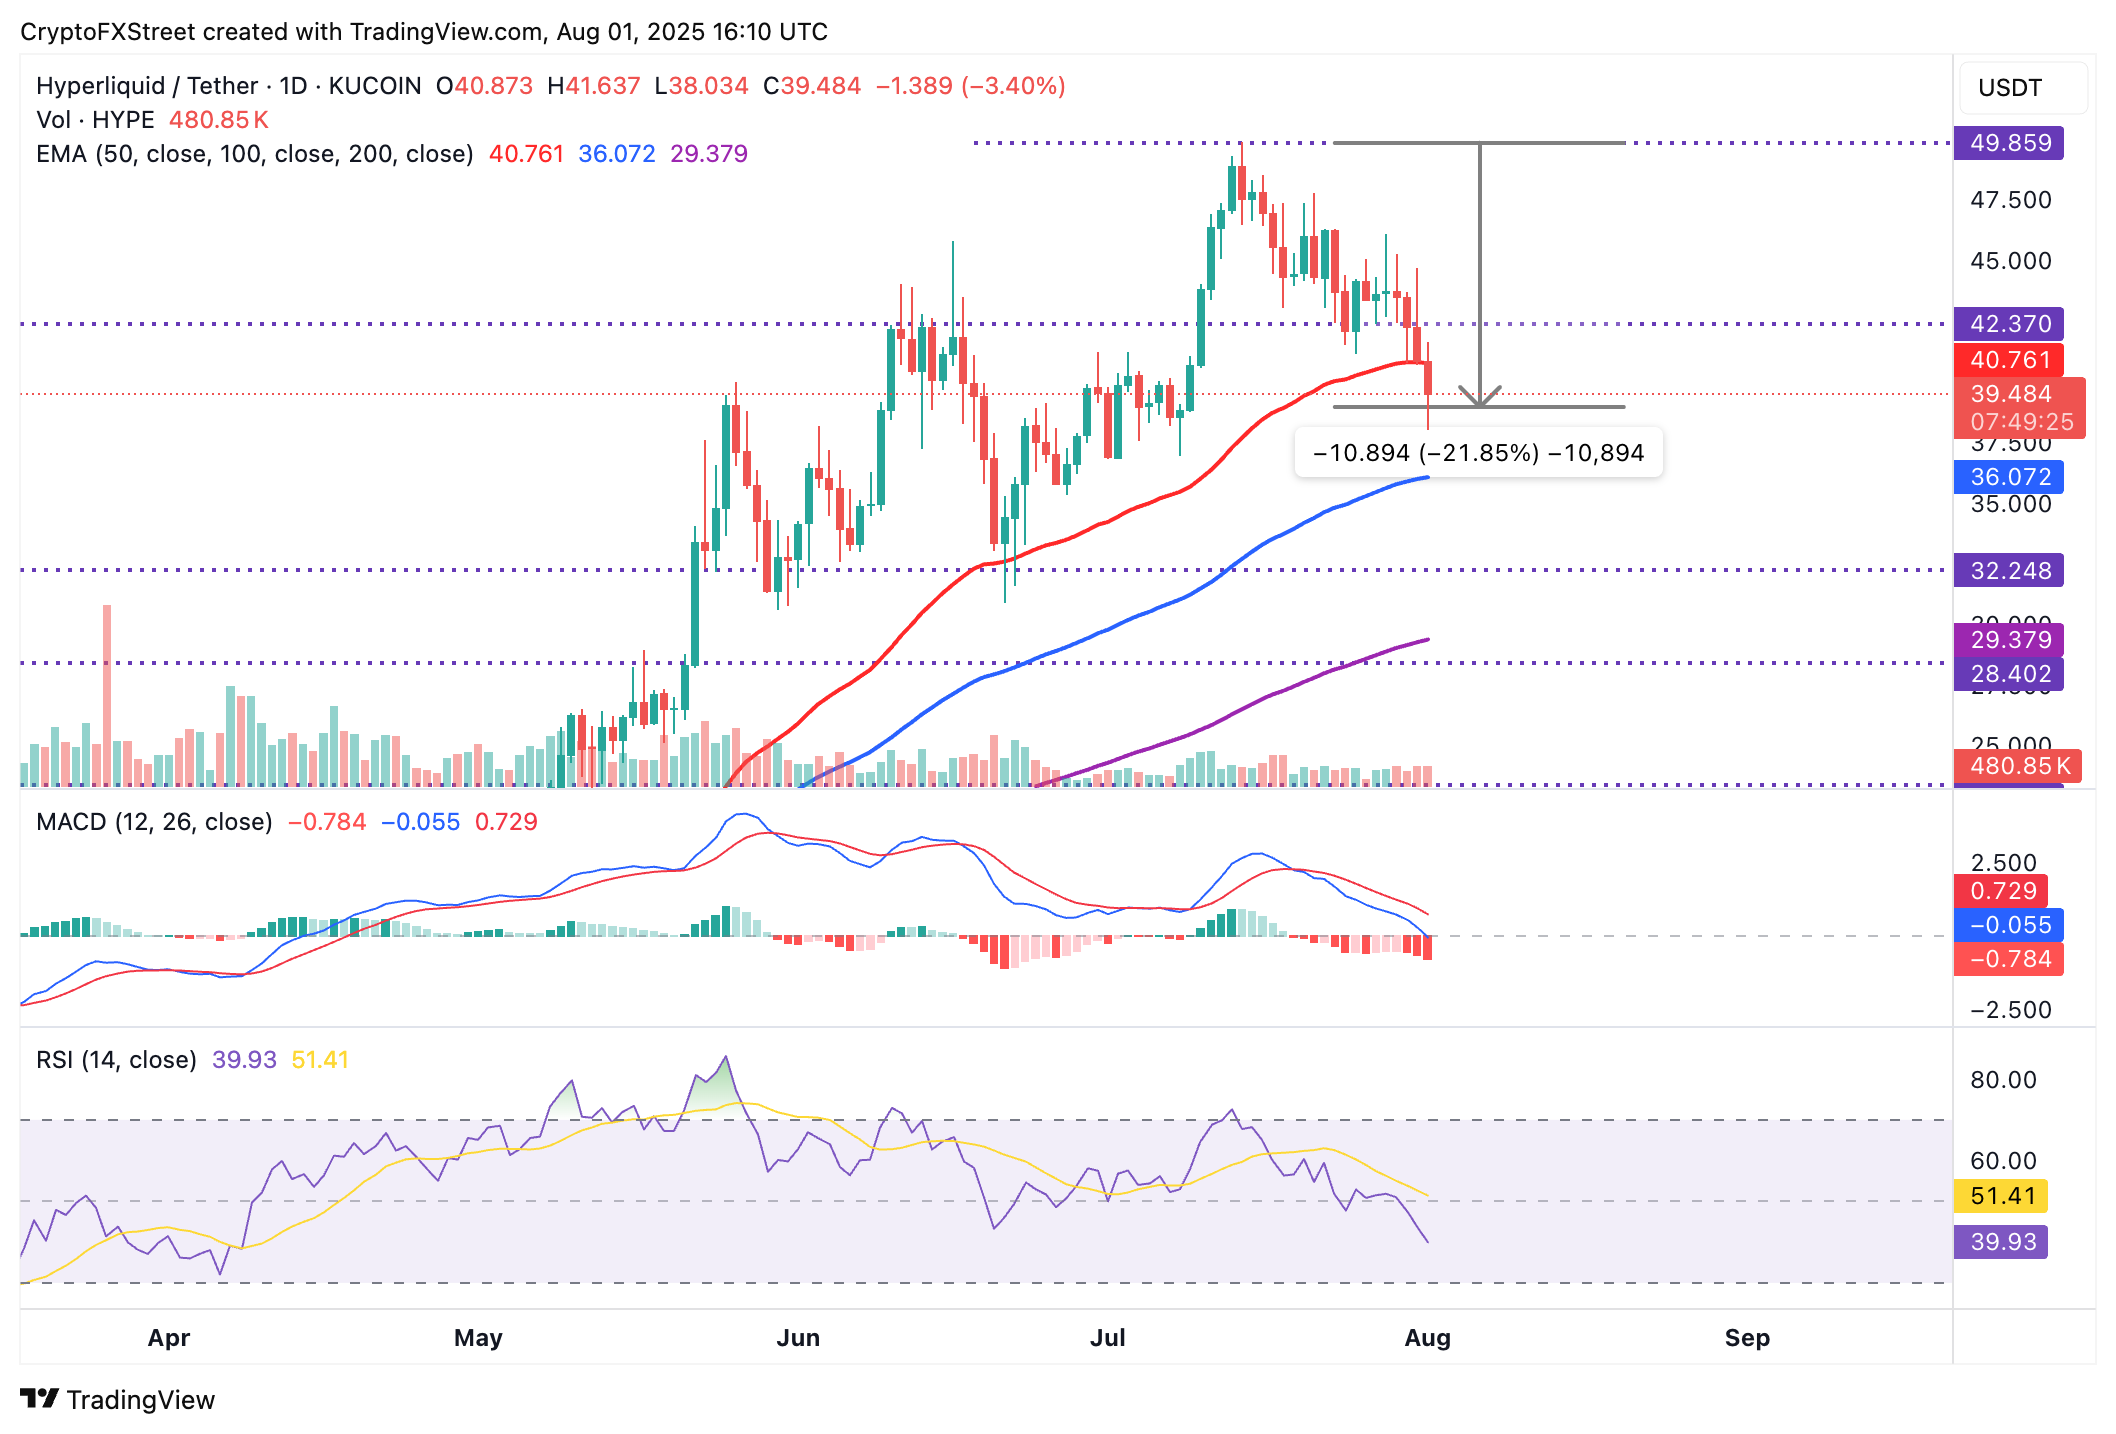
HYPE/USDT daily chart
Still, traders must temper their bearish expectations to manage risk, especially if bulls push to reclaim support above $40.00. Although such a move does not guarantee a major trend reversal, it could encourage risk-on sentiment, allowing traders to increase exposure, as they shift focus on the record high slightly below $50.00.
Open Interest, funding rate FAQs
Higher Open Interest is associated with higher liquidity and new capital inflow to the market. This is considered the equivalent of increase in efficiency and the ongoing trend continues. When Open Interest decreases, it is considered a sign of liquidation in the market, investors are leaving and the overall demand for an asset is on a decline, fueling a bearish sentiment among investors.
Funding fees bridge the difference between spot prices and prices of futures contracts of an asset by increasing liquidation risks faced by traders. A consistently high and positive funding rate implies there is a bullish sentiment among market participants and there is an expectation of a price hike. A consistently negative funding rate for an asset implies a bearish sentiment, indicating that traders expect the cryptocurrency’s price to fall and a bearish trend reversal is likely to occur.
추천 기사


