
Silver Price Forecast: XAG/USD plummets below $33.00 as US-EU trade worries fade
- Silver price plunges almost 2% to near $32.80 as US-EU trade tensions ease.
- The US Dollar gains as the EU and the US progress towards reaching a trade deal.
- US President Trump suspended 50% tariffs on the EU until July 9.
Silver price (XAG/USD) dives almost 2% to near $32.80 during North American trading hours on Tuesday. Investors have dumped the white metal as trade tensions between the United States (US) and the European Union (EU) have eased, with President Donald Trump postponing 50% tariffs on the trading bloc to July 9 from June 1.
Signs of easing US-EU trade uncertainty have diminished demand for safe-haven assets, such as Silver.
Meanwhile, the US Dollar (USD) has gained sharply as Washington and Brussels have increased efforts to reach a bilateral deal, potentially impacting the Silver price. During European trading hours, a report from Reuters showed that European officials have asked domestic firms to share their plans for investment in the US. Technically, a higher US Dollar makes the Silver price an expensive bet for investors.
The US Dollar Index (DXY), which tracks the Greenback’s value against six major currencies, jumps to near 99.35 after attracting bids near the monthly low of 98.70 posted on Monday.
The US Dollar should have shown strength on Monday as Trump’s decision to suspend 50% EU tariffs came over the weekend. However, it remained on the backfoot due to the holiday in the US on account of Memorial Day.
Analysts at Commerzbank said, "I would guess strength in the US Dollar is because Trump retreated over the weekend. Yesterday, markets were closed, so there was only a small move. Now, with the UK being back, it’s a recovery of the move we saw on Friday."
Silver technical analysis
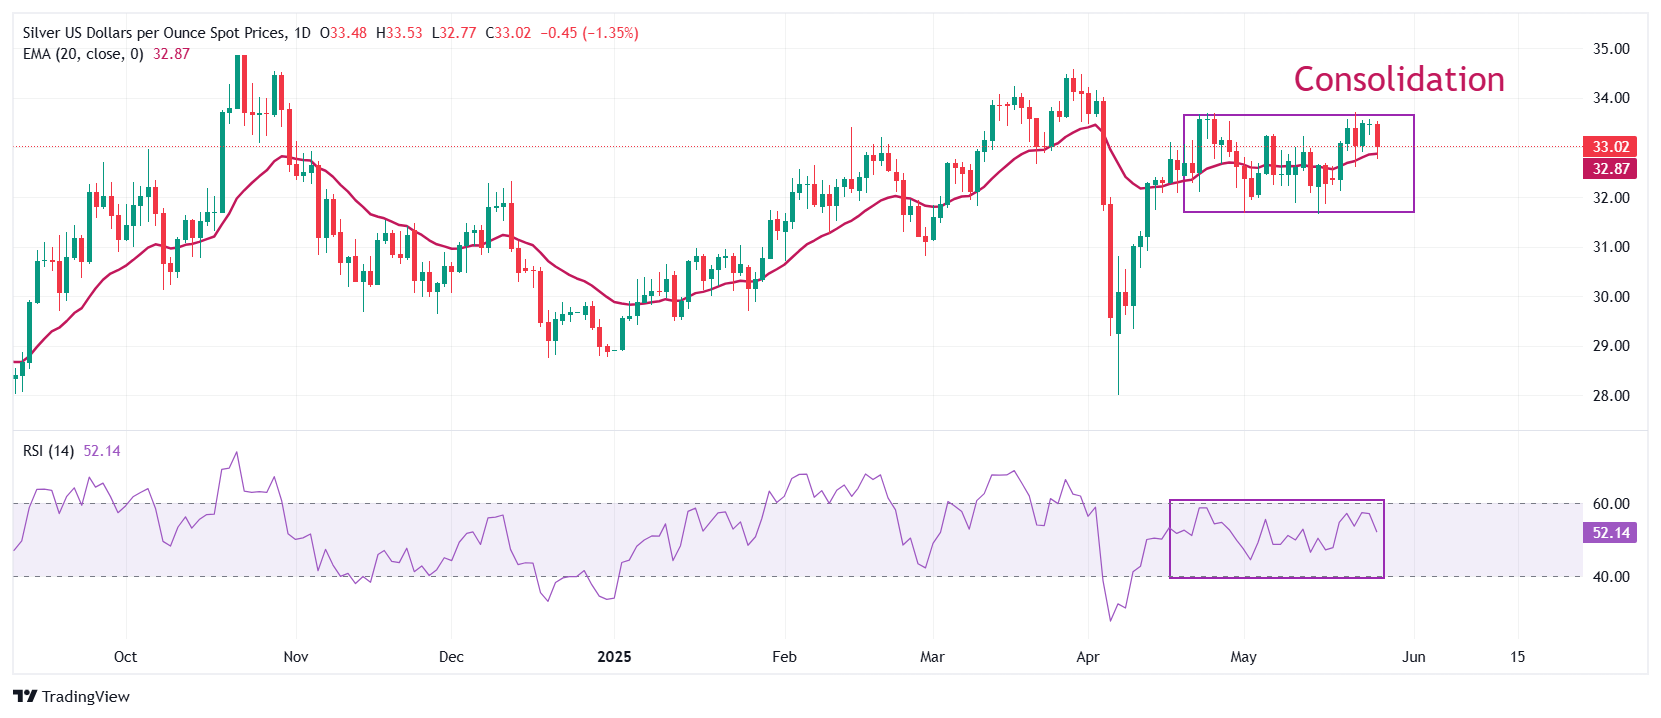
Silver price ranges between $31.65 and $33.70 for a month. The near-term trend of the white metal is uncertain as it wobbles around the 20-period Exponential Moving Average (EMA), which trades near $32.87.
The 14-period Relative Strength Index (RSI) oscillates inside the 40.00-60.00 range, indicating a sideways trend.
Looking up, the March 28 high of $34.60 will act as key resistance for the metal. On the downside, the April 11 low of $30.90 will be the key support zone.
Silver daily chart
Silver FAQs
Silver is a precious metal highly traded among investors. It has been historically used as a store of value and a medium of exchange. Although less popular than Gold, traders may turn to Silver to diversify their investment portfolio, for its intrinsic value or as a potential hedge during high-inflation periods. Investors can buy physical Silver, in coins or in bars, or trade it through vehicles such as Exchange Traded Funds, which track its price on international markets.
Silver prices can move due to a wide range of factors. Geopolitical instability or fears of a deep recession can make Silver price escalate due to its safe-haven status, although to a lesser extent than Gold's. As a yieldless asset, Silver tends to rise with lower interest rates. Its moves also depend on how the US Dollar (USD) behaves as the asset is priced in dollars (XAG/USD). A strong Dollar tends to keep the price of Silver at bay, whereas a weaker Dollar is likely to propel prices up. Other factors such as investment demand, mining supply – Silver is much more abundant than Gold – and recycling rates can also affect prices.
Silver is widely used in industry, particularly in sectors such as electronics or solar energy, as it has one of the highest electric conductivity of all metals – more than Copper and Gold. A surge in demand can increase prices, while a decline tends to lower them. Dynamics in the US, Chinese and Indian economies can also contribute to price swings: for the US and particularly China, their big industrial sectors use Silver in various processes; in India, consumers’ demand for the precious metal for jewellery also plays a key role in setting prices.
Silver prices tend to follow Gold's moves. When Gold prices rise, Silver typically follows suit, as their status as safe-haven assets is similar. The Gold/Silver ratio, which shows the number of ounces of Silver needed to equal the value of one ounce of Gold, may help to determine the relative valuation between both metals. Some investors may consider a high ratio as an indicator that Silver is undervalued, or Gold is overvalued. On the contrary, a low ratio might suggest that Gold is undervalued relative to Silver.
추천 기사


