

Gold tumbles as strong US NFP data points to gradual Fed rate cuts
- Gold drops after robust US jobs report lowers pressure on the Fed.
- US 10-year T-note yield climbs to 3.971%, while the US Dollar Index hits mid-August highs at 102.58, capping Gold’s rise.
- Geopolitical risks involving Israel and Iran to support Gold, which could hit $2,700.
Gold price retraces after a stronger-than-expected US jobs report hinted that the labor market remains solid and that the Federal Reserve (Fed) will likely ease policy in 25-basis-point (bps) chunks. At the time of writing, the XAU/USD trades at $2,643, down 0.40%.
The US Bureau of Labor Statistics (BLS) revealed that the labor market is far from being in a tough spot following an outstanding September jobs report. The data reduced the pressure on the Fed, which reduced borrowing costs by 0.50% at the September meeting, amid fears of achieving the US central bank maximum employment mandate.
The Unemployment Rate ticked two tenths lower, while Average Hourly Earnings were mixed, with monthly readings decreasing, while in the 12 months to September it rose.
Traders reacted to the data, lifting the US 10-year T-note yield 12 basis points to 3.971%, a level last seen in mid-August 2024. That was one of the reasons that capped Gold prices. The US Dollar Index (DXY), which tracks the Greenback’s value against a basket of six peers, also hit its highest level since mid-August at 102.58, up 0.63%.
The data locked in a 25 bps rate cut by the US central bank at the upcoming November meeting. In fact, a minimal percentage of investors project the Fed will hold rates unchanged.
Next week, the US docket will feature the release of inflation data, jobless claims and University of Michigan Consumer Sentiment.
Chicago Fed President Austan Goolsbee, not a voter in 2024 but one of the most dovish members at the Federal Open Market Committee (FOMC), said that more reports like this “will make me more confident we are settling in at full employment.” He said most Fed officials expect rates to decrease “a lot” over the next 18 months.
Meanwhile, geopolitics will continue to cap the fall in Bullion prices. An escalation of the conflict involving Hezbollah, Iran, Israel and the United States (US) would underpin XAU/USD prices and open the door to challenge $2,700.
Daily digest market movers: Gold price falls amid fading US recession fears
- US Nonfarm Payrolls increased by 254K in September, surpassing the estimated 140K and the upwardly revised August figure of 159K. The Unemployment Rate decreased from 4.2% to 4.1%, lower than expected.
- Average Hourly Earnings in September rose 0.4% MoM, down from 0.5% the previous month but exceeded forecasts of 0.3%.
- Earnings per hour increased by 4% in the 12 months to September, above estimates and August’s number, which was 3.8% and 3.9%, respectively.
- Market participants have disregarded a 50 bps cut from the Fed. The odds of a 25 bps cut are 95%, while the chances for holding rates unchanged are at 5%, according to the CME FedWatch Tool data.
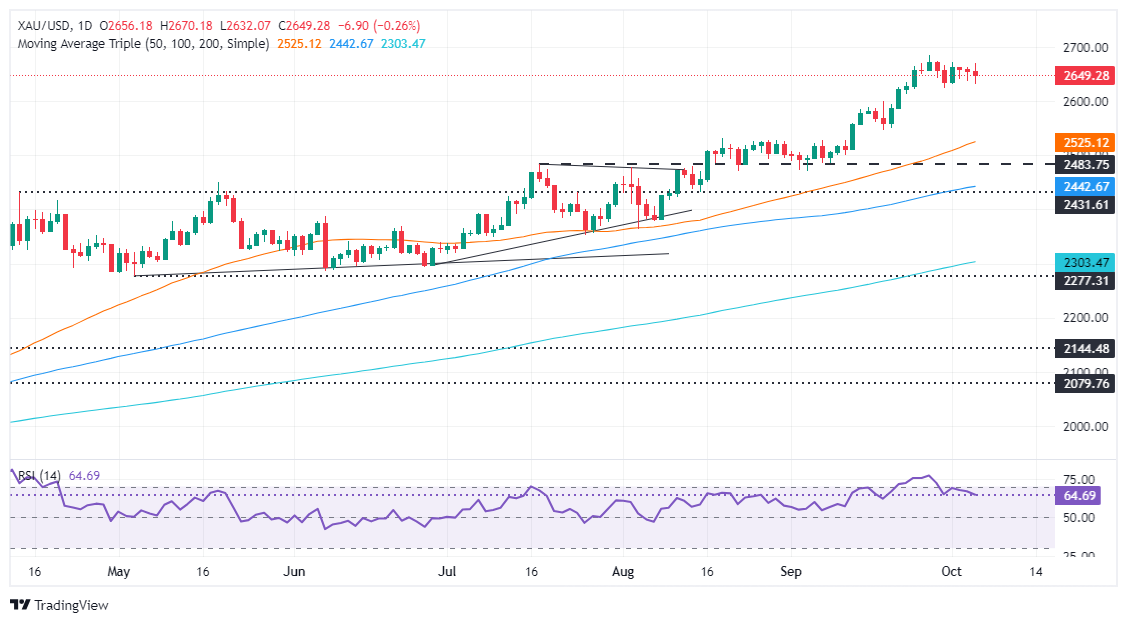
XAU/USD technical analysis: Gold price drops below $2,650, eyeing key technical level below $2,600
Gold's price consolidated near $2,640-$2,670 for the fifth straight day after the Relative Strength Index (RSI) exited overbought territory. Price action remains range-bound while buyers lose momentum, opening the door for a pullback.
If XAU/USD achieves a daily close below $2,650, look for a drop toward the September 18 high turned support at $2,600. Once surrendered, the next demand area would be the 50-day Simple Moving Average (SMA) at $2,524.
Conversely, for a bullish continuation, the XAU/USD needs to clear $2,670 to have the chance to challenge the year-to-date high of $2,685. Up next will be the $2,700 mark.
Gold FAQs
Gold has played a key role in human’s history as it has been widely used as a store of value and medium of exchange. Currently, apart from its shine and usage for jewelry, the precious metal is widely seen as a safe-haven asset, meaning that it is considered a good investment during turbulent times. Gold is also widely seen as a hedge against inflation and against depreciating currencies as it doesn’t rely on any specific issuer or government.
Central banks are the biggest Gold holders. In their aim to support their currencies in turbulent times, central banks tend to diversify their reserves and buy Gold to improve the perceived strength of the economy and the currency. High Gold reserves can be a source of trust for a country’s solvency. Central banks added 1,136 tonnes of Gold worth around $70 billion to their reserves in 2022, according to data from the World Gold Council. This is the highest yearly purchase since records began. Central banks from emerging economies such as China, India and Turkey are quickly increasing their Gold reserves.
Gold has an inverse correlation with the US Dollar and US Treasuries, which are both major reserve and safe-haven assets. When the Dollar depreciates, Gold tends to rise, enabling investors and central banks to diversify their assets in turbulent times. Gold is also inversely correlated with risk assets. A rally in the stock market tends to weaken Gold price, while sell-offs in riskier markets tend to favor the precious metal.
The price can move due to a wide range of factors. Geopolitical instability or fears of a deep recession can quickly make Gold price escalate due to its safe-haven status. As a yield-less asset, Gold tends to rise with lower interest rates, while higher cost of money usually weighs down on the yellow metal. Still, most moves depend on how the US Dollar (USD) behaves as the asset is priced in dollars (XAU/USD). A strong Dollar tends to keep the price of Gold controlled, whereas a weaker Dollar is likely to push Gold prices up.
추천 기사


