

Oil surges as Iran-UAE strikes and Hormuz risks fuel supply fears
- WTI jumped above $102 as Middle East escalation fueled supply woes.
- UAE facility attacks and Hormuz risks intensified concerns over oil flows.
- Strong US Factory Orders added support to broader Dollar and yield dynamics.
Western Texas Intermediate (WTI), the US crude oil benchmark soars sharply more than 3% amid an ongoing escalation in the Middle East, as Iran launched attacks on the United Arab Emirates, while sources cited by CNN in Dubai said that they expect attacks on Iran by the US and Israel in the next 24 hours. WTI trades at $102.55 per barrel, after bouncing off daily lows of $96.45.
Oil jumps as UAE attacks, Hormuz tensions raise supply disruption
Reuters revealed that a fire broke out at UAE’s authorities confirmed that a fire brokout at Fujairah petroleum facilities after an Iranian drone attack. UAE’s defense ministry posted on X that its forces intercepted three missiles, with a fourth dropping into the sea.
The UAE announced its exit from OPEC, stating it will produce oil as needed for global markets without restrictions, while continuing to work with other producers.
A US admiral said that Iran has targeted commercial and US military ships with cruise missiles, while adding that the US blockade on Iran is exceeding expectations. He added that the US eliminated six Iranian small boats attempting to interfere with commercial shipping.
Iranian media claimed the regime targeted a US ship, but Axios reported—citing a US official—that no attack occurred. Meanwhile, Trump’s remarks about possibly resuming strikes on Iran if they “misbehave” cast doubt on the ceasefire.
In the meantime, Iran’s Revolutionary Guards Navy revealed a map showing they’re expanding their control zones near the Strait of Hormuz, which include the UAE’s ports of Fujairah and Khorfakkan, as well as the coasts of Umm Al Quwain, according to Iranian news agencies.
Over the weekend, US President Trump announced Operation Freedom, aimed at freeing commercial ships in the Strait of Hormuz, using the US Navy to accomplish that goal.
Meanwhile, South Korea revealed a fire and an explosion on a vessel, while the UAE accused Iran of attacking an Abu Dhabi state oil firm, ADNOC, vessel with drones in the Strait of Hormuz.
In terms of data, US Factory Orders rose by 1.5% MoM in March, surpassing the expected 0.5% increase and up from 0.3% in February.
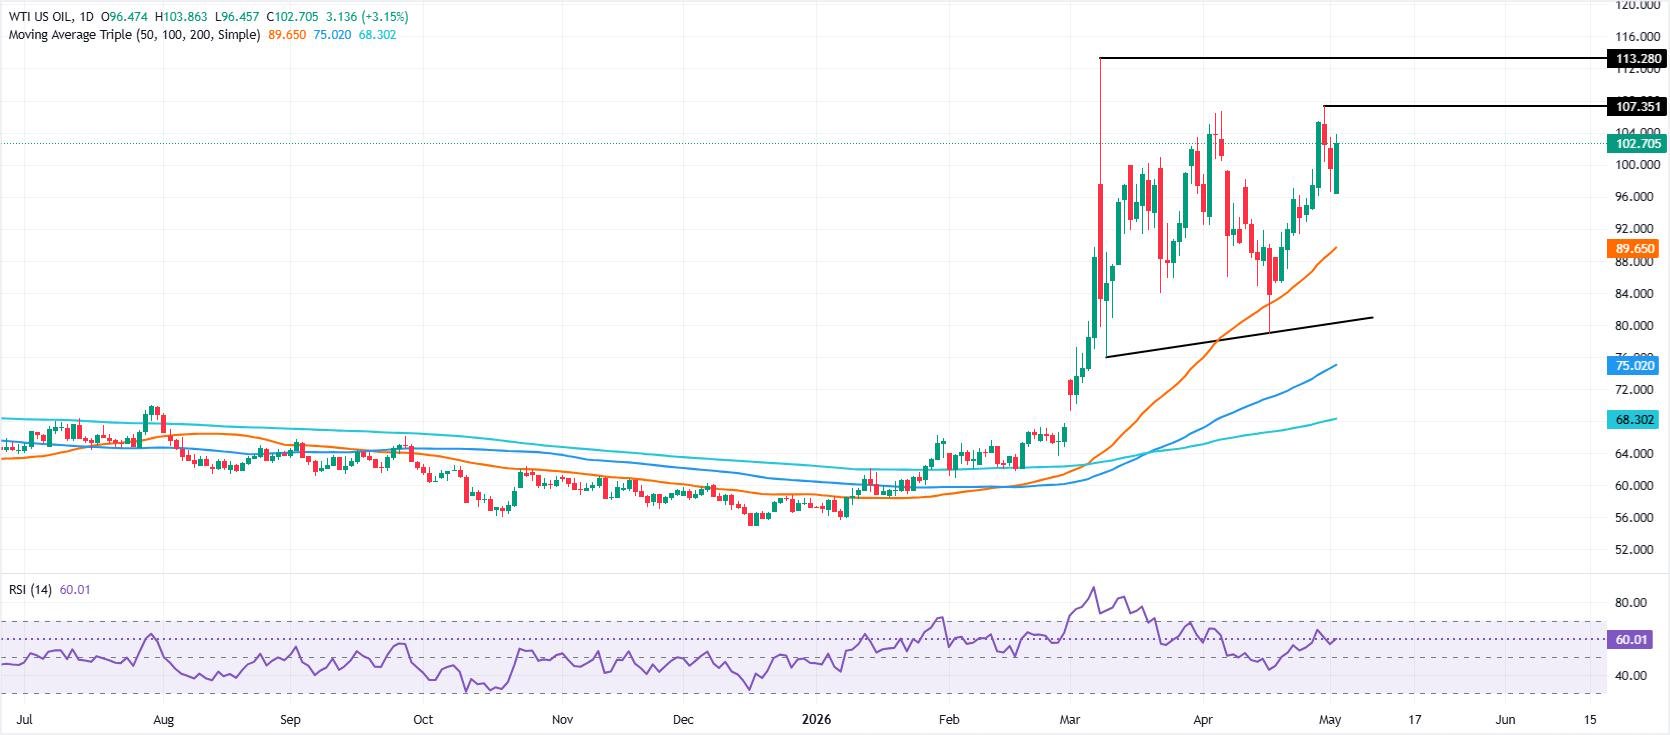
WTI Price Forecast: Technical outlook
From a technical perspective, WTI is neutral to upward biased, with buyers gaining momentum. The Relative Strength Index (RSI) is above its 50 neutral level in bullish territory, aiming higher. Worth noting that price action over the last couple of days is forming a ‘bullish engulfing’ chart pattern, an indication of further upside.
If WTI rises past the day’s high of $103.86, expect a test of the $104.00 mark. Once surpassed, the next area of interest would be the April 30 high at $107.35, followed by $108.00.
On the flipside, oil could aim lower if traders drive prices below the $100.00 milestone. If cleared, the next area of interest would be the 50-day SMA at $89.65.
WTI Oil FAQs
WTI Oil is a type of Crude Oil sold on international markets. The WTI stands for West Texas Intermediate, one of three major types including Brent and Dubai Crude. WTI is also referred to as “light” and “sweet” because of its relatively low gravity and sulfur content respectively. It is considered a high quality Oil that is easily refined. It is sourced in the United States and distributed via the Cushing hub, which is considered “The Pipeline Crossroads of the World”. It is a benchmark for the Oil market and WTI price is frequently quoted in the media.
Like all assets, supply and demand are the key drivers of WTI Oil price. As such, global growth can be a driver of increased demand and vice versa for weak global growth. Political instability, wars, and sanctions can disrupt supply and impact prices. The decisions of OPEC, a group of major Oil-producing countries, is another key driver of price. The value of the US Dollar influences the price of WTI Crude Oil, since Oil is predominantly traded in US Dollars, thus a weaker US Dollar can make Oil more affordable and vice versa.
The weekly Oil inventory reports published by the American Petroleum Institute (API) and the Energy Information Agency (EIA) impact the price of WTI Oil. Changes in inventories reflect fluctuating supply and demand. If the data shows a drop in inventories it can indicate increased demand, pushing up Oil price. Higher inventories can reflect increased supply, pushing down prices. API’s report is published every Tuesday and EIA’s the day after. Their results are usually similar, falling within 1% of each other 75% of the time. The EIA data is considered more reliable, since it is a government agency.
OPEC (Organization of the Petroleum Exporting Countries) is a group of 12 Oil-producing nations who collectively decide production quotas for member countries at twice-yearly meetings. Their decisions often impact WTI Oil prices. When OPEC decides to lower quotas, it can tighten supply, pushing up Oil prices. When OPEC increases production, it has the opposite effect. OPEC+ refers to an expanded group that includes ten extra non-OPEC members, the most notable of which is Russia.
추천 기사


