

WTI steadies above $60 amid easing disruption fears and cautious market tone
- WTI edges higher above $60.00 as traders digest easing supply fears after Novorossiysk operations resume.
- Geopolitical risk premium unwinds, but recurring Black Sea strikes keep caution elevated.
- Technical setup remains fragile, with upside capped at $61.00-$61.50 and key support at $59.22 and $58.12.
WTI inches higher on Monday, supported by steady risk sentiment and easing supply concerns after Russia’s Novorossiysk hub resumed shipments following last week’s Ukrainian strike. At the time of writing, WTI trades around $60.00, up roughly 0.50% after recovering from an intraday trough near $59.22.
The swift restoration of operations has helped unwind part of the geopolitical risk premium, though traders remain cautious given the recurring strikes on Black Sea energy infrastructure.
Meanwhile, the market is also waiting for a wave of United States (US) economic data that was delayed by the government shutdown, with traders looking for fresh clues on the health of the American economy. The US is one of the world’s largest Oil consumers, so any signs of slowing growth or weaker fuel demand can quickly influence Crude prices.
At the same time, the broader outlook is dominated by oversupply concerns stemming from forecasts by major energy institutions. Both the International Energy Agency (IEA) and the US Energy Information Administration (EIA) project that global oil supply growth will continue to outpace demand through 2026.
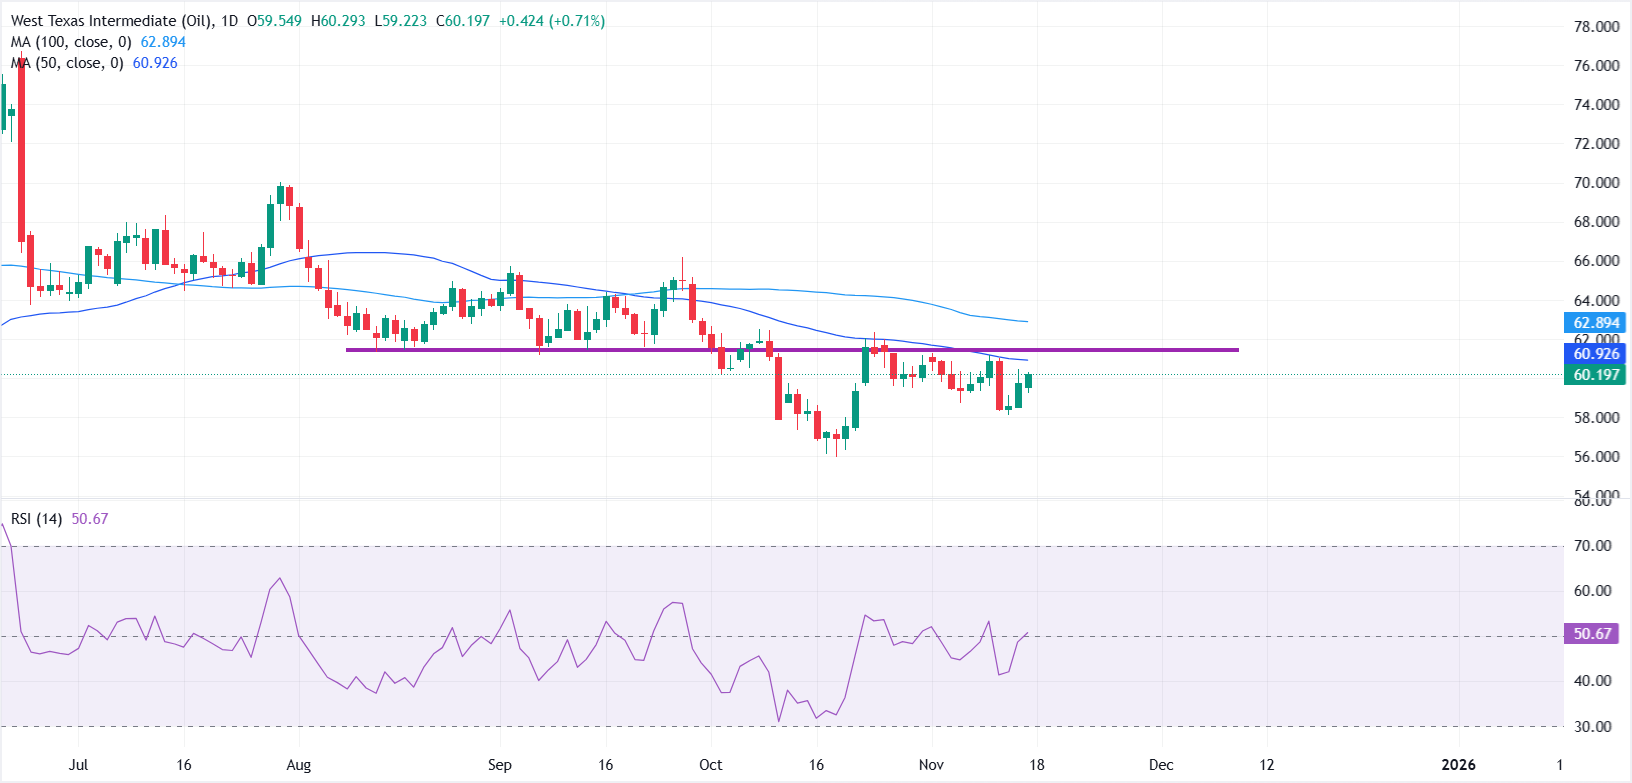
From a technical perspective, WTI continues to trade below a cluster of key resistance levels, keeping the broader bias tilted to the downside. The immediate upside remains capped in the $61.00-$61.50 region, which coincides with the 21-day Simple Moving Average (SMA) and a previous support-turned-resistance zone that has triggered multiple rejections since late October.
A decisive close above the $61.00-$61.50 barrier would be needed to ease the prevailing bearish pressure. Even then, bulls would face another significant obstacle at the 100-day SMA near $62.89.
On the downside, immediate support lies at Monday’s low near $59.22, followed by last week’s low at $58.12. A sustained break below this area could invite fresh selling pressure, exposing the October 22 low near $57.31, followed by the October swing low around $56.00. The Relative Strength Index (RSI) remains neutral but is pointing slightly higher, indicating a mild improvement in near-term momentum.
WTI Oil FAQs
WTI Oil is a type of Crude Oil sold on international markets. The WTI stands for West Texas Intermediate, one of three major types including Brent and Dubai Crude. WTI is also referred to as “light” and “sweet” because of its relatively low gravity and sulfur content respectively. It is considered a high quality Oil that is easily refined. It is sourced in the United States and distributed via the Cushing hub, which is considered “The Pipeline Crossroads of the World”. It is a benchmark for the Oil market and WTI price is frequently quoted in the media.
Like all assets, supply and demand are the key drivers of WTI Oil price. As such, global growth can be a driver of increased demand and vice versa for weak global growth. Political instability, wars, and sanctions can disrupt supply and impact prices. The decisions of OPEC, a group of major Oil-producing countries, is another key driver of price. The value of the US Dollar influences the price of WTI Crude Oil, since Oil is predominantly traded in US Dollars, thus a weaker US Dollar can make Oil more affordable and vice versa.
The weekly Oil inventory reports published by the American Petroleum Institute (API) and the Energy Information Agency (EIA) impact the price of WTI Oil. Changes in inventories reflect fluctuating supply and demand. If the data shows a drop in inventories it can indicate increased demand, pushing up Oil price. Higher inventories can reflect increased supply, pushing down prices. API’s report is published every Tuesday and EIA’s the day after. Their results are usually similar, falling within 1% of each other 75% of the time. The EIA data is considered more reliable, since it is a government agency.
OPEC (Organization of the Petroleum Exporting Countries) is a group of 12 Oil-producing nations who collectively decide production quotas for member countries at twice-yearly meetings. Their decisions often impact WTI Oil prices. When OPEC decides to lower quotas, it can tighten supply, pushing up Oil prices. When OPEC increases production, it has the opposite effect. OPEC+ refers to an expanded group that includes ten extra non-OPEC members, the most notable of which is Russia.
추천 기사


