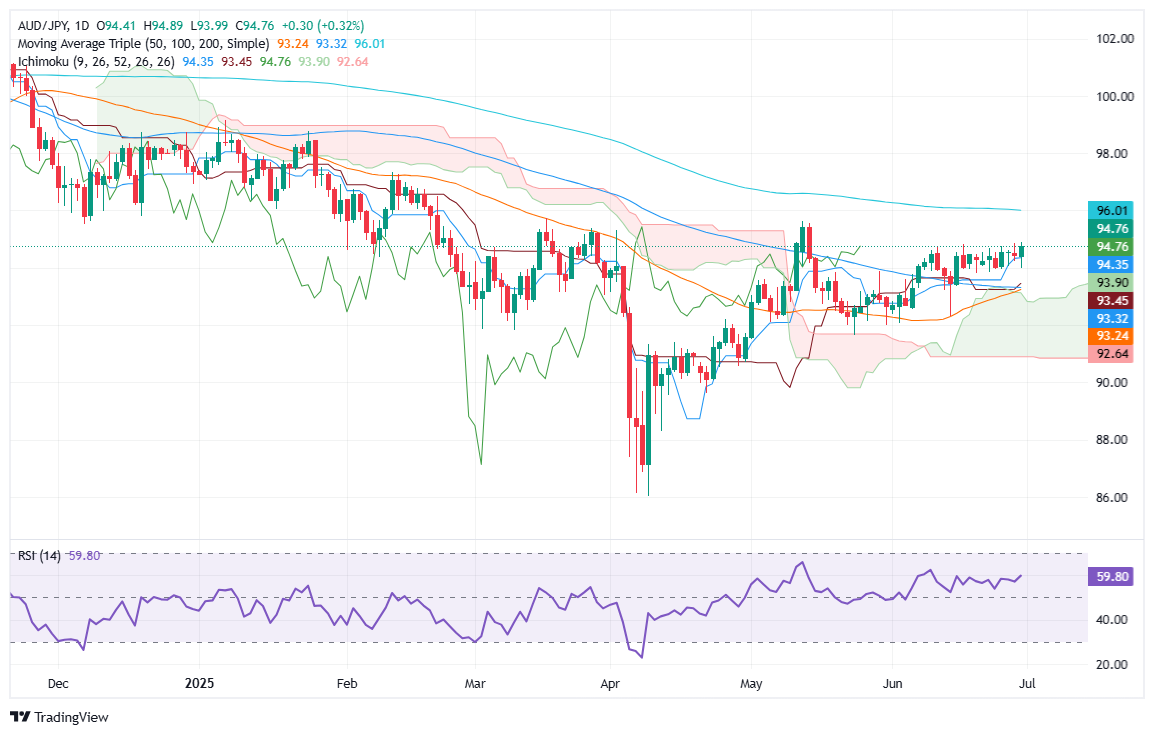
AUD/JPY holds steady near 94.65 as buyers defend key support zone
- AUD/JPY trades flat at 94.65; strong dip-buying support seen near 93.70–94.00 area.
- RSI signals bullish momentum; higher lows point to possible breakout above 95.00.
- Break below 93.98 risks drop to 93.50/75 trendline, then 93.00 support.
The AUD/JPY has continued to consolidate within the 93.70–95.00 range over the past ten trading days, amid a fragile market mood driven by controversial US policies, the escalation and de-escalation of the Middle East conflict, and the approval of the US fiscal budget. This, and the Bank of Japan's (BoJ) reluctance to hike rates, has kept the cross-pair trading around familiar levels. The pair trades at 94.65, virtually unchanged.
AUD/JPY Price Forecast: Technical Outlook
The AUD/JPY has found strong support near the 93.70 – 94.00 figure, with buyers buying the dip, as the market mood shows signs of improvement. Although the Reserve Bank of Australia (RBA) is set to slash rates by 80 bps according to Interest Rate Probabilities (IRP), if the BoJ remains neutral, further upside is seen on the pair.
From a technical perspective, the AUD/JPY appears poised to test higher prices in the short term. The Relative Strength Index (RSI) is bullish, while price action posting a series of higher lows, despite lacking higher highs, could pave the way for challenging the 95.00 figure. A breach of the latter will expose the April 2 high of 95.30, followed by the May 13 swing high of 95.64. Further gains lie above 96.00, with buyers targeting the YTD high of 99.15.
Conversely, a reversal that drives AUD/JPY below the June 30 swing low of 93.98 could sponsor a drop to challenge a seventh month-old support trendline near 93.50/75. If cleared, down lies 93.00.
AUD/JPY Price Chart – Daily

Australian Dollar PRICE This month
The table below shows the percentage change of Australian Dollar (AUD) against listed major currencies this month. Australian Dollar was the strongest against the US Dollar.
| USD | EUR | GBP | JPY | CAD | AUD | NZD | CHF | |
|---|---|---|---|---|---|---|---|---|
| USD | -3.51% | -1.77% | -0.09% | -1.45% | -2.04% | -2.19% | -3.64% | |
| EUR | 3.51% | 1.82% | 3.50% | 2.16% | 1.55% | 1.69% | -0.16% | |
| GBP | 1.77% | -1.82% | 1.66% | 0.31% | -0.25% | -0.29% | -1.92% | |
| JPY | 0.09% | -3.50% | -1.66% | -1.35% | -1.87% | -1.95% | -3.49% | |
| CAD | 1.45% | -2.16% | -0.31% | 1.35% | -0.52% | -0.62% | -2.22% | |
| AUD | 2.04% | -1.55% | 0.25% | 1.87% | 0.52% | 0.14% | -1.66% | |
| NZD | 2.19% | -1.69% | 0.29% | 1.95% | 0.62% | -0.14% | -1.80% | |
| CHF | 3.64% | 0.16% | 1.92% | 3.49% | 2.22% | 1.66% | 1.80% |
The heat map shows percentage changes of major currencies against each other. The base currency is picked from the left column, while the quote currency is picked from the top row. For example, if you pick the Australian Dollar from the left column and move along the horizontal line to the US Dollar, the percentage change displayed in the box will represent AUD (base)/USD (quote).


