
Indian Rupee weakens amid Middle East tensions, Crude Oil price surge
- Indian Rupee extends losing streak for the third consecutive day, hits weakest level since mid-March against the US Dollar.
- Israel–Iran conflict enters seventh day, US reportedly prepared for possible military strike.
- Brent and WTI crude are up over 20% this month, supply fears keep prices elevated.
The Indian Rupee (INR) extends its losing streak for a third consecutive day against the US Dollar (USD) on Wednesday, sliding to a three-month low as the escalating Middle East conflict fuels fresh supply worries and keeps Crude Oil prices elevated. Higher Oil costs continue to strain India’s import bill, adding persistent pressure on the Rupee.
The USD/INR pair is trading higher at around ₹86.71, slightly off its intraday peak of ₹86.89 seen during European trading hours. Meanwhile, the US Dollar Index (DXY), which tracks the Greenback’s value against six major currencies, holds steady near 98.95 after the Federal Reserve (Fed) left interest rates unchanged on Wednesday, reinforcing broad US Dollar resilience amid an already uncertain global outlook. Trading volumes remain thin as United States (US) financial markets stay closed on Thursday for the Juneteenth holiday, limiting price action until liquidity returns on Friday.
As the Iran–Israel conflict enters its seventh day, both nations have continued heavy strikes — Israel targeting Iran’s nuclear and military installations, and Iran responding with waves of ballistic missiles and drones toward Israeli territory, including civilian hospitals. The US has reinforced its regional posture by deploying additional naval vessels and aircraft assets to serve as a deterrent amid rising tensions. US President Donald Trump has publicly backed Israel’s campaign, praising its strikes as “excellent” and warning Iran of “even more brutal” action if it fails to capitulate on its nuclear ambitions. Trump remains non-committal about direct US military involvement, saying, “I may do it. I may not do it. I mean, nobody knows what I'm going to do.”
Market Movers: INR at three-month low, Oil surges on supply fears, Fed holds rates
- The Indian Rupee falls to its lowest level since mid-March against the US Dollar on Thursday as heightened risk aversion gripped financial markets, with traders bracing for the possibility of direct US involvement in the Israel–Iran conflict.
- Fresh reports intensified market jitters late Wednesday, with The Wall Street Journal revealing that US President Donald Trump had given private approval for potential military action against Iran but paused the final directive to gauge Tehran’s willingness to halt its nuclear efforts. In parallel, Bloomberg reported that US defense officials are actively preparing for a possible strike on Iranian targets in the near term. This rising threat of broader conflict has boosted Crude Oil prices.
- The lawyer-politician-activist Prakash Ambedkar stated that whenever Oil prices rise, Indian refiners are compelled to purchase more US dollars to cover their imports, thereby increasing US Dollar demand and weakening the Rupee, which in turn makes fuel even costlier in local currency terms. He cautioned that this repeating cycle can widen the current account deficit and strain the country’s finances. Ambedkar also warned that the Israel–Iran conflict is likely to ripple through prices and supply chains in sectors closely linked to crude Oil. To ease the burden, Ambedkar urged the government to temporarily cap fuel prices by tweaking excise duties or offering targeted subsidies, and called on the Reserve Bank of India (RBI) to intervene in the forex market to limit excessive Rupee volatility.
- The Iran–Israel conflict has driven a sharp rally in Oil prices, with Brent crude futures last trading near $76 per barrel, marking a gain of over 20% so far this month. West Texas Intermediate (WTI) is holding around $74 at the time of writing, up roughly 22% month-to-date. Escalating hostilities and fears of potential US involvement have stoked fresh supply concerns, keeping both benchmarks well bid despite subdued holiday trading in the US.
- Oil makes up a significant portion of India’s total imports, and economists estimate that every $10 per barrel rise in crude prices can expand the country’s current account deficit by as much as 0.4% of GDP.
- The Fed kept its benchmark interest rate unchanged at the 4.25%–4.50% range on Wednesday, sticking to a cautious approach as officials balance moderate economic growth with persistent inflation risks. Policymakers hinted at the possibility of two rate cuts before the end of the year but stressed that any adjustment would depend on how inflation and broader economic data evolve in the coming months.
- Fed Chair Jerome Powell emphasised caution on Wednesday, warning that the Fed’s economic projections are far from ironclad. Powell urged markets not to over-rely on the “dot-plot,” noting that all future rate decisions will remain data-dependent. He framed the messaging as “no one holds these rate paths with a great deal of conviction,” underlining the central bank’s adaptive stance.
USD/INR Technical Outlook: Strong triangle breakout fuels bullish momentum
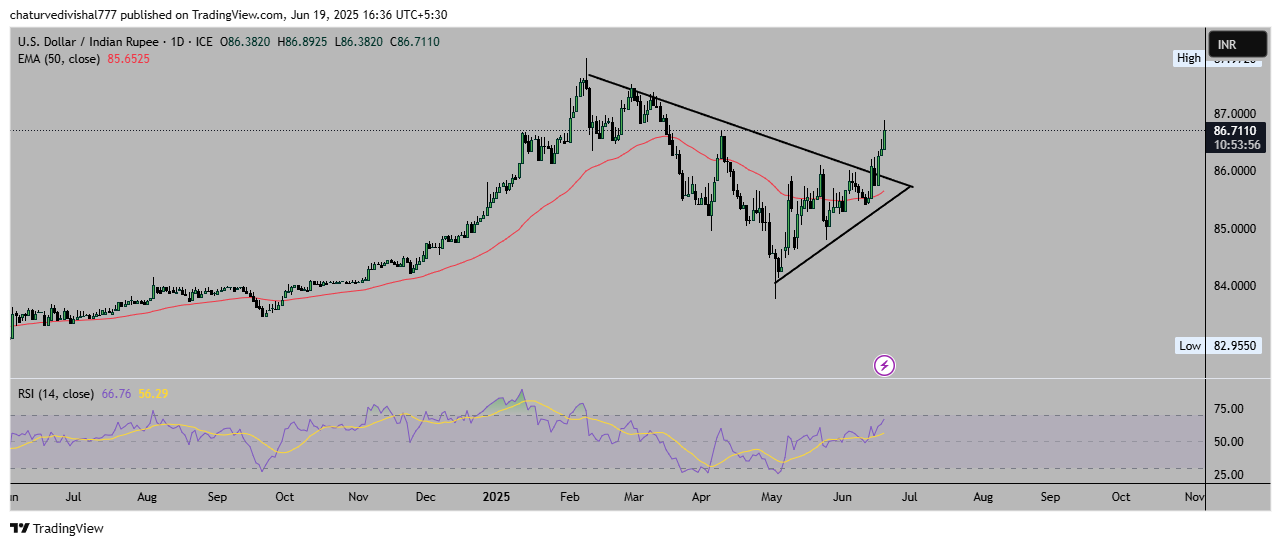
The USD/INR pair has staged a strong breakout from a multi-month symmetrical triangle pattern on the daily chart, printing consecutive bullish candles that signal renewed upward momentum. Price action remains comfortably above the breakout zone, with the 50-day Exponential Moving Average (EMA) near 85.65 now acting as dynamic support if any profit-taking emerges.
The daily Relative Strength Index (RSI) is holding around 66, indicating healthy bullish momentum with room to test overbought levels before any pullback. If the pair maintains this bullish structure, a clear push above the 87.00 round number could pave the way toward the next resistance at 87.50–88.00. On the downside, dips back toward 86.00–86.20 may attract fresh buying interest, keeping the broader uptrend intact.
Indian Rupee PRICE Today
The table below shows the percentage change of Indian Rupee (INR) against listed major currencies today. Indian Rupee was the strongest against the New Zealand Dollar.
| USD | EUR | GBP | JPY | CAD | AUD | NZD | INR | |
|---|---|---|---|---|---|---|---|---|
| USD | 0.04% | 0.07% | 0.36% | 0.17% | 0.80% | 0.96% | 0.29% | |
| EUR | -0.04% | 0.02% | 0.30% | 0.07% | 0.68% | 0.87% | 0.35% | |
| GBP | -0.07% | -0.02% | 0.29% | 0.05% | 0.66% | 0.94% | 0.22% | |
| JPY | -0.36% | -0.30% | -0.29% | -0.22% | 0.29% | 0.52% | -0.03% | |
| CAD | -0.17% | -0.07% | -0.05% | 0.22% | 0.53% | 0.81% | 0.25% | |
| AUD | -0.80% | -0.68% | -0.66% | -0.29% | -0.53% | 0.33% | -0.37% | |
| NZD | -0.96% | -0.87% | -0.94% | -0.52% | -0.81% | -0.33% | -0.80% | |
| INR | -0.29% | -0.35% | -0.22% | 0.03% | -0.25% | 0.37% | 0.80% |
The heat map shows percentage changes of major currencies against each other. The base currency is picked from the left column, while the quote currency is picked from the top row. For example, if you pick the Indian Rupee from the left column and move along the horizontal line to the US Dollar, the percentage change displayed in the box will represent INR (base)/USD (quote).
추천 기사


