
NZD/USD Price Forecast: Hovers around 0.5950, confines within a consolidation rectangle
- NZD/USD could target the upper edge of its consolidation range around 0.6000.
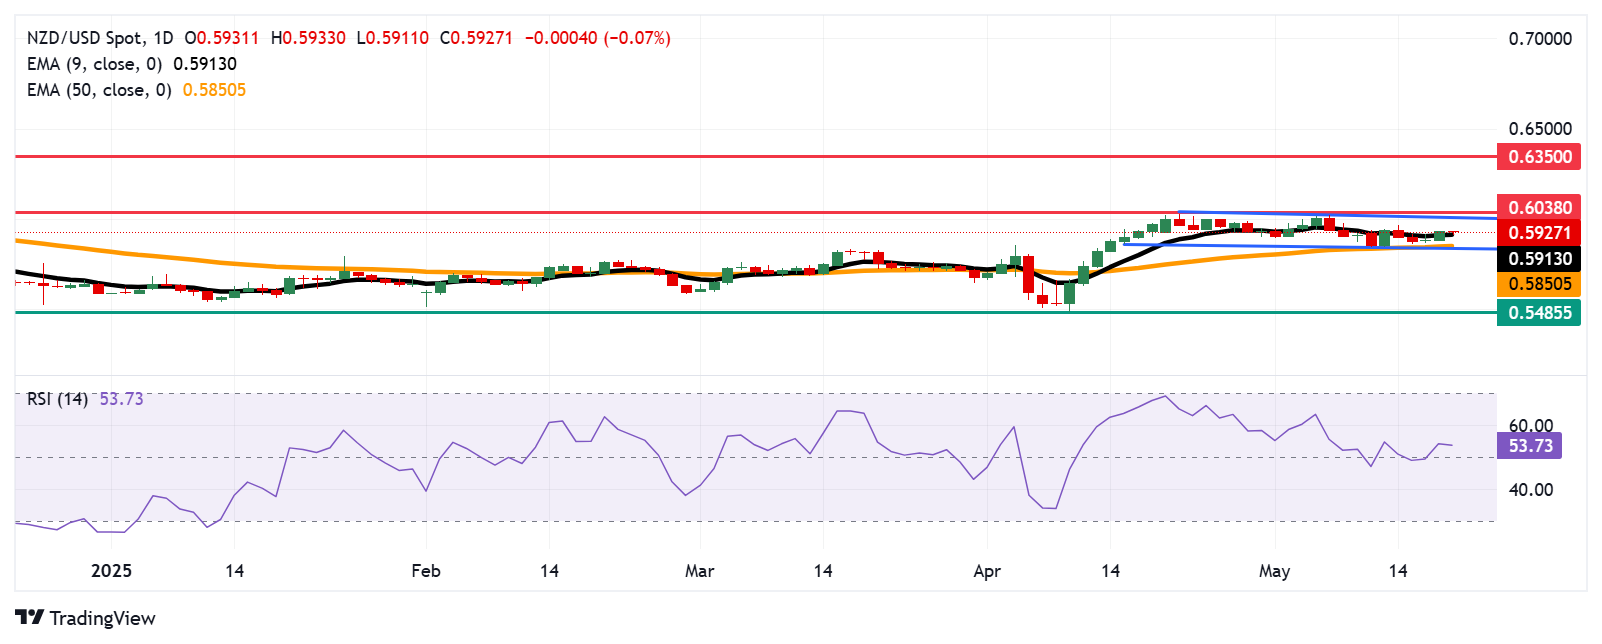
- The 14-day Relative Strength Index (RSI) remains slightly above the 50 level, indicating a mild bullish bias.
- The initial support is seen near the nine-day Exponential Moving Average (EMA) at 0.5913.
The NZD/USD pair halts its two-day winning streak, trading around 0.5930 during the European hours on Tuesday. Daily chart technicals suggest a neutral outlook, with the pair remaining confined within a consolidation rectangle.
The 14-day Relative Strength Index (RSI) hovers just above the 50 mark, suggesting a slight bullish inclination. Meanwhile, the NZD/USD pair trades near the nine-day Exponential Moving Average (EMA), indicating neutral short-term momentum.
The NZD/USD pair may aim for the upper boundary of the consolidation range near 0.6000, with the next target at the six-month high of 0.6038, last reached in November 2024. A decisive break above this key resistance zone could pave the way for a move toward the seven-month high around 0.6350, marked in October 2024.
On the downside, initial support for the NZD/USD pair lies around the nine-day EMA at 0.5913. A break below this level would signal weakening short-term momentum, potentially driving the pair toward the 50-day EMA at 0.5850, which aligns with the rectangle’s lower boundary. A sustained move beneath this critical support zone could further erode medium-term momentum, opening the door for a deeper decline toward 0.5485 — a level not seen since March 2020.
NZD/USD: Daily Chart
New Zealand Dollar PRICE Today
The table below shows the percentage change of New Zealand Dollar (NZD) against listed major currencies today. New Zealand Dollar was the weakest against the Japanese Yen.
| USD | EUR | GBP | JPY | CAD | AUD | NZD | CHF | |
|---|---|---|---|---|---|---|---|---|
| USD | -0.28% | -0.23% | -0.50% | -0.10% | 0.55% | 0.06% | -0.45% | |
| EUR | 0.28% | 0.06% | -0.21% | 0.19% | 0.83% | 0.35% | -0.17% | |
| GBP | 0.23% | -0.06% | -0.29% | 0.12% | 0.75% | 0.32% | -0.19% | |
| JPY | 0.50% | 0.21% | 0.29% | 0.41% | 1.06% | 0.56% | 0.11% | |
| CAD | 0.10% | -0.19% | -0.12% | -0.41% | 0.65% | 0.16% | -0.32% | |
| AUD | -0.55% | -0.83% | -0.75% | -1.06% | -0.65% | -0.48% | -0.97% | |
| NZD | -0.06% | -0.35% | -0.32% | -0.56% | -0.16% | 0.48% | -0.48% | |
| CHF | 0.45% | 0.17% | 0.19% | -0.11% | 0.32% | 0.97% | 0.48% |
The heat map shows percentage changes of major currencies against each other. The base currency is picked from the left column, while the quote currency is picked from the top row. For example, if you pick the New Zealand Dollar from the left column and move along the horizontal line to the US Dollar, the percentage change displayed in the box will represent NZD (base)/USD (quote).
추천 기사


