


GBP/JPY afloat near 189.00 amid risk jitters, bearish bias prevails
- GBP/JPY holds near the 189.00 zone but upside remains limited
- Market sentiment rattled by Fed uncertainty and weak UK inflation outlook
- Technical picture tilts bearish with key resistance at 188.93 and 189.72
GBP/JPY trades modestly higher near 189.00 during Tuesday’s session after bouncing from intraday lows around 187.47. The pair’s upside follows a minor recovery in the Pound Sterling, which briefly reached 1.3423 against the US Dollar before retreating amid political and economic crosswinds. President Trump’s latest remarks targeting Fed Chair Powell and renewed speculation around the Fed’s independence continue to weigh on risk sentiment and cast a shadow over the broader USD outlook.
Meanwhile, the Japanese Yen remains well supported by safe-haven flows and expectations that the Bank of Japan (BoJ) will continue tightening policy. This dynamic keeps JPY resilient across G10 crosses. The British Pound, while still outperforming many peers, shows signs of exhaustion following a strong rally, as traders begin to price in possible rate cuts by the Bank of England (BoE) due to weak inflation and labor market trends.
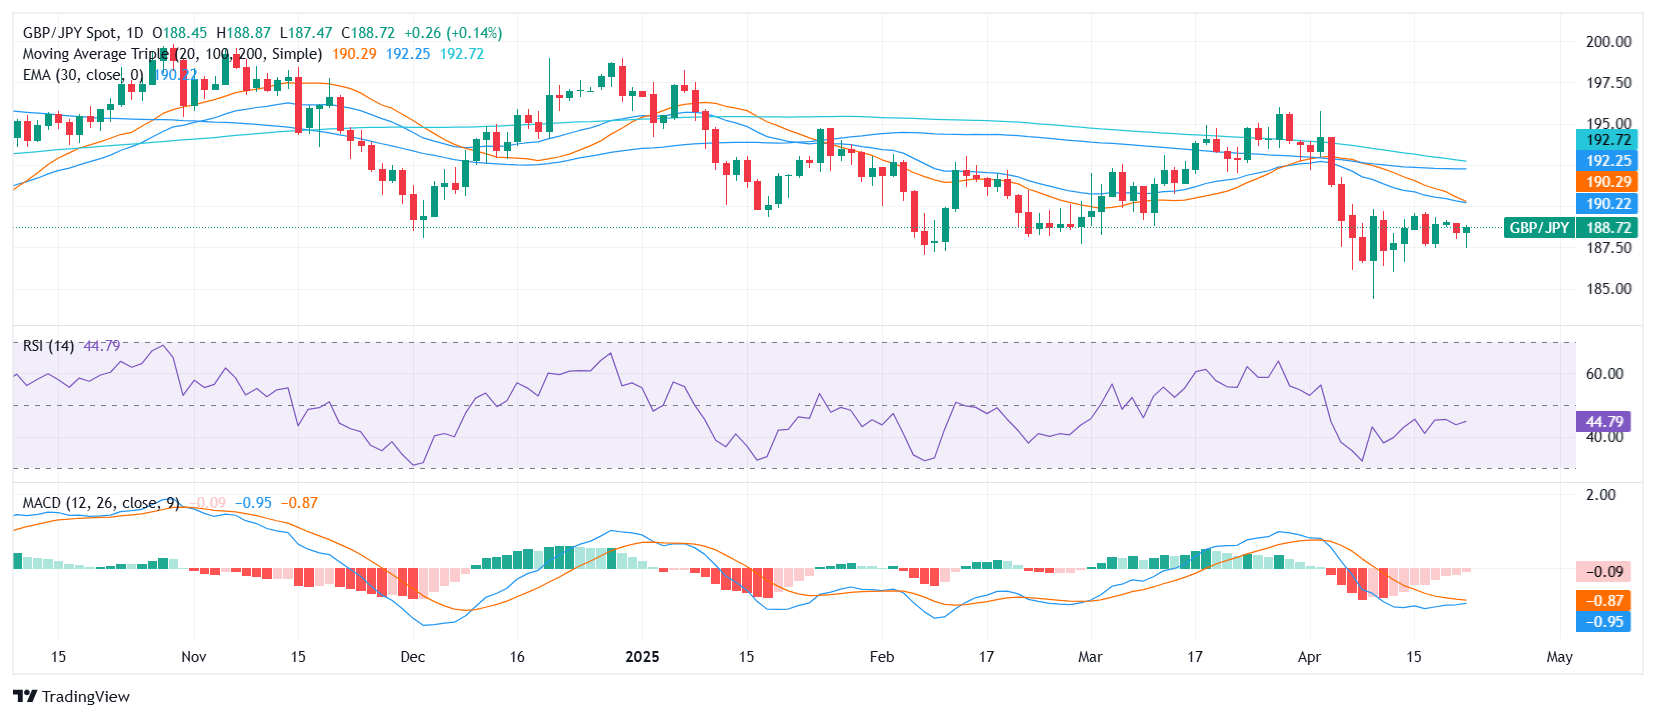
From a technical perspective, GBP/JPY flashes a bearish signal despite today’s modest gains. The pair trades near the top of its daily range (187.47–188.83), but the MACD and Awesome Oscillator both support selling pressure. The Relative Strength Index (RSI) remains neutral at 44.74, while moving averages paint a clearly bearish backdrop. The 20-day (190.32), 100-day (192.15), and 200-day (192.84) Simple Moving Averages all slope lower, joined by bearish confirmation from the 10-day EMA (188.94) and 30-day EMA (190.25). Resistance is found at 188.81, 188.94, and 189.73, while support lies at 188.57.
The overall trend leans negative unless a sustained break above 189.70 materializes. For now, GBP/JPY remains vulnerable to deeper pullbacks amid political risk and technical headwinds.
GBP/JPY Daily chart
추천 기사


