


USD/CHF Price Forecast: RSI and MACD signal firm upside momentum
- USD/CHF advances for a fifth straight day as Fed rate hike expectations support the US Dollar.
- Bullish momentum strengthens as the pair holds above the 50-day, 100-day and 200-day SMAs.
- A decisive break above 0.8200 would bring the 0.8350 resistance level into focus.
USD/CHF extends its advance for a fifth consecutive day on Tuesday as the US Dollar (USD) stays firmly bid ahead of the Federal Reserve’s (Fed) monetary policy announcement on Wednesday. At the time of writing, the pair trades around 0.8191, near levels last seen on July 29.
The US Dollar Index (DXY), which tracks the Greenback’s value against a basket of six major currencies, trades around 99.60, up 0.11% on the day and close to a two-week high.
Markets are almost fully pricing in a 25-basis-point (bps) rate hike, which would be the central bank’s first increase since 2023. Elevated Oil prices linked to the war in the Middle East are adding to inflationary pressures, lifting US Treasury yields and strengthening expectations that borrowing costs will remain elevated for longer.
Against this backdrop, the Swiss Franc (CHF) remains vulnerable to additional losses. The currency was among the worst performers last quarter as Switzerland’s low-inflation environment allowed the Swiss National Bank (SNB) to keep its policy rate at 0%.
The wide interest rate differential encourages investors to use the Swiss Franc as a funding currency, driving flows toward higher-yielding currencies such as the US Dollar and keeping USD/CHF supported.
Technical analysis
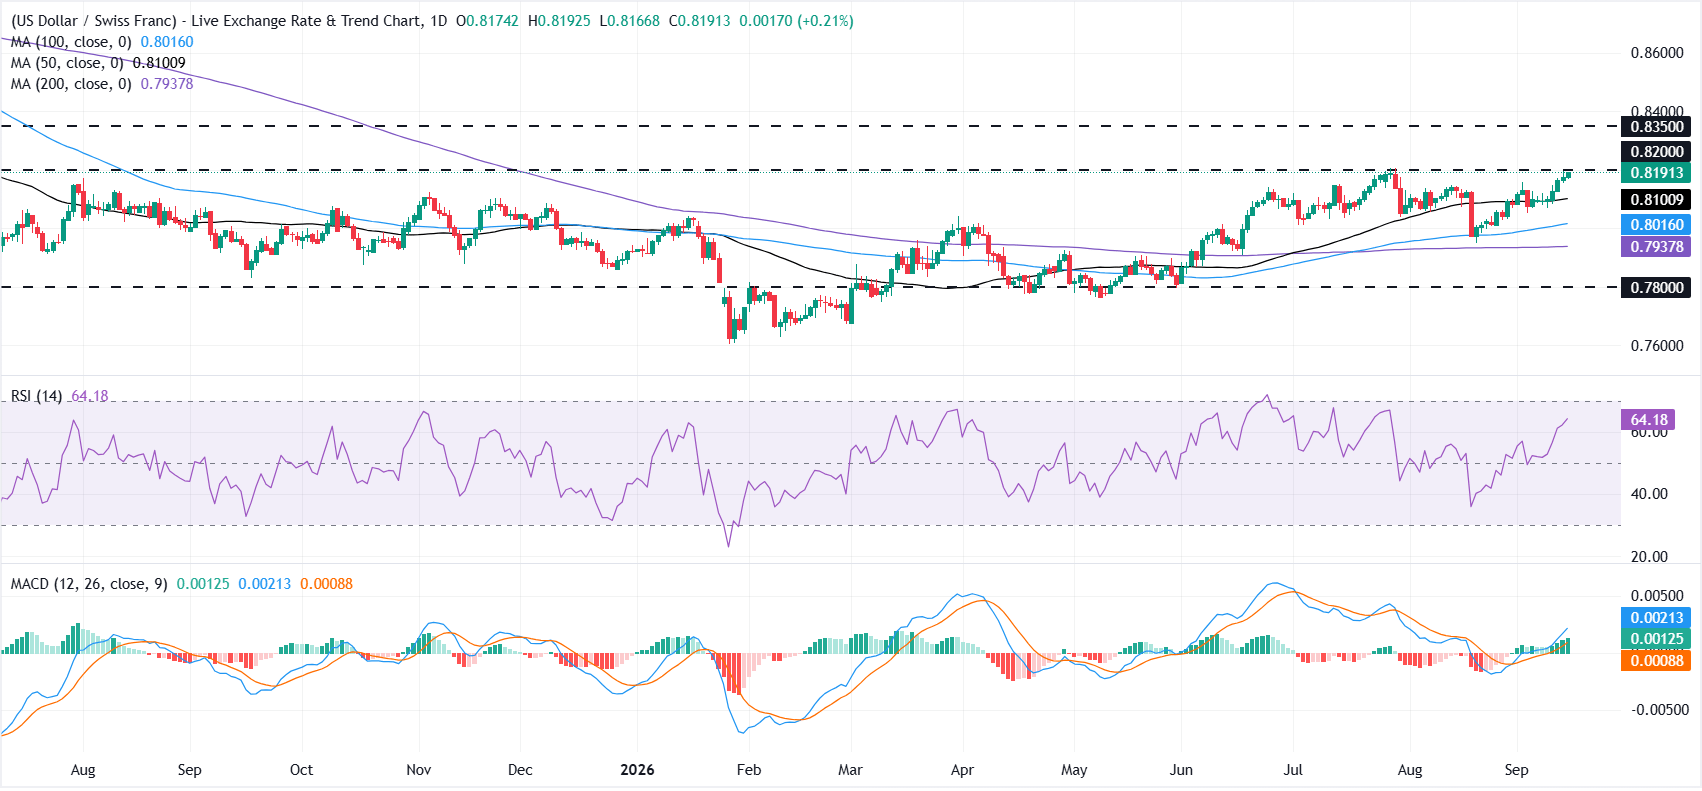
On the daily chart, USD/CHF maintains a constructive bullish bias as it holds above the 50-day, 100-day and 200-day Simple Moving Averages (SMAs) clustered between roughly 0.81 and 0.79.
The Relative Strength Index (RSI) at about 64 and a positive, rising Moving Average Convergence Divergence (MACD) line both suggest firming upside momentum, though the pair is edging toward nearby resistance and could face some consolidation if gains stall.
On the topside, initial resistance is the horizontal cap at 0.8200, with a subsequent barrier at 0.8350 that would need to give way to extend the recovery.
On the downside, immediate support is provided by the 50-day SMA near 0.8101, followed by the 100-day SMA around 0.8016 and the 200-day SMA near 0.7938, while a deeper slide would look to the prior horizontal floor at 0.7800 to contain any corrective pullback.
(The technical analysis of this story was written with the help of an AI tool. Know more.)
추천 기사


