

Indian Rupee declines ahead of HSBC PMI data
- USD/INR appreciates ahead of India’s HSBC Composite and Services Purchasing Managers' Index data release.
- Modi’s BJP won a third term in Assam and captured opposition stronghold West Bengal in a key election.
- India’s forex reserves fell from $728.5 billion, while equity outflows hit $19 billion in March and April.
USD/INR extends gains for the third successive day, trading around 95.40 during the Asian hours on Tuesday. Traders await India’s HSBC Composite and Services Purchasing Managers' Index (PMI) data to be released later in the day.
On Monday, HSBC Manufacturing Purchasing Managers' Index (PMI) in India came in at 54.7 for April, revised down from the preliminary 55.9 but higher than 53.9 in the prior month. Both output and new orders continued to expand, though growth remained subdued relative to levels seen over the past three and a half years.
Indian Prime Minister Narendra Modi’s Bharatiya Janata Party (BJP) clinched a third straight term in Assam and captured opposition stronghold West Bengal in a key election.
Indian equities opened lower on Tuesday, as an overnight surge in crude oil prices dampened investor sentiment. Oil prices, however, have since declined as concerns over immediate supply disruptions eased, with the United States (US) Navy taking steps to reopen the crucial Strait of Hormuz after Iran attempted to close it.
The US launched a fresh operation on Monday to restore shipping through the Strait of Hormuz, and Maersk later confirmed that its Alliance Fairfax, a US-flagged vehicle carrier, exited the strait under US military escort.
Foreign institutional investors (FII) turned net buyers of Indian equities on Monday after nine consecutive days of selling, with inflows totaling 28.36 billion rupees ($298 million). Domestic institutional investors (DII) bought local shares worth 47.64 billion rupees, marking their seventh straight session of purchases, per Reuters.
Stock-specific moves linked to earnings are also expected to remain in focus. Nifty 50 constituents Larsen & Toubro, Mahindra and Mahindra, and Hero MotoCorp are scheduled to announce their quarterly results later in the day.
India’s foreign exchange reserves have declined from a peak of $728.5 billion, while equity outflows reached $19 billion across March and April. Nevertheless, the Reserve Bank of India (RBI) has stated that it remains comfortable with reserve levels sufficient to cover 11 months of imports, though recent policy discussions highlight renewed urgency to strengthen buffers amid ongoing capital outflows.
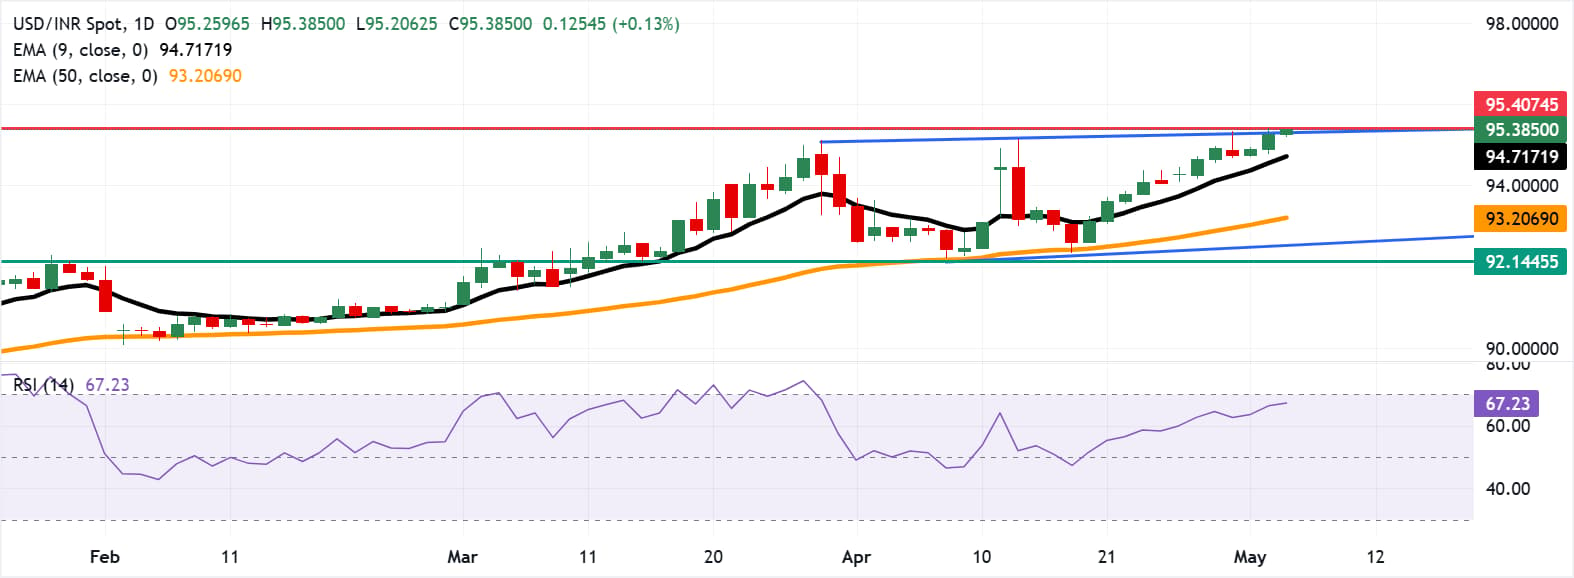
Technical Analysis: USD/INR nears rectangular channel top, all-time highs near 95.50
USD/INR trades around 95.40 at the time of writing on Tuesday. The technical analysis of the daily chart indicates a potential for a bullish emergence as the pair is testing the upper boundary of the rectangular channel.
However, the USD/INR pair retains a bullish near-term bias as price holds above the nine-day and 50-day Exponential Moving Averages (EMAs). The 14-day Relative Strength Index (RSI) at 66.7 points to firm positive momentum edging toward overbought territory, suggesting upside pressure persists while leaving the pair vulnerable to bouts of consolidation if buyers lose traction.
The USD/INR pair is testing the upper boundary of the rectangle, followed by the all-time high of 95.40, which was recorded on May 4. On the downside, the initial support lies at the nine-day EMA of 94.71. A break below the short-term average would lead the pair to test the 50-day EMA at 93.20, followed by the lower rectangle boundary around 92.50 and a seven-week low of 92.14.
US Dollar Price Today
The table below shows the percentage change of US Dollar (USD) against listed major currencies today. US Dollar was the strongest against the Australian Dollar.
| USD | EUR | GBP | JPY | CAD | AUD | NZD | INR | |
|---|---|---|---|---|---|---|---|---|
| USD | 0.04% | 0.06% | 0.00% | -0.02% | 0.16% | 0.10% | 0.14% | |
| EUR | -0.04% | 0.00% | -0.02% | -0.03% | 0.12% | 0.06% | 0.25% | |
| GBP | -0.06% | -0.00% | -0.04% | -0.08% | 0.10% | 0.07% | 0.09% | |
| JPY | 0.00% | 0.02% | 0.04% | -0.01% | 0.15% | 0.11% | 0.30% | |
| CAD | 0.02% | 0.03% | 0.08% | 0.00% | 0.16% | 0.11% | 0.32% | |
| AUD | -0.16% | -0.12% | -0.10% | -0.15% | -0.16% | -0.04% | 0.15% | |
| NZD | -0.10% | -0.06% | -0.07% | -0.11% | -0.11% | 0.04% | -0.01% | |
| INR | -0.14% | -0.25% | -0.09% | -0.30% | -0.32% | -0.15% | 0.01% |
The heat map shows percentage changes of major currencies against each other. The base currency is picked from the left column, while the quote currency is picked from the top row. For example, if you pick the US Dollar from the left column and move along the horizontal line to the Japanese Yen, the percentage change displayed in the box will represent USD (base)/JPY (quote).
Indian Rupee FAQs
The Indian Rupee (INR) is one of the most sensitive currencies to external factors. The price of Crude Oil (the country is highly dependent on imported Oil), the value of the US Dollar – most trade is conducted in USD – and the level of foreign investment, are all influential. Direct intervention by the Reserve Bank of India (RBI) in FX markets to keep the exchange rate stable, as well as the level of interest rates set by the RBI, are further major influencing factors on the Rupee.
The Reserve Bank of India (RBI) actively intervenes in forex markets to maintain a stable exchange rate, to help facilitate trade. In addition, the RBI tries to maintain the inflation rate at its 4% target by adjusting interest rates. Higher interest rates usually strengthen the Rupee. This is due to the role of the ‘carry trade’ in which investors borrow in countries with lower interest rates so as to place their money in countries’ offering relatively higher interest rates and profit from the difference.
Macroeconomic factors that influence the value of the Rupee include inflation, interest rates, the economic growth rate (GDP), the balance of trade, and inflows from foreign investment. A higher growth rate can lead to more overseas investment, pushing up demand for the Rupee. A less negative balance of trade will eventually lead to a stronger Rupee. Higher interest rates, especially real rates (interest rates less inflation) are also positive for the Rupee. A risk-on environment can lead to greater inflows of Foreign Direct and Indirect Investment (FDI and FII), which also benefit the Rupee.
Higher inflation, particularly, if it is comparatively higher than India’s peers, is generally negative for the currency as it reflects devaluation through oversupply. Inflation also increases the cost of exports, leading to more Rupees being sold to purchase foreign imports, which is Rupee-negative. At the same time, higher inflation usually leads to the Reserve Bank of India (RBI) raising interest rates and this can be positive for the Rupee, due to increased demand from international investors. The opposite effect is true of lower inflation.
추천 기사


