

EUR/GBP Price Analysis: Euro recovery finds resistance at 0.8700
- EUR/GBP bulls fail at 0.8700, although the pair remains steady above 0.8680.
- UK GDP and Business Investment data provided a moderate support to the Pound on Tuesday.
- Technical indicators suggest that the upswing from 0.8610 lows remains in play.
The Euro (EUR) is pulling back against the British Pound on Tuesday, trimming some gains after rallying by more than 0.5% over the previous two days. The pair has found resistance at the 0.8700 area, but remains steady above previous highs, at 0.8680, which, so far, keeps the immediate positive bias unchanged.
The British Pound has received some support as UK Gross Domestic Product (GDP) figures confirmed that the economy grew at a 0.1% pace in the last three months of 2025, and 1% year-on-year, meeting market¡s expectations.
Furthermore, Business Investment fell below expectations, -2.5% agains the -2.7% market consensus, while housing prices accelerated 0.9% in March, beyond the 0.6% expected and February’s 0.3% reading.
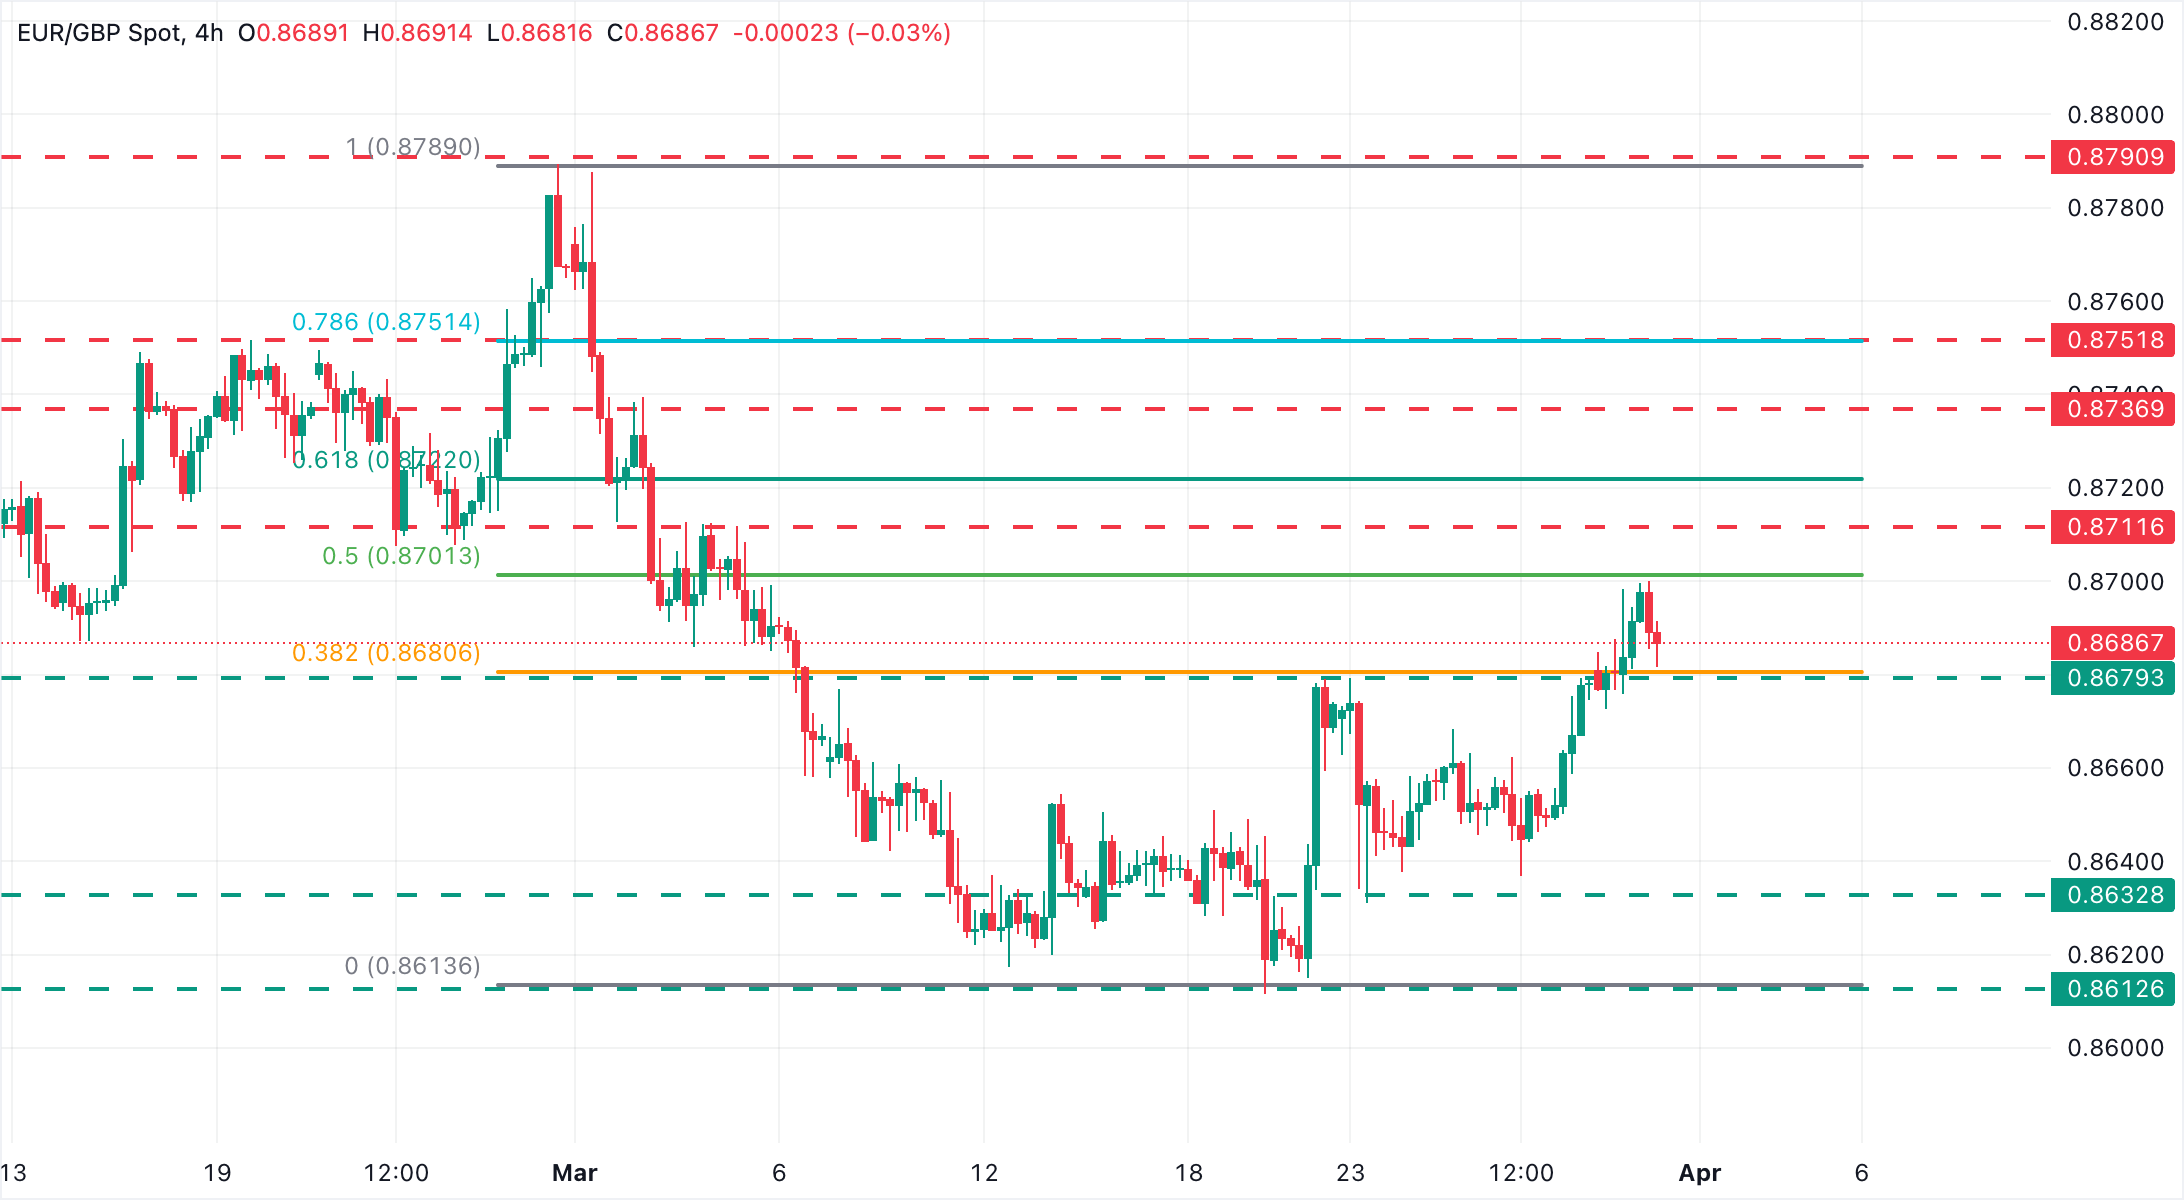
Technical Analysis
EUR/GBP trades at 0.8689 with technical indicators in 4-hour charts showing a mildly bullish near-term bias. The Relative Strength Index (RSI) has retreated from overbought territory but remains above the 50 line, indicating positive momentum that is cooling rather than reversing. The Moving Average Convergence Divergence (MACD) line stands slightly above the signal line and just above the zero mark, which supports an extension of upside pressure while warning that momentum is not aggressive.
Initial resistance is located at the 50% Fibonacci retracement of 0.8703, so far closing the path to the early March highs of 0.8710 and 0.8735 area.
On the downside, the 38.2% Fibonacci retracement and March 20 high, at 0.8680, has now turned support. Further down, the March 23, 24, and 26 lows, in the area of 0.8635, are likely to hold bears ahead of the March 19 and 20 lows, at the mentioned 0.8610 area.
(The technical analysis of this story was written with the help of an AI tool.)
Pound Sterling Price Today
The table below shows the percentage change of British Pound (GBP) against listed major currencies today. British Pound was the strongest against the New Zealand Dollar.
| USD | EUR | GBP | JPY | CAD | AUD | NZD | CHF | |
|---|---|---|---|---|---|---|---|---|
| USD | -0.04% | -0.12% | 0.00% | 0.06% | 0.04% | 0.19% | -0.01% | |
| EUR | 0.04% | -0.06% | 0.07% | 0.14% | 0.11% | 0.25% | 0.06% | |
| GBP | 0.12% | 0.06% | 0.15% | 0.23% | 0.19% | 0.33% | 0.15% | |
| JPY | 0.00% | -0.07% | -0.15% | 0.05% | 0.02% | 0.16% | -0.01% | |
| CAD | -0.06% | -0.14% | -0.23% | -0.05% | -0.03% | 0.11% | -0.07% | |
| AUD | -0.04% | -0.11% | -0.19% | -0.02% | 0.03% | 0.15% | -0.05% | |
| NZD | -0.19% | -0.25% | -0.33% | -0.16% | -0.11% | -0.15% | -0.19% | |
| CHF | 0.01% | -0.06% | -0.15% | 0.01% | 0.07% | 0.05% | 0.19% |
The heat map shows percentage changes of major currencies against each other. The base currency is picked from the left column, while the quote currency is picked from the top row. For example, if you pick the British Pound from the left column and move along the horizontal line to the US Dollar, the percentage change displayed in the box will represent GBP (base)/USD (quote).
추천 기사


