

USD/CAD Price Forecast: Consolidates around 1.3700 as focus shifts to Fed-BoC policy
- USD/CAD wobbles in a limited range around 1.3700 ahead of Fed-BoC policy on Wednesday.
- Both the BoC and the Fed are anticipated to hold interest rates steady.
- Middle East conflicts have boosted inflation expectations across the world.
The USD/CAD pair trades in a tight range around 1.3700 during the European trading session on Tuesday. The Loonie pair consolidates as investors await monetary policy announcements by the Bank of Canada (BoC) and the Federal Reserve (Fed) on Wednesday.
Investors expect both central banks to leave interest rates at their current levels, with a warning that conflicts in the Middle East have prompted inflation risks to the upside.
According to the CME FedWatch tool, the Fed is unlikely to cut interest rates in any meeting before September. Even the odds of an interest rate cut in the September meeting have come down to almost 50% from 73% seen a week ago.
Surging oil prices amid energy supply disruption due to war in the Middle East have prompted gasoline prices in the US and major economies, potentially weighing on households’ purchasing power.
As of writing, the US Dollar Index (DXY), which tracks the Greenback’s value against six major currencies, trades flat slightly below 100.00. The USD Index has surrendered its early gains.
USD/CAD technical analysis
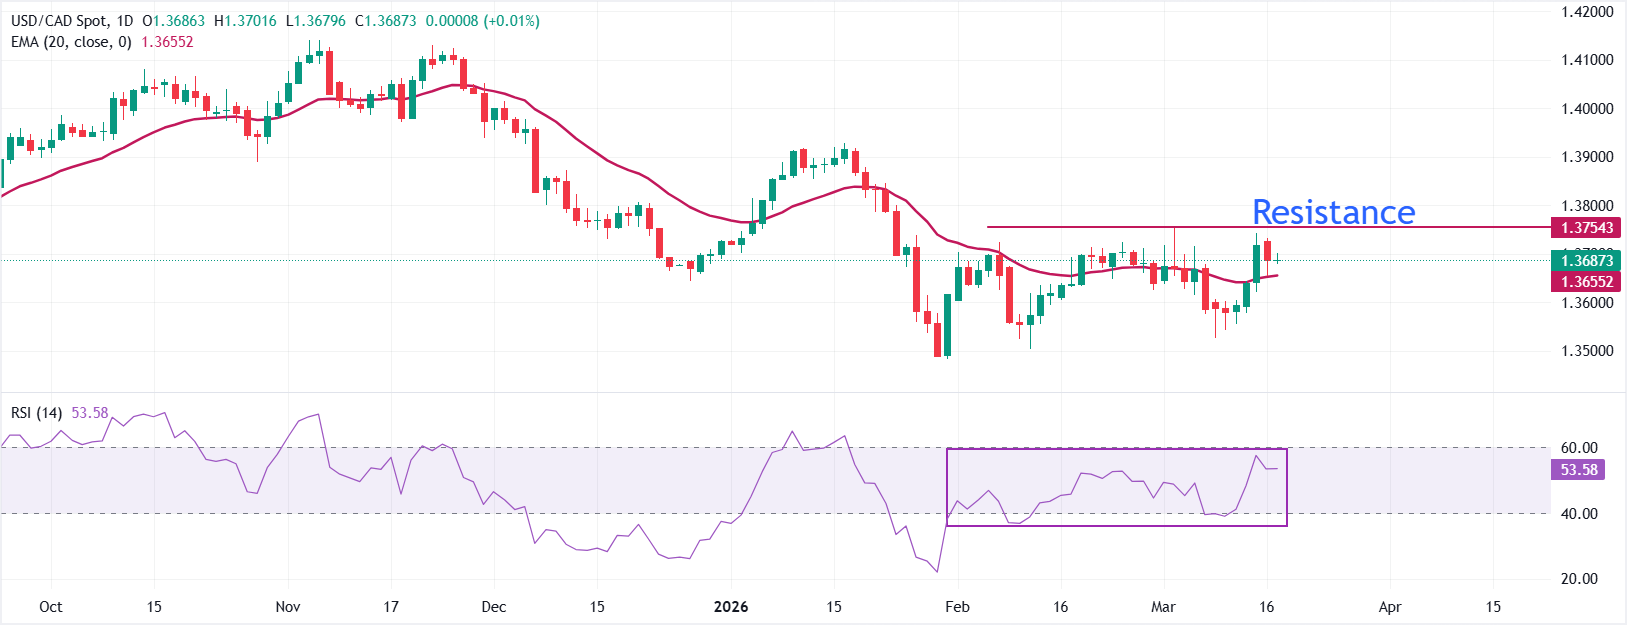
USD/CAD trades almost flat around 1.3700 as of writing. The pair holds a mild bullish bias as price stabilizes above the 20-day Exponential Moving Average (EMA), which has flattened and now tracks just below spot, signaling a recovering short-term trend after last week’s dip.
The 14-day Relative Strength Index (RSI) oscillates inside the 40.00-60.00 zone for over six weeks, indicating a sideways trend.
Initial resistance emerges at 1.3715, where the recent swing high capped advances, followed by the March 3 high of 1.3750 as a more significant hurdle that would open the way toward the 1.3800 area if broken. On the downside, immediate support sits at the 20-day EMA near 1.3655, with a break exposing 1.3615 and then the 1.3580 region, where previous lows converge, and a deeper corrective phase would gain traction.
(The technical analysis of this story was written with the help of an AI tool.)
Fed FAQs
Monetary policy in the US is shaped by the Federal Reserve (Fed). The Fed has two mandates: to achieve price stability and foster full employment. Its primary tool to achieve these goals is by adjusting interest rates. When prices are rising too quickly and inflation is above the Fed’s 2% target, it raises interest rates, increasing borrowing costs throughout the economy. This results in a stronger US Dollar (USD) as it makes the US a more attractive place for international investors to park their money. When inflation falls below 2% or the Unemployment Rate is too high, the Fed may lower interest rates to encourage borrowing, which weighs on the Greenback.
The Federal Reserve (Fed) holds eight policy meetings a year, where the Federal Open Market Committee (FOMC) assesses economic conditions and makes monetary policy decisions. The FOMC is attended by twelve Fed officials – the seven members of the Board of Governors, the president of the Federal Reserve Bank of New York, and four of the remaining eleven regional Reserve Bank presidents, who serve one-year terms on a rotating basis.
In extreme situations, the Federal Reserve may resort to a policy named Quantitative Easing (QE). QE is the process by which the Fed substantially increases the flow of credit in a stuck financial system. It is a non-standard policy measure used during crises or when inflation is extremely low. It was the Fed’s weapon of choice during the Great Financial Crisis in 2008. It involves the Fed printing more Dollars and using them to buy high grade bonds from financial institutions. QE usually weakens the US Dollar.
Quantitative tightening (QT) is the reverse process of QE, whereby the Federal Reserve stops buying bonds from financial institutions and does not reinvest the principal from the bonds it holds maturing, to purchase new bonds. It is usually positive for the value of the US Dollar.
추천 기사


