

Indian Rupee remains under pressure as USD/INR nears record highs
- USD/INR rebounds toward the all-time high of 92.81.
- Indian Rupee gained support as Middle East tensions eased after Trump said the Iran war could end “very soon.”
- The US Dollar rises as risk-off trade remains underpinned amid war in the Middle East.
USD/INR rebounds after registering little losses in the previous session. However, the pair reached an all-time high of 92.81 on Monday as the Indian Rupee (INR) faces intense selling pressure amid increased risk aversion and higher oil prices.
The Indian Rupee received support amid some easing in the Middle East conflict after US President Donald Trump said the war with Iran could be resolved “very soon,” as he faces mounting economic and political pressure after days of sharp volatility in oil markets.
The INR received support as the Reserve Bank of India stepped up measures to stabilize financial markets. The Reserve Bank of India (RBI) has been active in both offshore and domestic foreign-exchange markets, intervening after the currency briefly weakened beyond the 92-per-dollar level during the recent turbulence.
West Texas Intermediate (WTI) oil price rebounds toward $88.00 per barrel at the time of writing. Trump said the war with Iran could be resolved “very soon,” as he faces mounting economic and political pressure after days of sharp volatility in oil markets.
Meanwhile, the International Energy Agency (IEA) reportedly discussed a coordinated release of emergency oil reserves among member countries on Monday to stabilize markets. Such a move could temporarily boost supply and help prevent a sharp surge in oil prices.
Still, the recent surge in oil prices remains a key concern for the Indian Rupee as currencies from nations, such as India, that rely heavily on oil imports to fulfil their energy needs remain highly sensitive to changes in oil prices.
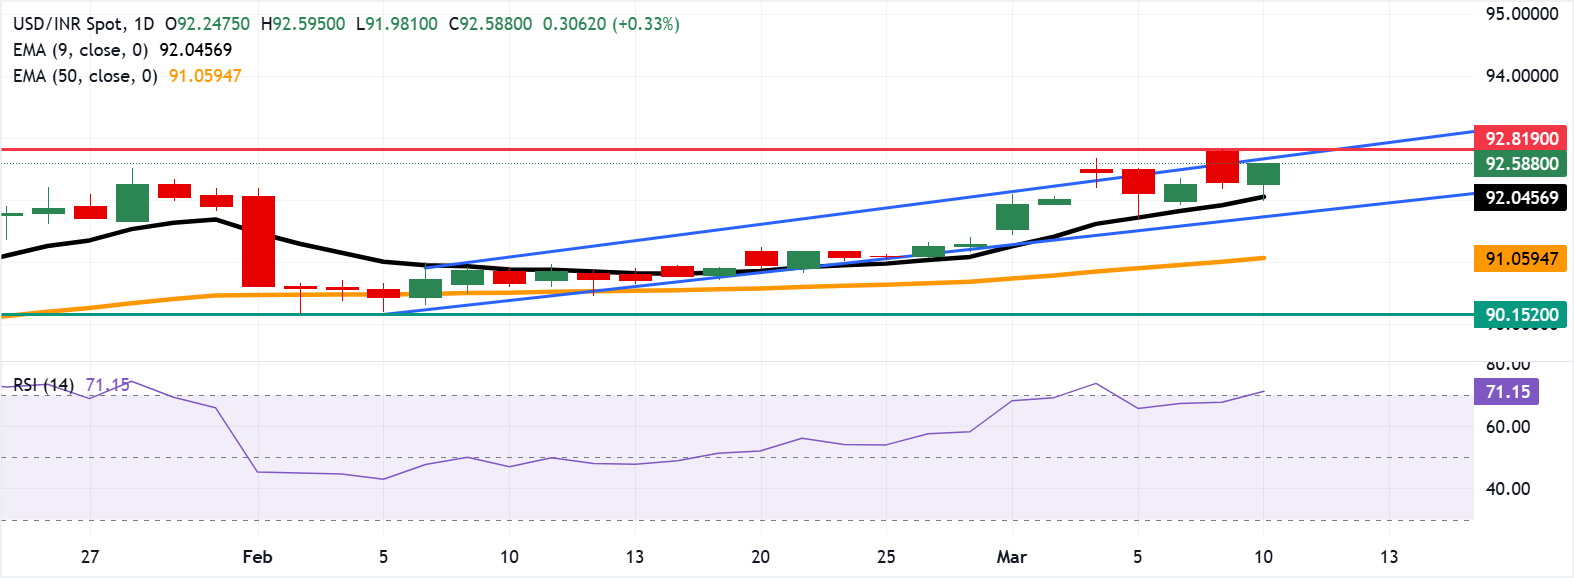
Technical Analysis: USD/INR rebounds toward 92.50 near record highs
USD/INR trades around 92.60 at the time of writing, rebounding toward a fresh record high of 92.81 reached on Monday. The technical analysis of the daily chart indicates a persistent bullish bias as the pair remains within the ascending channel pattern.
The near-term bias is bullish as price extends above the rising 50-day Exponential Moving Average (EMA) and holds comfortably above the faster nine-day average, signalling persistent upside control after the recent breakout. The Relative Strength Index (RSI) at 70 shows strong momentum and pushes into overbought territory, indicating that buyers dominate but also that the risk of a pause or shallow correction increases as the pair stretches further from its medium-term average.
The immediate resistance lies at the upper boundary of the ascending channel of 92.70, followed by the all-time high of 92.50. On the downside, the initial support lies at the nine-day EMA of 92.04, followed by the lower boundary of the channel at 91.70.
(The technical analysis of this story was written with the help of an AI tool.)
US Dollar Price Today
The table below shows the percentage change of US Dollar (USD) against listed major currencies today. US Dollar was the strongest against the Indian Rupee.
| USD | EUR | GBP | JPY | CAD | AUD | NZD | INR | |
|---|---|---|---|---|---|---|---|---|
| USD | 0.22% | 0.12% | 0.11% | 0.09% | 0.22% | 0.41% | 0.72% | |
| EUR | -0.22% | -0.08% | -0.09% | -0.15% | 0.01% | 0.20% | -0.18% | |
| GBP | -0.12% | 0.08% | -0.06% | -0.07% | 0.09% | 0.28% | 0.54% | |
| JPY | -0.11% | 0.09% | 0.06% | -0.05% | 0.11% | 0.30% | -0.08% | |
| CAD | -0.09% | 0.15% | 0.07% | 0.05% | 0.16% | 0.34% | 0.00% | |
| AUD | -0.22% | -0.01% | -0.09% | -0.11% | -0.16% | 0.18% | -0.18% | |
| NZD | -0.41% | -0.20% | -0.28% | -0.30% | -0.34% | -0.18% | 0.03% | |
| INR | -0.72% | 0.18% | -0.54% | 0.08% | 0.00% | 0.18% | -0.03% |
The heat map shows percentage changes of major currencies against each other. The base currency is picked from the left column, while the quote currency is picked from the top row. For example, if you pick the US Dollar from the left column and move along the horizontal line to the Japanese Yen, the percentage change displayed in the box will represent USD (base)/JPY (quote).
Indian Rupee FAQs
The Indian Rupee (INR) is one of the most sensitive currencies to external factors. The price of Crude Oil (the country is highly dependent on imported Oil), the value of the US Dollar – most trade is conducted in USD – and the level of foreign investment, are all influential. Direct intervention by the Reserve Bank of India (RBI) in FX markets to keep the exchange rate stable, as well as the level of interest rates set by the RBI, are further major influencing factors on the Rupee.
The Reserve Bank of India (RBI) actively intervenes in forex markets to maintain a stable exchange rate, to help facilitate trade. In addition, the RBI tries to maintain the inflation rate at its 4% target by adjusting interest rates. Higher interest rates usually strengthen the Rupee. This is due to the role of the ‘carry trade’ in which investors borrow in countries with lower interest rates so as to place their money in countries’ offering relatively higher interest rates and profit from the difference.
Macroeconomic factors that influence the value of the Rupee include inflation, interest rates, the economic growth rate (GDP), the balance of trade, and inflows from foreign investment. A higher growth rate can lead to more overseas investment, pushing up demand for the Rupee. A less negative balance of trade will eventually lead to a stronger Rupee. Higher interest rates, especially real rates (interest rates less inflation) are also positive for the Rupee. A risk-on environment can lead to greater inflows of Foreign Direct and Indirect Investment (FDI and FII), which also benefit the Rupee.
Higher inflation, particularly, if it is comparatively higher than India’s peers, is generally negative for the currency as it reflects devaluation through oversupply. Inflation also increases the cost of exports, leading to more Rupees being sold to purchase foreign imports, which is Rupee-negative. At the same time, higher inflation usually leads to the Reserve Bank of India (RBI) raising interest rates and this can be positive for the Rupee, due to increased demand from international investors. The opposite effect is true of lower inflation.
추천 기사


