

GBP/USD Price Forecast: Tests 1.3600 support near lower ascending channel boundary
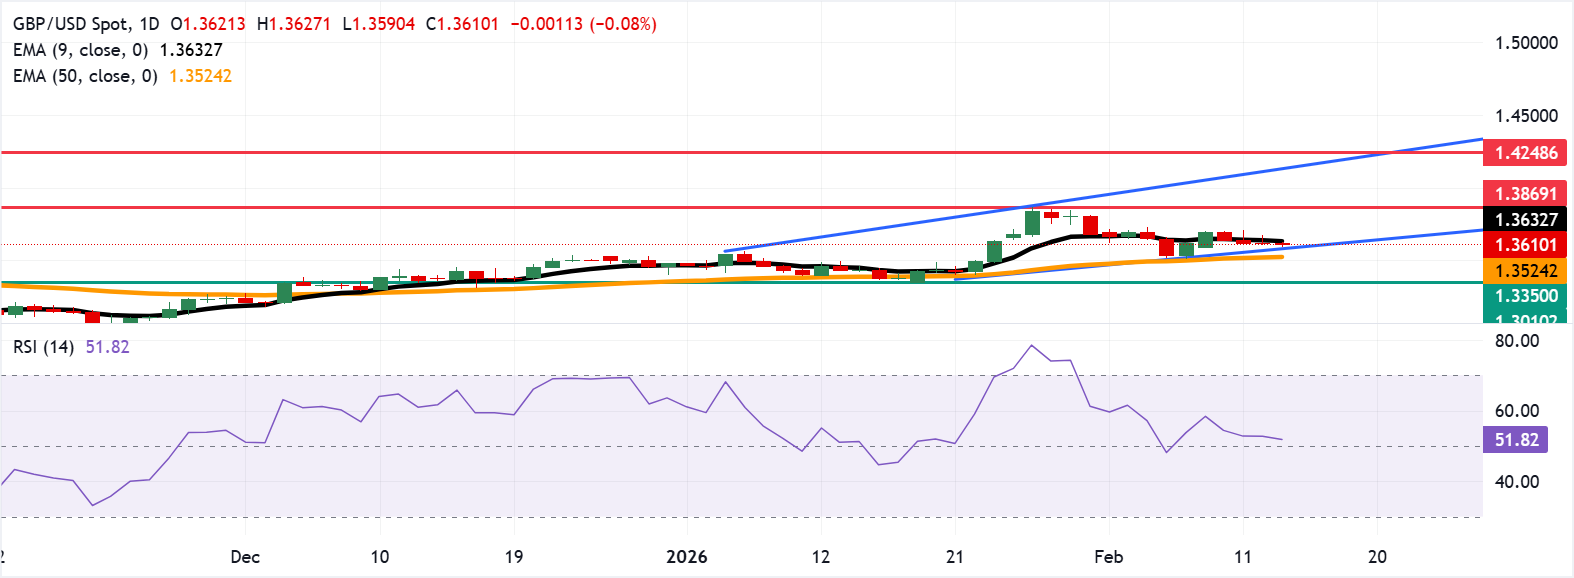
- GBP/USD tests the ascending channel’s lower boundary near 1.3580.
- The 14-day Relative Strength Index at 51 turns neutral after retreating from overbought levels.
- The Immediate resistance is seen at the nine-day EMA of 1.3632.
GBP/USD remains subdued for the fourth successive session, trading around 1.3600 during the European hours on Friday. The technical analysis of the daily chart indicates an ongoing bullish bias, as the pair trades within an ascending channel pattern.
The 14-day Relative Strength Index (RSI), a momentum indicator, at 51 is neutral after cooling from overbought territory. RSI around 50 underscores a range-bound phase; a push above 60 would bolster upside continuation.
The 50-day Exponential Moving Average (EMA) rises, supporting the broader advance. The nine-day EMA caps the upside near term, with price below it yet holding above the 50-day EMA. A daily close back above the nine-day EMA would strengthen bullish pressure. If the pair fails to reclaim the short-term average, the pullback could extend into consolidation as momentum eases while the rising trend remains intact.
The GBP/USD pair is testing the lower boundary of the ascending channel around 1.3580, followed by the 50-day EMA at 1.3524. Further declines would put downward pressure on the GBP/USD pair, testing the support reversal zone around 1.3350.
On the upside, the immediate barrier is seen at the nine-day EMA at 1.3632, followed by 1.3869, the highest since September 2021, reached on January 27. Further advances would support the GBP/USD pair to approach the upper boundary of the ascending channel around 1.4150, followed by 1.4248, the highest level since April 2018.
(The technical analysis of this story was written with the help of an AI tool.)
Pound Sterling FAQs
The Pound Sterling (GBP) is the oldest currency in the world (886 AD) and the official currency of the United Kingdom. It is the fourth most traded unit for foreign exchange (FX) in the world, accounting for 12% of all transactions, averaging $630 billion a day, according to 2022 data. Its key trading pairs are GBP/USD, also known as ‘Cable’, which accounts for 11% of FX, GBP/JPY, or the ‘Dragon’ as it is known by traders (3%), and EUR/GBP (2%). The Pound Sterling is issued by the Bank of England (BoE).
The single most important factor influencing the value of the Pound Sterling is monetary policy decided by the Bank of England. The BoE bases its decisions on whether it has achieved its primary goal of “price stability” – a steady inflation rate of around 2%. Its primary tool for achieving this is the adjustment of interest rates. When inflation is too high, the BoE will try to rein it in by raising interest rates, making it more expensive for people and businesses to access credit. This is generally positive for GBP, as higher interest rates make the UK a more attractive place for global investors to park their money. When inflation falls too low it is a sign economic growth is slowing. In this scenario, the BoE will consider lowering interest rates to cheapen credit so businesses will borrow more to invest in growth-generating projects.
Data releases gauge the health of the economy and can impact the value of the Pound Sterling. Indicators such as GDP, Manufacturing and Services PMIs, and employment can all influence the direction of the GBP. A strong economy is good for Sterling. Not only does it attract more foreign investment but it may encourage the BoE to put up interest rates, which will directly strengthen GBP. Otherwise, if economic data is weak, the Pound Sterling is likely to fall.
Another significant data release for the Pound Sterling is the Trade Balance. This indicator measures the difference between what a country earns from its exports and what it spends on imports over a given period. If a country produces highly sought-after exports, its currency will benefit purely from the extra demand created from foreign buyers seeking to purchase these goods. Therefore, a positive net Trade Balance strengthens a currency and vice versa for a negative balance.
추천 기사


