


USD/CAD Price Forecast: Tests lower descending channel boundary near 1.3650
- USD/CAD remains below the nine-day and 50-day EMAs, keeping near-term momentum under pressure.
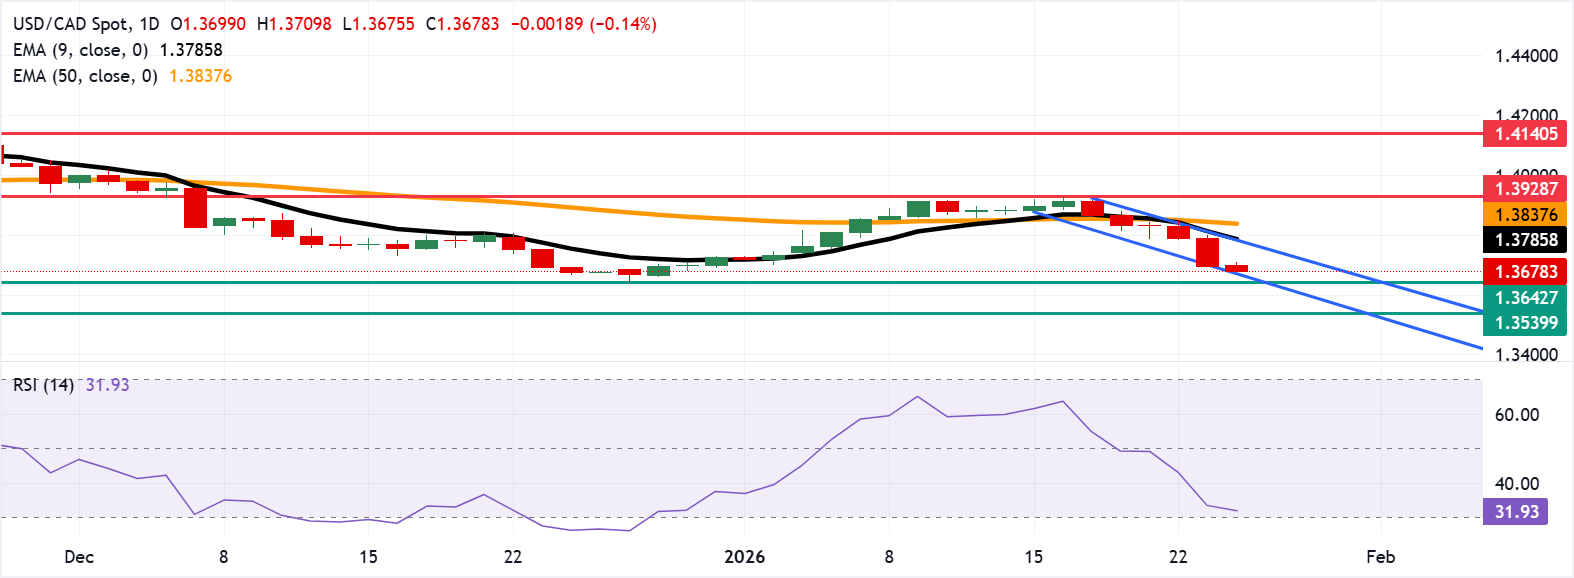
- The 14-day Relative Strength Index at 32 is near oversold, confirming weakening momentum.
- The primary resistance sits at the nine-day EMA (1.3787), aligned with the upper descending channel.
USD/CAD extends its losing streak for the sixth successive session, trading around 1.3680 during the Asian hours on Monday. The technical analysis of the daily chart shows the pair declines within a newly formed descending channel pattern, suggesting a persistent bearish bias. The 14-day Relative Strength Index (RSI) is at 32 (near oversold) and slipping, confirming weakening momentum.
The USD/CAD pair stays below the nine-day Exponential Moving Average (EMA) and the 50-day EMA, keeping the near-term tone pressured. The short-term average holds beneath the longer-term gauge and both slope lower, preserving a downside bias.
A successful decline below the channel would reinforce the prevailing bearish bias and put downward pressure on the pair to test the six-month low of 1.3642, recorded on December 26, followed by the 1.3539, the lowest since October 2024.
The primary resistance lies at the nine-day EMA of 1.3787, aligned with the upper descending channel. A break above this confluence area would expose the 50-day EMA at 1.3838, followed by the seven-week high of 1.3928, reached on January 16.
(The technical analysis of this story was written with the help of an AI tool.)
Canadian Dollar FAQs
The key factors driving the Canadian Dollar (CAD) are the level of interest rates set by the Bank of Canada (BoC), the price of Oil, Canada’s largest export, the health of its economy, inflation and the Trade Balance, which is the difference between the value of Canada’s exports versus its imports. Other factors include market sentiment – whether investors are taking on more risky assets (risk-on) or seeking safe-havens (risk-off) – with risk-on being CAD-positive. As its largest trading partner, the health of the US economy is also a key factor influencing the Canadian Dollar.
The Bank of Canada (BoC) has a significant influence on the Canadian Dollar by setting the level of interest rates that banks can lend to one another. This influences the level of interest rates for everyone. The main goal of the BoC is to maintain inflation at 1-3% by adjusting interest rates up or down. Relatively higher interest rates tend to be positive for the CAD. The Bank of Canada can also use quantitative easing and tightening to influence credit conditions, with the former CAD-negative and the latter CAD-positive.
The price of Oil is a key factor impacting the value of the Canadian Dollar. Petroleum is Canada’s biggest export, so Oil price tends to have an immediate impact on the CAD value. Generally, if Oil price rises CAD also goes up, as aggregate demand for the currency increases. The opposite is the case if the price of Oil falls. Higher Oil prices also tend to result in a greater likelihood of a positive Trade Balance, which is also supportive of the CAD.
While inflation had always traditionally been thought of as a negative factor for a currency since it lowers the value of money, the opposite has actually been the case in modern times with the relaxation of cross-border capital controls. Higher inflation tends to lead central banks to put up interest rates which attracts more capital inflows from global investors seeking a lucrative place to keep their money. This increases demand for the local currency, which in Canada’s case is the Canadian Dollar.
Macroeconomic data releases gauge the health of the economy and can have an impact on the Canadian Dollar. Indicators such as GDP, Manufacturing and Services PMIs, employment, and consumer sentiment surveys can all influence the direction of the CAD. A strong economy is good for the Canadian Dollar. Not only does it attract more foreign investment but it may encourage the Bank of Canada to put up interest rates, leading to a stronger currency. If economic data is weak, however, the CAD is likely to fall.
추천 기사


