

EUR/USD stands near two-month highs as Fed rate cut bets weigh on the US Dollar
- EUR/USD consolidates near the two-month high at 1.1762 posted on Thursday, on track to close a three-week rally.
- The increasing monetary policy divergence between the ECB and the Fed keeps the US Dollar on its back foot.
- Technical indicators suggest that Euro bulls are starting to lose steam after the rally of the last two days.
EUR/USD posts marginal losses, trading at 1.1735 on Friday after pulling back from its highest levels in more than two months at 1.1762 reached on Thursday. The increasing monetary policy divergence between the European Central Bank (ECB) and the US Federal Reserve (Fed) is underpinning support for the pair, which has rallied nearly 2% in the last three weeks.
The Fed cut rates this week and pointed to one more rate cut in 2026. Investors, however, still expect that the US central bank will ease monetary policy at least two times, considering that Chairman Jerome Powell will likely be replaced by the more dovish-leaning Kevin Hassett. Hasset is the White House economic adviser and has repeatedly shown his inclination for significantly lower borrowing costs.
On the macroeconomic front, German consumer inflation data confirmed that price pressures accelerated in November, although the monthly inflation contracted. In the US, a batch of Fed policymakers will take the stage and might give further insight into the central bank's monetary policy.
Euro Price Today
The table below shows the percentage change of Euro (EUR) against listed major currencies today. Euro was the strongest against the British Pound.
| USD | EUR | GBP | JPY | CAD | AUD | NZD | CHF | |
|---|---|---|---|---|---|---|---|---|
| USD | 0.00% | 0.05% | 0.05% | 0.01% | -0.03% | -0.06% | -0.02% | |
| EUR | -0.01% | 0.05% | 0.02% | 0.00% | -0.04% | -0.06% | -0.02% | |
| GBP | -0.05% | -0.05% | -0.02% | -0.04% | -0.09% | -0.11% | -0.07% | |
| JPY | -0.05% | -0.02% | 0.02% | -0.00% | -0.06% | -0.09% | -0.04% | |
| CAD | -0.01% | -0.00% | 0.04% | 0.00% | -0.05% | -0.08% | -0.03% | |
| AUD | 0.03% | 0.04% | 0.09% | 0.06% | 0.05% | -0.02% | 0.02% | |
| NZD | 0.06% | 0.06% | 0.11% | 0.09% | 0.08% | 0.02% | 0.04% | |
| CHF | 0.02% | 0.02% | 0.07% | 0.04% | 0.03% | -0.02% | -0.04% |
The heat map shows percentage changes of major currencies against each other. The base currency is picked from the left column, while the quote currency is picked from the top row. For example, if you pick the Euro from the left column and move along the horizontal line to the US Dollar, the percentage change displayed in the box will represent EUR (base)/USD (quote).
Daily Digest Market Movers: Euro gains on US Dollar's weakness
- The Euro (EUR) continues drawing support from broad-based US Dollar weakness. The USD Index, which measures the value of the Greenback against a basket of six majors, has been trading at two-month lows near 98.00, as investors keep pricing further Fed cuts, while most major central banks are at the end of their easing cycles.
- Data from Germany released on Friday revealed that the Harmonized Index of Consumer Prices (HICP) accelerated to 2.6% in the year to November, from 2.3% in the previous month, while prices fell by 0.5% on the month. These figures confirm the preliminary numbers and, therefore, the impact on the Euro has been minimal.
- In the US, Jobless Claims data released on Thursday showed that first-time applications for unemployment benefits rose by 44,000 in the first week of December, to 236,000. This is the largest increase in more than four years and backs the idea that the Fed will be forced to lower interest rates further to support a deteriorating labour market.
- Later in the day, the focus will shift to Philadelphia Fed President, Anna Paulson, the Cleveland Fed President, Beth Hammack, the Chicago Fed President, Austan Goolsbee, and Kansas City Fed President, Jeff Schmid, who will make public comments during the American trading hours.
Technical Analysis: EUR/USD is reaching overbought levels
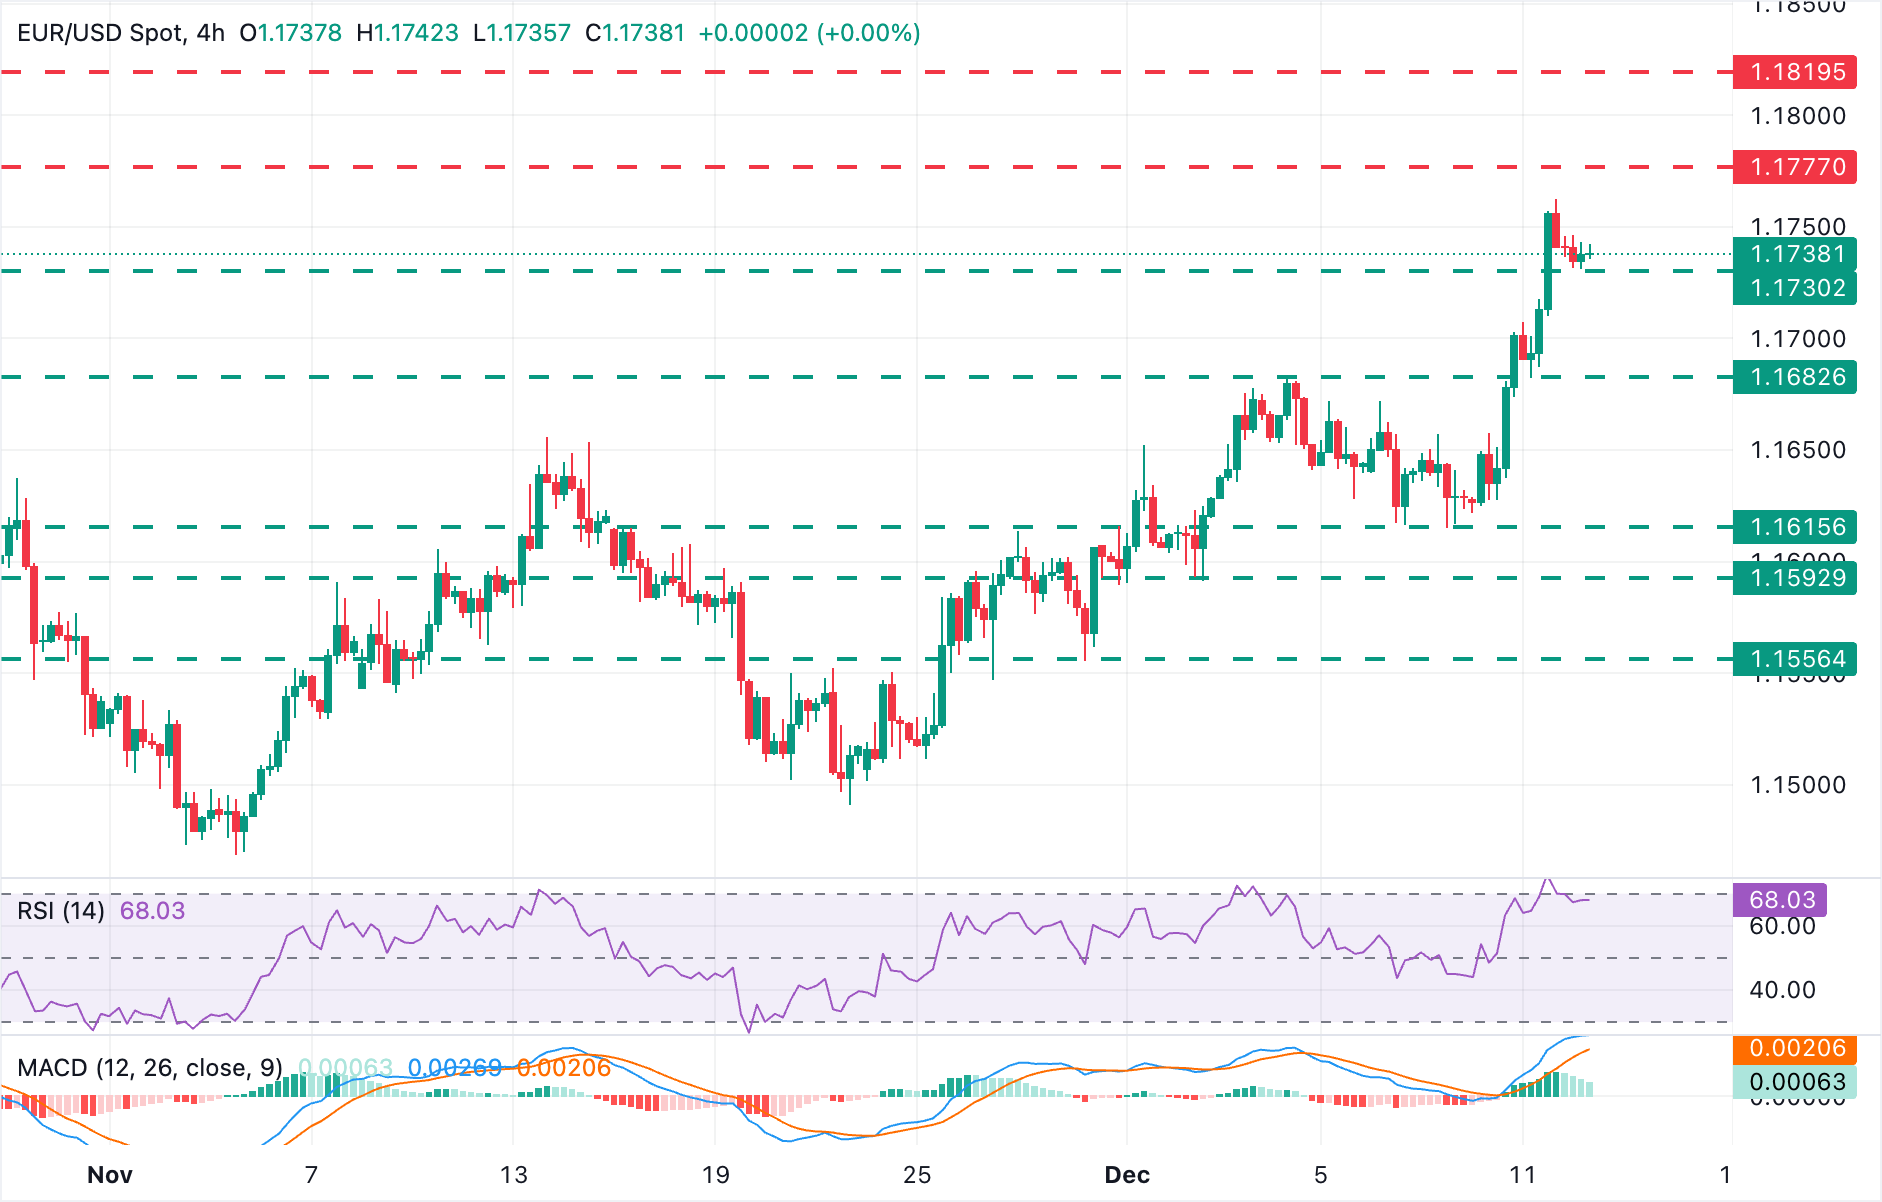
The EUR/USD technical picture remains bullish, but momentum indicators are reaching overbought levels, suggesting that the pair's rally is starting to look overstretched. The 4-Hour Relative Strength Index (RSI) is pulling back from levels past 70, and the Moving Average Convergence Divergence (MACD) indicator is turning flat, which suggests that the bullish trend might be losing steam.
Downside attempts remain contained above the October 17 high at around 1.1730. This level closes the path towards Thursday's low at the 1.1680 area and the December 9 low at 1.1615. To the upside, Thursday's high at 1.1762 and the October 1 high at around 1.1780 are likely to challenge bulls. Further up, the target is the September 23 and 24 highs near 1.1820.
Economic Indicator
Harmonized Index of Consumer Prices (YoY)
The Harmonized Index of Consumer Prices (HICP), released by the German statistics office Destatis on a monthly basis, is an index of inflation based on a statistical methodology that has been harmonized across all European Union (EU) member states to facilitate comparisons. The YoY reading compares prices in the reference month to a year earlier. Generally, a high reading is bullish for the Euro (EUR), while a low reading is bearish.
Read more.Last release: Fri Dec 12, 2025 07:00
Frequency: Monthly
Actual: 2.6%
Consensus: 2.6%
Previous: 2.6%
Source: Federal Statistics Office of Germany
Economic Indicator
Harmonized Index of Consumer Prices (MoM)
The Harmonized Index of Consumer Prices (HICP), released by the German statistics office Destatis on a monthly basis, is an index of inflation based on a statistical methodology that has been harmonized across all European Union (EU) member states to facilitate comparisons. The MoM figure compares the prices of goods in the reference month to the previous month. Generally, a high reading is bullish for the Euro (EUR), while a low reading is bearish.
Read more.Next release: Tue Jan 06, 2026 13:00 (Prel)
Frequency: Monthly
Consensus: -
Previous: -0.5%
Source: Federal Statistics Office of Germany
추천 기사


