

GBP/USD firms as dovish repricing for Fed and BoE boosts upside momentum
- US Dollar Index drops, boosting GBP/USD as traders await Federal Reserve decision.
- UK economic outlook improves after Autumn Budget, but BoE rate cut seen as likely.
- Technical analysis shows GBP/USD testing key moving averages for further gains.
Sterling advances during the North American session as the US Dollar weakens on expectation that the Federal Reserve will cut rates, later in the day. At the time of writing, the GBP/USD trades at 1.3336 after bouncing off daily lows of 1.3288.
GBP/USD climbs amid US Dollar weakness and central bank rate cut expectations
The financial markets seem to be paused, with traders keeping the powder dry waiting for the Fed. Nevertheless, the US Dollar Index (DXY) which tracks the performance of the buck’s value against a basket of six currencies Is down 0.21% at 99.03, providing a tailwind for Cable.
Data in the US had shown mixed signals, with inflation halting its advance towards the 3% threshold as measured by the Core PCE Price Index, while the most recent jobless claims readings, hinted that the labor market is in a no-hiring no firing environment.
On Tuesday, the ADP Employment Change 4-week average showed that companies hired 4750 people in the week ending November 22, an improvement compared to the prior’s reading. Also, job vacancies rose, as stated by the JOLTS report for October.
Regarding the UK economy, the markets were relieved after the Autumn Budget. Last week’s flash PMIs reading showed that the economy is faring better than expected, yet the Bank of England is expected to reduce rates at next week’s meeting.
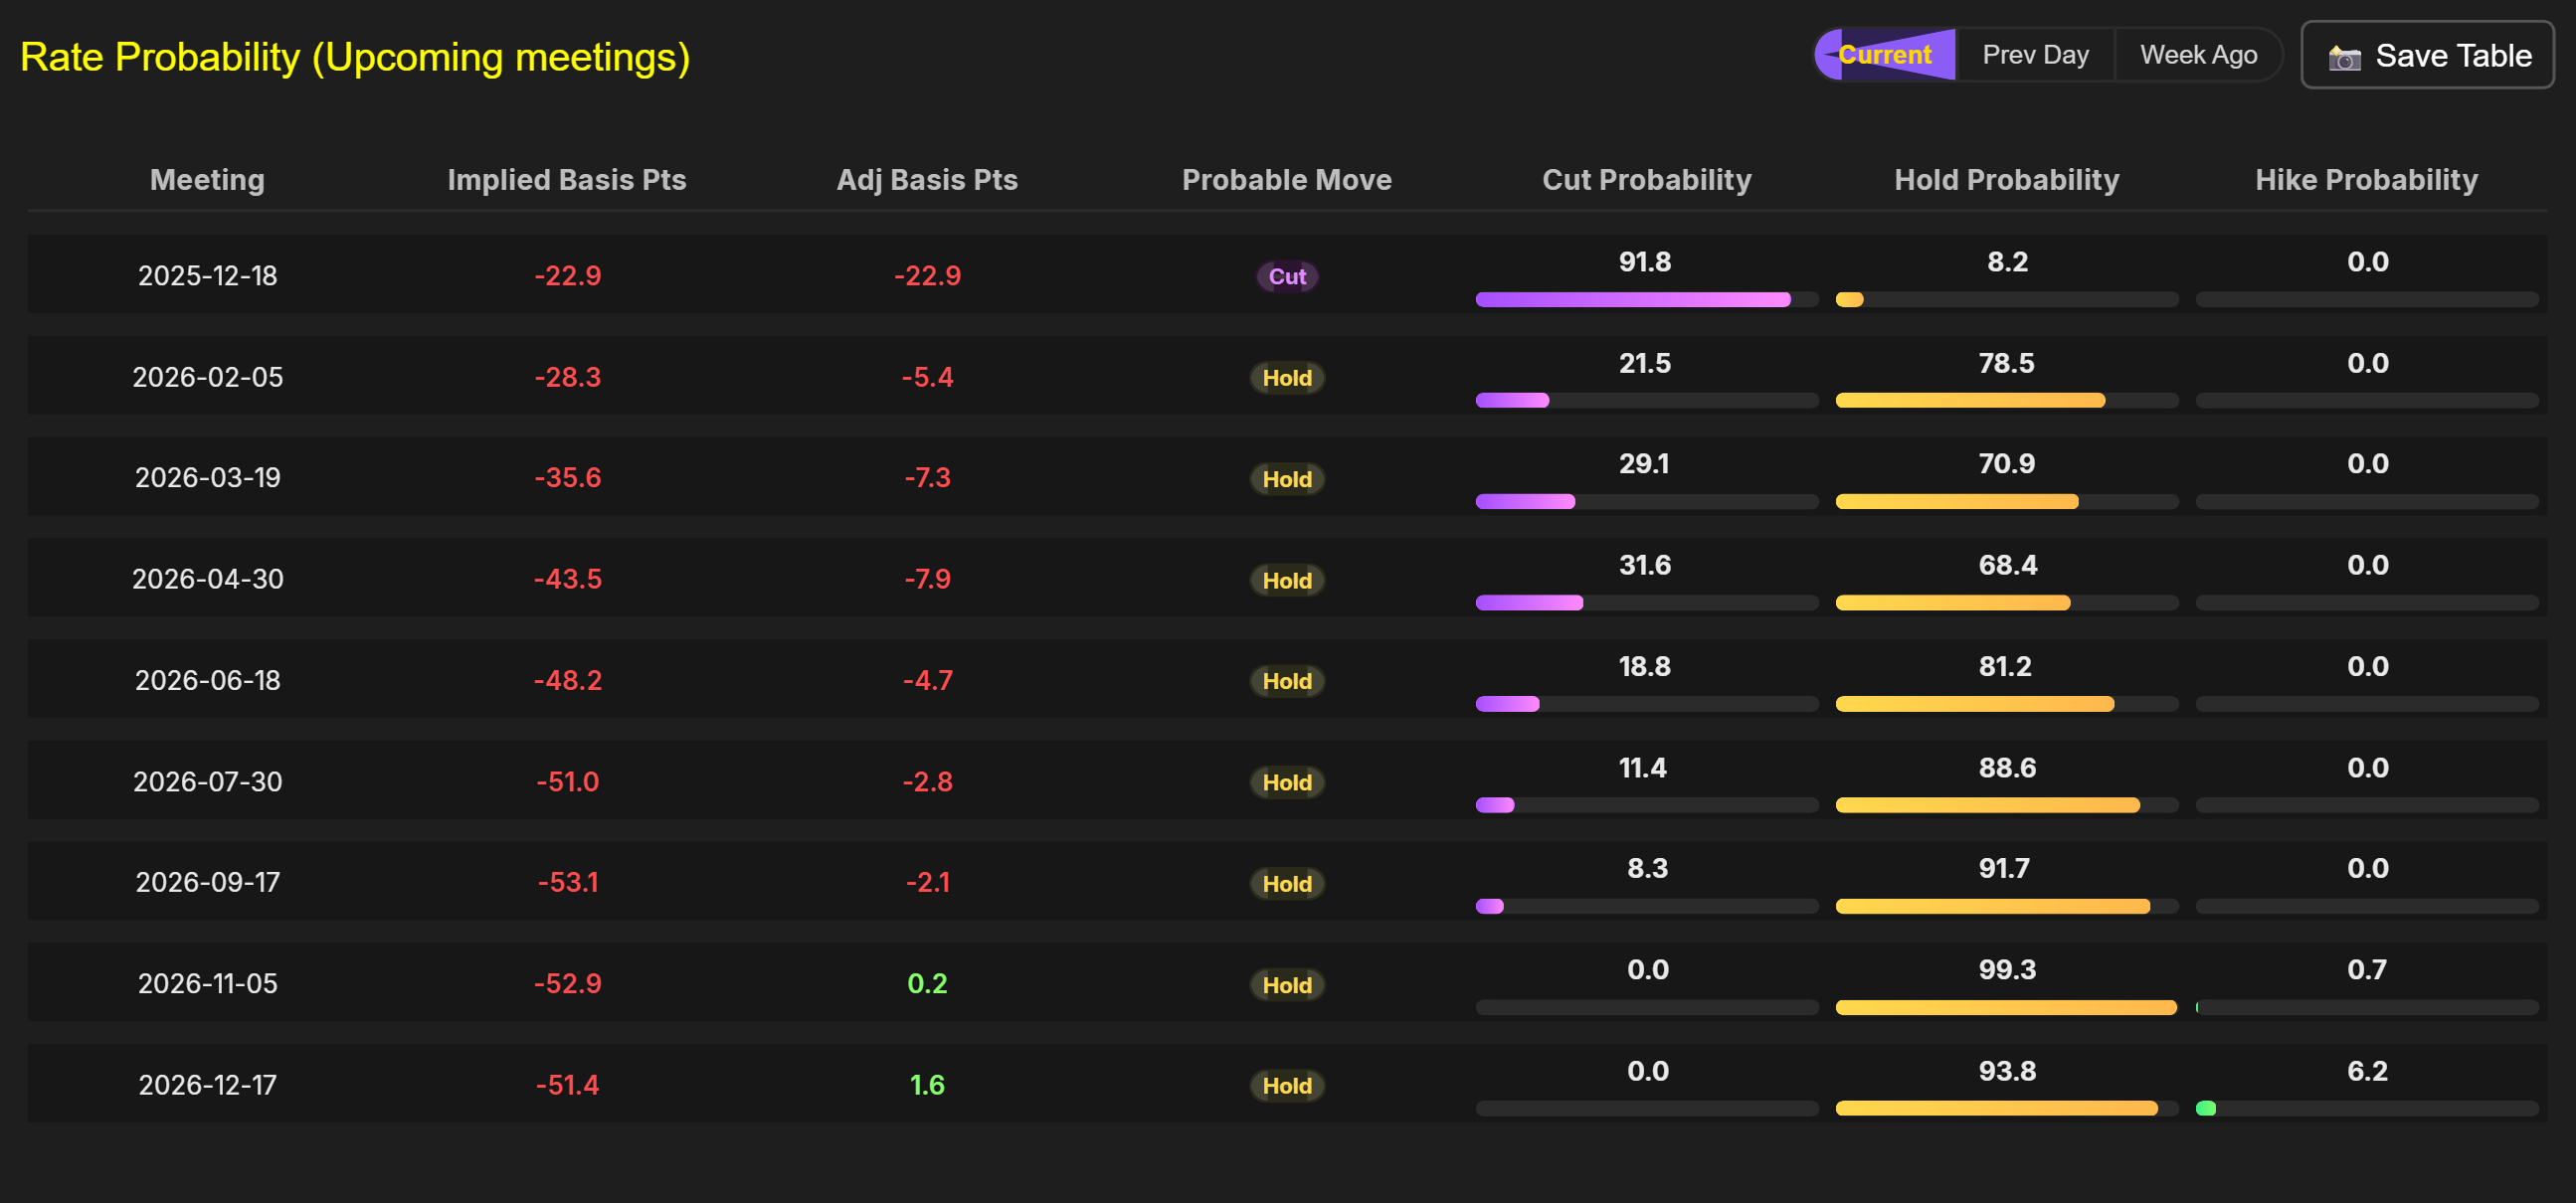
Capital Edge shows odds for a 25 bps rate cut by the BoE are nearly 92% for the December 18 meeting, with traders also pricing an additional rate cut for 2026.
What to expect at the Fed meeting?
Traders had priced in a “hawkish cut” by the Fed. Of interest would be the economic projections for the next year, regarding Unemployment Rate, Core PCE figures and the path for the Fed funds rate. After the initial reaction, Powell’s press conference would set the stage for Q1 2026 as he would not be tapped to remain the Fed Chair for another period.
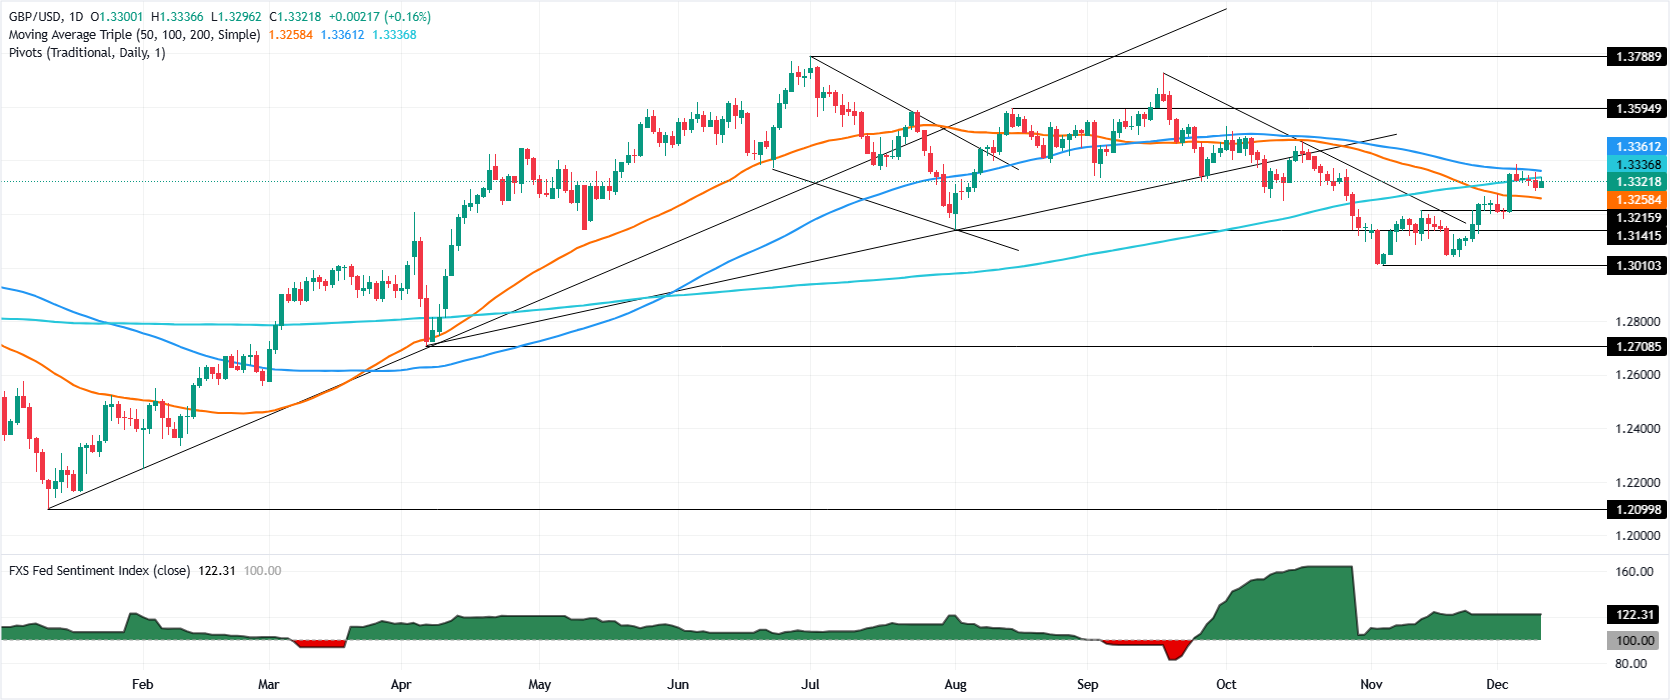
GBP/USD Price Forecast: Technical outlook
The GBP/USD remains neutral to upward biased, with trades testing the 200-day SMA At 1.3333. A breach of the latter exposes the 100-day SMA at 1.3358, followed by 1.3400. On the flip side, the first support is 1.3300, followed by the 50-day SMA At 1.3255 and the 20-day SMA At 1.3210.
Pound Sterling Price This week
The table below shows the percentage change of British Pound (GBP) against listed major currencies this week. British Pound was the strongest against the Japanese Yen.
| USD | EUR | GBP | JPY | CAD | AUD | NZD | CHF | |
|---|---|---|---|---|---|---|---|---|
| USD | 0.06% | 0.05% | 0.74% | 0.24% | 0.05% | -0.13% | -0.13% | |
| EUR | -0.06% | 0.04% | 0.75% | 0.23% | 0.05% | -0.14% | -0.15% | |
| GBP | -0.05% | -0.04% | 0.73% | 0.19% | 0.02% | -0.18% | -0.18% | |
| JPY | -0.74% | -0.75% | -0.73% | -0.51% | -0.68% | -0.86% | -0.86% | |
| CAD | -0.24% | -0.23% | -0.19% | 0.51% | -0.17% | -0.38% | -0.37% | |
| AUD | -0.05% | -0.05% | -0.02% | 0.68% | 0.17% | -0.20% | -0.20% | |
| NZD | 0.13% | 0.14% | 0.18% | 0.86% | 0.38% | 0.20% | -0.00% | |
| CHF | 0.13% | 0.15% | 0.18% | 0.86% | 0.37% | 0.20% | 0.00% |
The heat map shows percentage changes of major currencies against each other. The base currency is picked from the left column, while the quote currency is picked from the top row. For example, if you pick the British Pound from the left column and move along the horizontal line to the US Dollar, the percentage change displayed in the box will represent GBP (base)/USD (quote).
추천 기사


