
EUR/GBP edges lower as supportive UK budget helps Pound recover
- EUR/GBP retreats as UK budget details spur short-Sterling unwinds amid reassurance over moderate fiscal measures.
- OBR projects weak GDP through 2027, with inflation seen returning to BoE target only by then.
- Traders watch Russia–Ukraine peace signals and cautious ECB tone after Vujčić warns of AI-bubble risks.
The EUR/GBP retreats on Wednesday after the latest UK’s budget revealed by the Chancellor Rachel Reeves seem to be well received by investors, which initially sold off the British Pound, which trimmed its earlier loses. At the time of writing, the cross trades at 0.8766 down 0.24%.
Sterling stabilizes as Reeves unveils tax-heavy budget with limited fiscal headroom, easing fears of major negatives
The UK’s budget raised taxes by £26 billion, come after last year’s budget raised taxes by £40 billion. Reeves commented that the government would have £22 billion fiscal headroom, to avoid unexpected shocks. Nevertheless, the Office for Budget Responsibility (OBR) revealed that the maneuver space is still “small” compared to the office’s forecast
OBR’s forecasts suggest that GDP for 2025 would end at 1.5%, in 2026 1.4% and in 2027 would be back at 1.5%. Regarding inflation, projections suggests that the Consumer Price Index (CPI) will reach the Bank of England’s target in 2027, with the office seen CPI ending at 3% in 2025 and 2.5% in 2026.
Meanwhile, Nomura’s analysts mentioned that short Sterling positions likely to unwind as the budget avoided “major negatives.”
In Europe the economic docket remained absent, yet traders are eyeing developments of a possible peace deal between Russia and Ukraine. On Tuesday, US President Donald Trump said that he thinks that they are getting very close to a deal.
Meanwhile, European Central Bank (ECB) member Vujcic said that he sees no reason for another rate cut, though noted that “However, the situation could change if an AI bubble were to burst.”
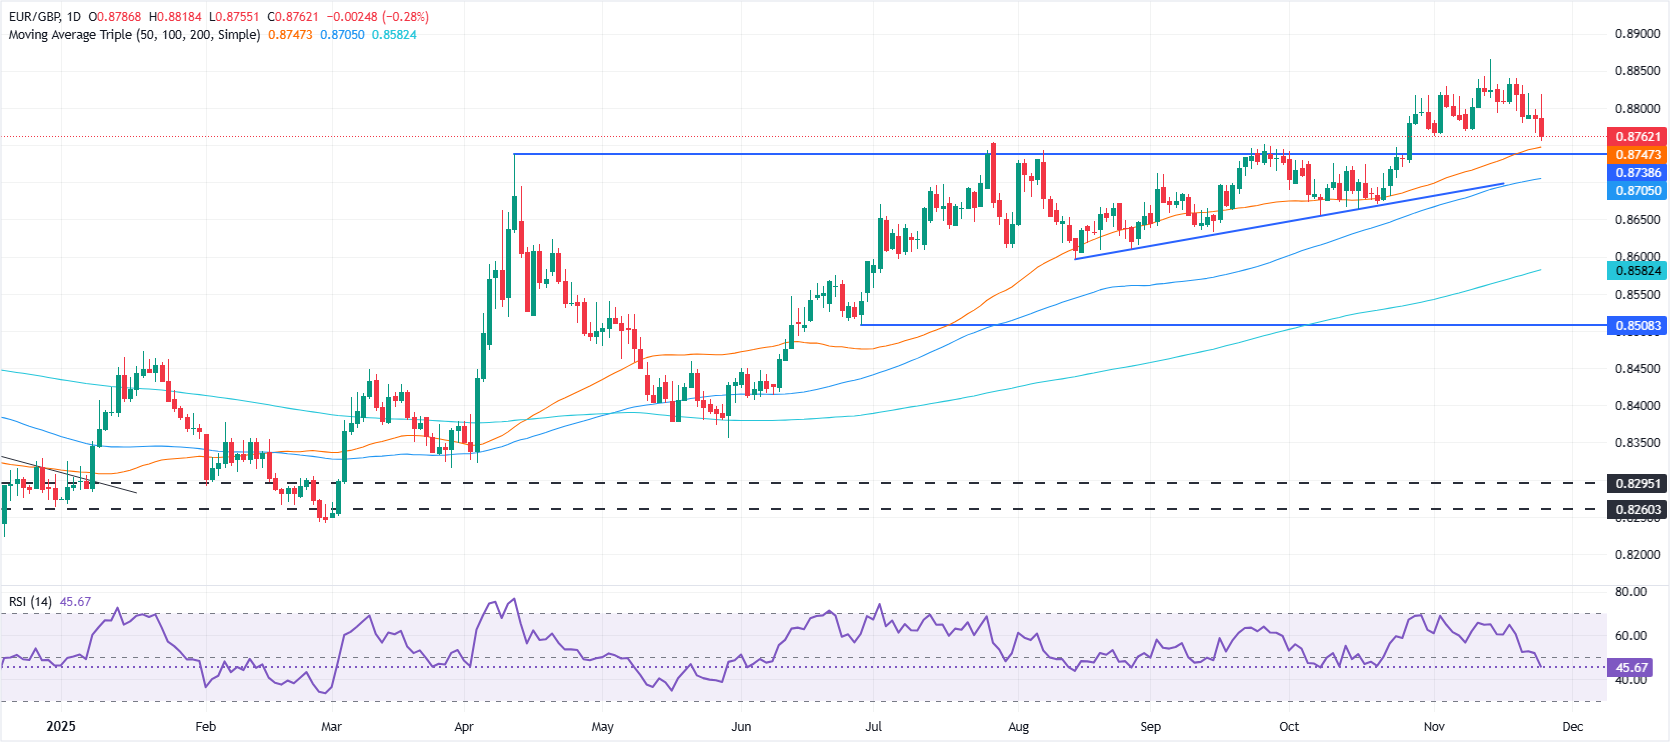
EUR/GBP Price Forecast: Technical outlook
The EUR/GBP is dipping towards the 50-day SMA at 0.8747, but so far it remains closer to 0.8770, capped on the upside by the 20.day SMA at 0.8799. Bears are picking up momentum as shown by the RSI piercing below the neutral level, an indication that selling pressure is outweighing buyers.
If EUR/GBP drops below the 50-day SMA, expect a test of the 100-day SMA at 0.8705. Conversely, if the cross edges back above 0.8800, buyers could test resistance at the day’s high of 0.8818.
Euro Price This week
The table below shows the percentage change of Euro (EUR) against listed major currencies this week. Euro was the strongest against the US Dollar.
| USD | EUR | GBP | JPY | CAD | AUD | NZD | CHF | |
|---|---|---|---|---|---|---|---|---|
| USD | -0.68% | -0.99% | -0.09% | -0.23% | -0.71% | -1.34% | -0.33% | |
| EUR | 0.68% | -0.31% | 0.62% | 0.45% | -0.04% | -0.67% | 0.35% | |
| GBP | 0.99% | 0.31% | 0.91% | 0.77% | 0.27% | -0.36% | 0.66% | |
| JPY | 0.09% | -0.62% | -0.91% | -0.14% | -0.68% | -1.38% | -0.24% | |
| CAD | 0.23% | -0.45% | -0.77% | 0.14% | -0.49% | -1.12% | -0.11% | |
| AUD | 0.71% | 0.04% | -0.27% | 0.68% | 0.49% | -0.62% | 0.41% | |
| NZD | 1.34% | 0.67% | 0.36% | 1.38% | 1.12% | 0.62% | 1.02% | |
| CHF | 0.33% | -0.35% | -0.66% | 0.24% | 0.11% | -0.41% | -1.02% |
The heat map shows percentage changes of major currencies against each other. The base currency is picked from the left column, while the quote currency is picked from the top row. For example, if you pick the Euro from the left column and move along the horizontal line to the US Dollar, the percentage change displayed in the box will represent EUR (base)/USD (quote).
추천 기사


