

GBP/USD strengthens as US data erodes Dollar support
- GBP/USD rises as Dollar weakens after soft PPI, slowing Retail Sales, and plunging US consumer confidence.
- Fed cut odds increase as core PPI eases and household pessimism deepens amid extended US shutdown effects.
- UK Autumn Budget approaches, with Chancellor Reeves expected to unveil major tax hikes to meet fiscal goals.
GBP/USD advances some 0.59% on Tuesday due to broad US Dollar weakness amid a scarce economic docket in the UK with investors awaiting the release of the UK Autumn budget. The pair trades at 1.3181, closing in the 1.3200 milestone.
Pound climbs amid rising Fed cut expectations outweighing UK budget uncertainty
US economic data continues to flow, yet figures had increased the likelihood for a Fed rate cut at the December meetings. The Producer Price Index (PPI) for September, rose by 2.7% YoY aligned with estimates and August’s print, an indication that prices had stalled. Core PPI for the same period dipped from 2.8% YoY to 2.6%, below forecasts of 2.7%.
US Retail Sales in September increased 0.2% MoM, down from August’s 0.6%, while the Conference Board (CB) in November confirmed that households grew pessimistic about the economy. The CB Consumer Confidence declined 6.8 points to 88.7 from 95.5 in October. Dana M. Peterson Chief economist of the CB noted that “Consumers revealed reduced confidence across jobs, incomes, and financial situations, both now and in the future, potentially due to the government shutdown.”
Recently Minneapolis Fed President Neel Kashkari said that “there are real use cases for AI, but not for crypto, adds people are feeling hardship due to inflation.”
Odds for a December meeting rate cut are at 85%, up from 50% a week ago, sponsored by dovish comments of New York Fed John Williams and Fed Governor Christopher Waller.
Across the pond, UK’s Chancellor Rachel Reeves will announce the budget on Wednesday, and is expected to need to raise tens of billions of pounds to meet her fiscal targets.
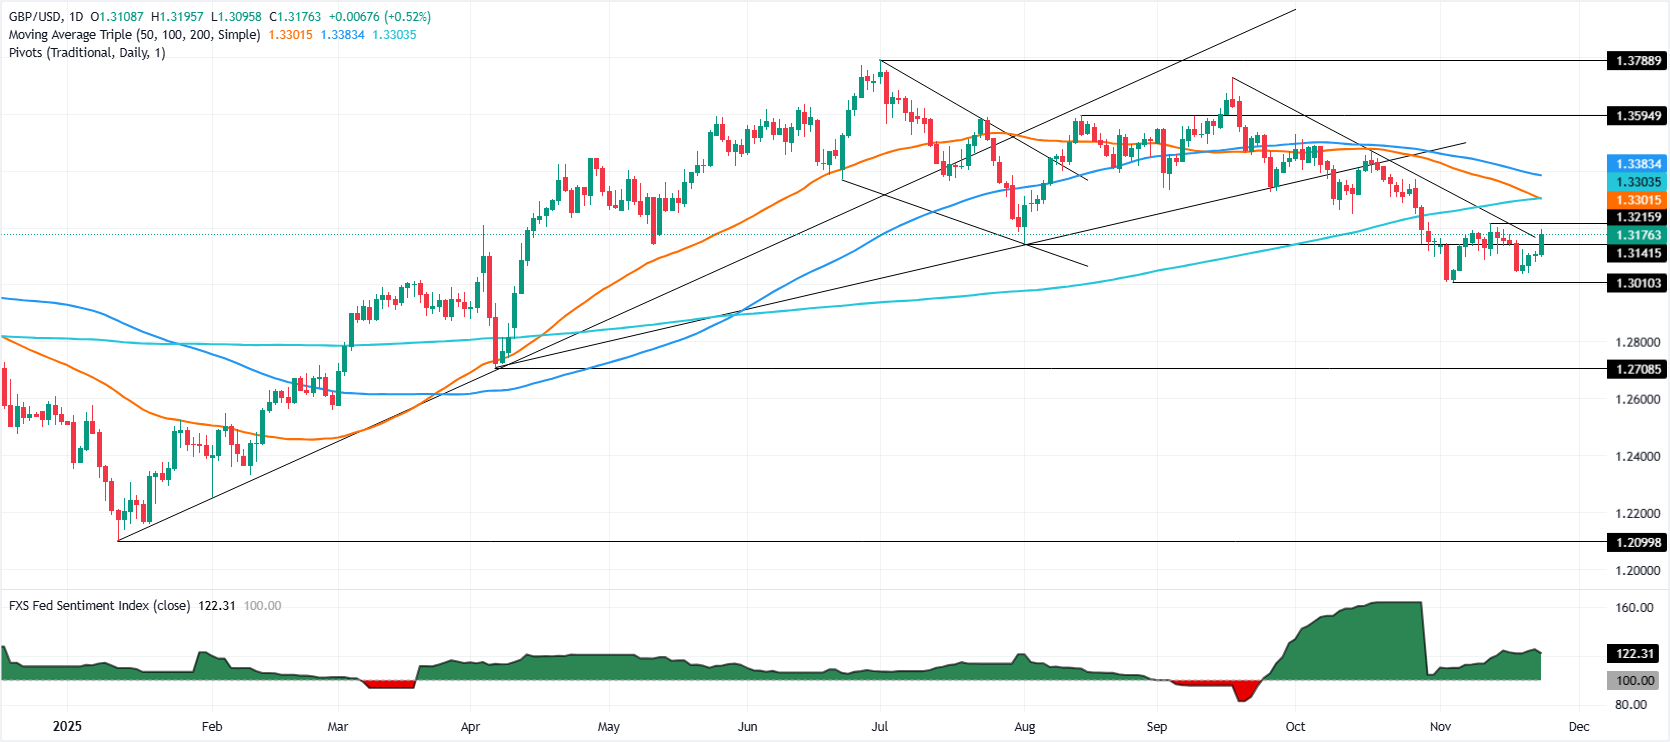
GBP/USD Price Forecast: Technical outlook
The GBP/USD remains downward biased though a decisive break above November 15 swing high of 1.3215, could clear the path to challenge the confluence of the 50- and 200-day Simple Moving Averages (SMAs) at 1.3299/1.3300. Otherwise, a drop below the 20-day SMA at 1.3130 could push the pair towards 1.3100.
Pound Sterling Price This week
The table below shows the percentage change of British Pound (GBP) against listed major currencies this week. British Pound was the strongest against the Australian Dollar.
| USD | EUR | GBP | JPY | CAD | AUD | NZD | CHF | |
|---|---|---|---|---|---|---|---|---|
| USD | -0.41% | -0.56% | -0.28% | 0.04% | 0.18% | 0.12% | -0.09% | |
| EUR | 0.41% | -0.15% | 0.14% | 0.44% | 0.57% | 0.53% | 0.32% | |
| GBP | 0.56% | 0.15% | 0.27% | 0.60% | 0.73% | 0.69% | 0.47% | |
| JPY | 0.28% | -0.14% | -0.27% | 0.30% | 0.40% | 0.27% | 0.19% | |
| CAD | -0.04% | -0.44% | -0.60% | -0.30% | 0.14% | 0.09% | -0.13% | |
| AUD | -0.18% | -0.57% | -0.73% | -0.40% | -0.14% | -0.04% | -0.24% | |
| NZD | -0.12% | -0.53% | -0.69% | -0.27% | -0.09% | 0.04% | -0.21% | |
| CHF | 0.09% | -0.32% | -0.47% | -0.19% | 0.13% | 0.24% | 0.21% |
The heat map shows percentage changes of major currencies against each other. The base currency is picked from the left column, while the quote currency is picked from the top row. For example, if you pick the British Pound from the left column and move along the horizontal line to the US Dollar, the percentage change displayed in the box will represent GBP (base)/USD (quote).
추천 기사


