
USD/JPY Price Forecast: Trades sideways above 147.00 ahead of key US-Japan events
- USD/JPY wobbles above 147.00 ahead of flash US S&P Global PMI, and Japan’s National CPI data.
- Investors await Fed Powell’s speech at Jackson Hole Symposium to get fresh cues on the monetary policy outlook.
- The pair has been trading close the 20-day EMA from past few weeks.
The USD/JPY pair consolidates in a tight range around 147.40 during the late Asian trading session on Thursday. The pair trades sideways as investors await Federal Reserve (Fed) Chair Jerome Powell’s speech at the on Friday.
Investors will pay close attention to Fed Powell’s speech to get cues about whether the United States (US) central bank will cut interest rates in the September policy meeting.
In Thursday’s session, the US Dollar will be influenced by the preliminary US S&P Global PMI report for August, which will be published at 13:45 GMT. During the press time, the US Dollar Index (DXY), which tracks the Greenback’s value against six major currencies, wobbles near 98.30.
In Japan, financial market participants will closely monitor the National Consumer Price Index (CPI) data for July, which is scheduled to be published in Friday’s Asian session. Economists expect the National CPI ex. Fresh Food to have grown moderately by 3%.
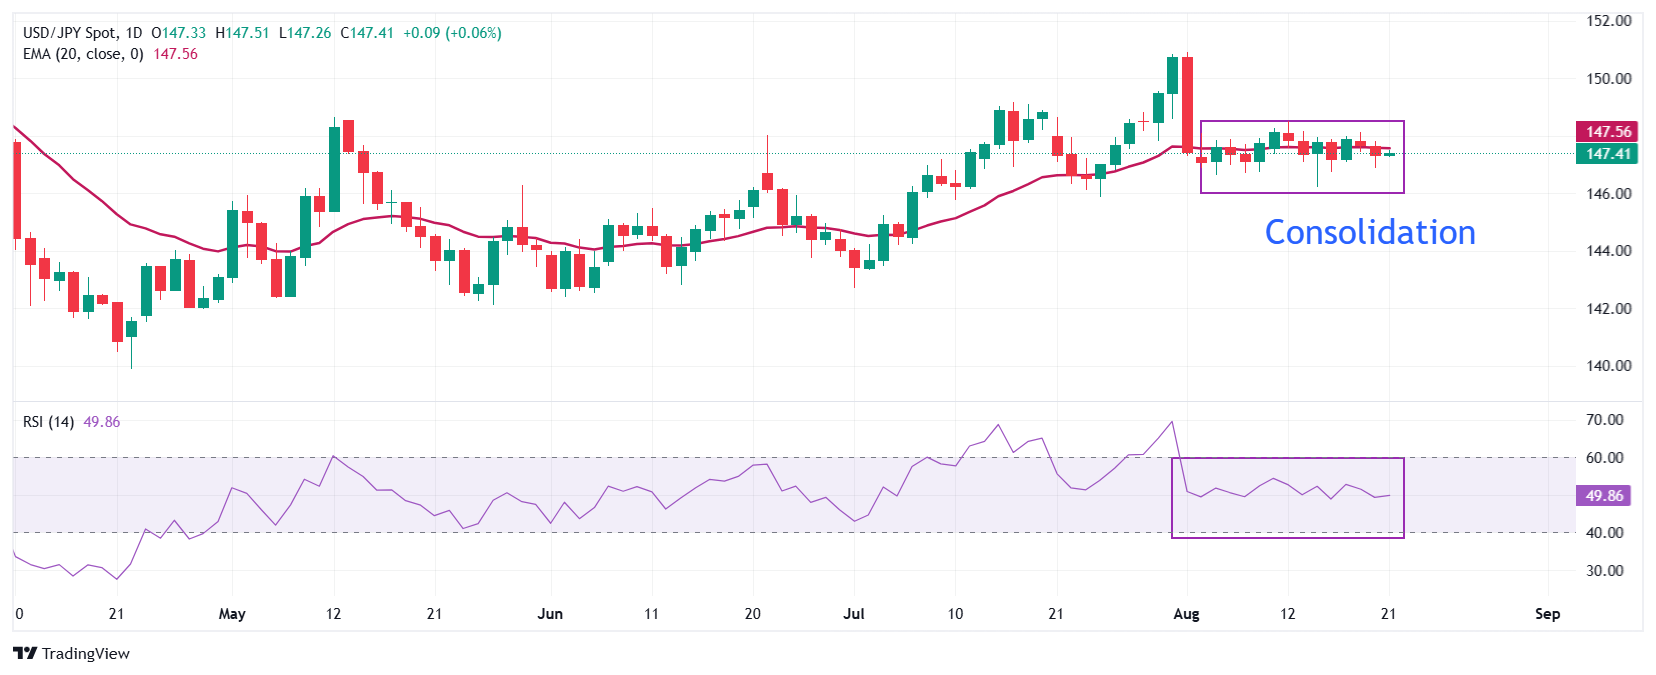
USD/JPY has been trading sideways in a range between 146.22 and 148.52 from almost three weeks. The pair trades close to the 20-day Exponential Moving Average (EMA) around 147.56, indicating a sideways trend.
The 14-day Relative Strength Index (RSI) oscillates inside the 40.00-60.00 range, suggesting indecisiveness among market participants.
The pair would see more upside to near the psychological level of 150.00 and the March 28 high of 151.20 if it breaks above the July 16 high of 149.19.
On the flip side, a reversal move by the pair below the July 24 low of 145.85 would pave the way for the July 7 low at 144.22, followed by the July 3 low of 143.45.
USD/JPY daily chart
US Dollar FAQs
The US Dollar (USD) is the official currency of the United States of America, and the ‘de facto’ currency of a significant number of other countries where it is found in circulation alongside local notes. It is the most heavily traded currency in the world, accounting for over 88% of all global foreign exchange turnover, or an average of $6.6 trillion in transactions per day, according to data from 2022. Following the second world war, the USD took over from the British Pound as the world’s reserve currency. For most of its history, the US Dollar was backed by Gold, until the Bretton Woods Agreement in 1971 when the Gold Standard went away.
The most important single factor impacting on the value of the US Dollar is monetary policy, which is shaped by the Federal Reserve (Fed). The Fed has two mandates: to achieve price stability (control inflation) and foster full employment. Its primary tool to achieve these two goals is by adjusting interest rates. When prices are rising too quickly and inflation is above the Fed’s 2% target, the Fed will raise rates, which helps the USD value. When inflation falls below 2% or the Unemployment Rate is too high, the Fed may lower interest rates, which weighs on the Greenback.
In extreme situations, the Federal Reserve can also print more Dollars and enact quantitative easing (QE). QE is the process by which the Fed substantially increases the flow of credit in a stuck financial system. It is a non-standard policy measure used when credit has dried up because banks will not lend to each other (out of the fear of counterparty default). It is a last resort when simply lowering interest rates is unlikely to achieve the necessary result. It was the Fed’s weapon of choice to combat the credit crunch that occurred during the Great Financial Crisis in 2008. It involves the Fed printing more Dollars and using them to buy US government bonds predominantly from financial institutions. QE usually leads to a weaker US Dollar.
Quantitative tightening (QT) is the reverse process whereby the Federal Reserve stops buying bonds from financial institutions and does not reinvest the principal from the bonds it holds maturing in new purchases. It is usually positive for the US Dollar.
추천 기사


